NLRB Stats Archive › Annual Reports › FY1978 › Cases received, by case type and industrial group
Cases received, by case type and industrial group
| Industrial group | All cases | All C cases | CA | CB | CC | CD | CE | CG | CP | All R cases | RC | RM | RD | UD | AC | UC | |
|---|---|---|---|---|---|---|---|---|---|---|---|---|---|---|---|---|---|
| Mining (total) | 916 | 758 | 444 | 160 | 117 | 3 | 6 | 0 | 28 | 101 | 82 | 123 | 17 | 21 | 1 | 4 | |
| Construction | 4,729 | 4,245 | 1,646 | 1,067 | 902 | 243 | 82 | 0 | 245 | 430 | 322 | 120 | 32 | 5 | 0 | 9 | |
| Services (total) | 7,586 | 5,174 | 2,878 | 999 | 146 | 23 | 25 | 59 | 43 | 2,267 | 1,867 | 104 | 296 | 55 | 19 | 71 | |
| Public administration | 49 | 35 | 21 | 7 | 6 | 0 | 0 | 1 | 0 | 14 | 14 | 0 | 0 | 0 | 0 | 0 | |
| Total, all industrial groups | 53,261 | 39,653 | 27,036 | 9,469 | 1,961 | 405 | 179 | 59 | 523 | 12,902 | 10,338 | 810 | 1,754 | 298 | 82 | 227 |
Source image
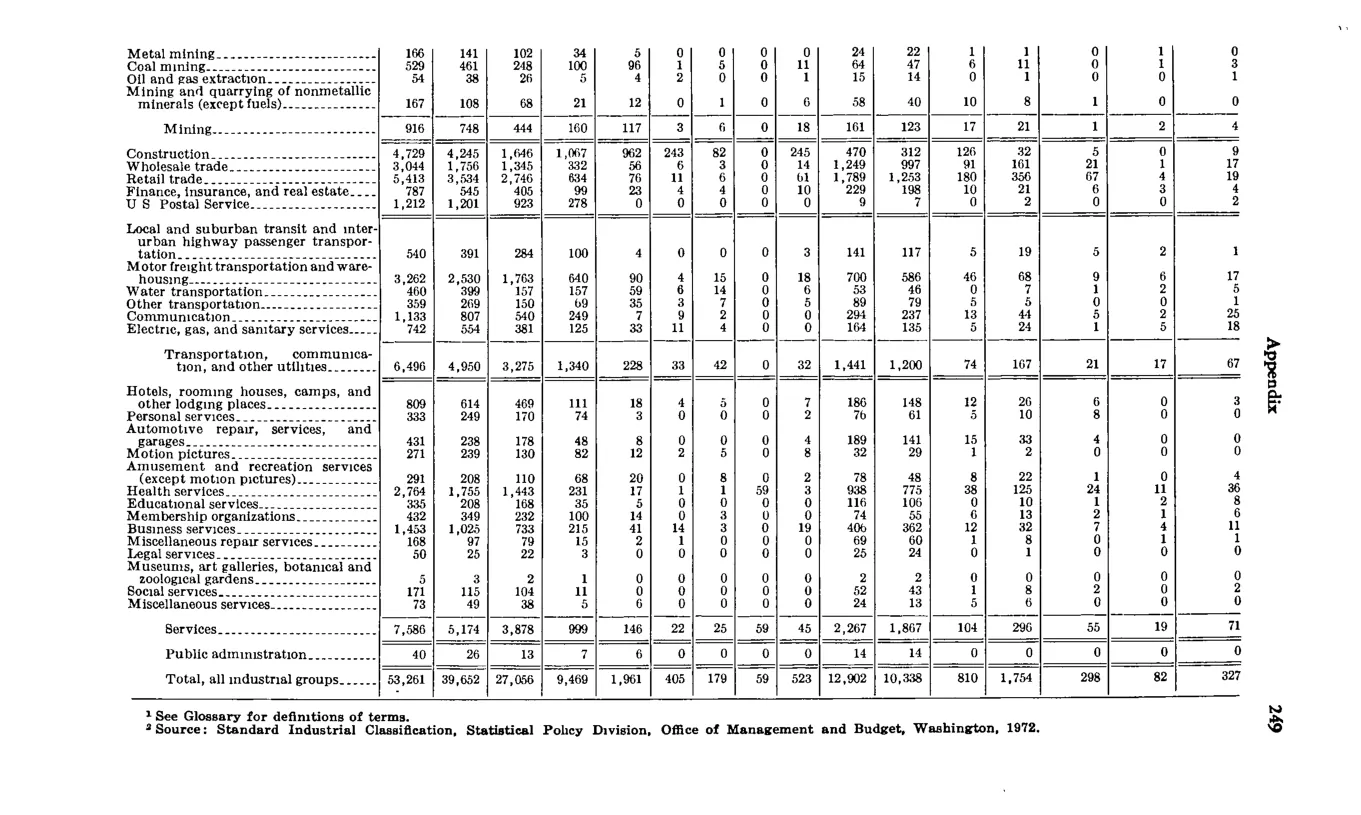
Source data: U.S. NLRB Annual Reports (public domain). Reconstruction by NLRB Stats Archive. Updated June 2026.