NLRB Stats Archive › Annual Reports › FY1977 › Distribution of Unfair Labor Practice Situations Received, by Number of Employees in Establishments, Fiscal Year 1977
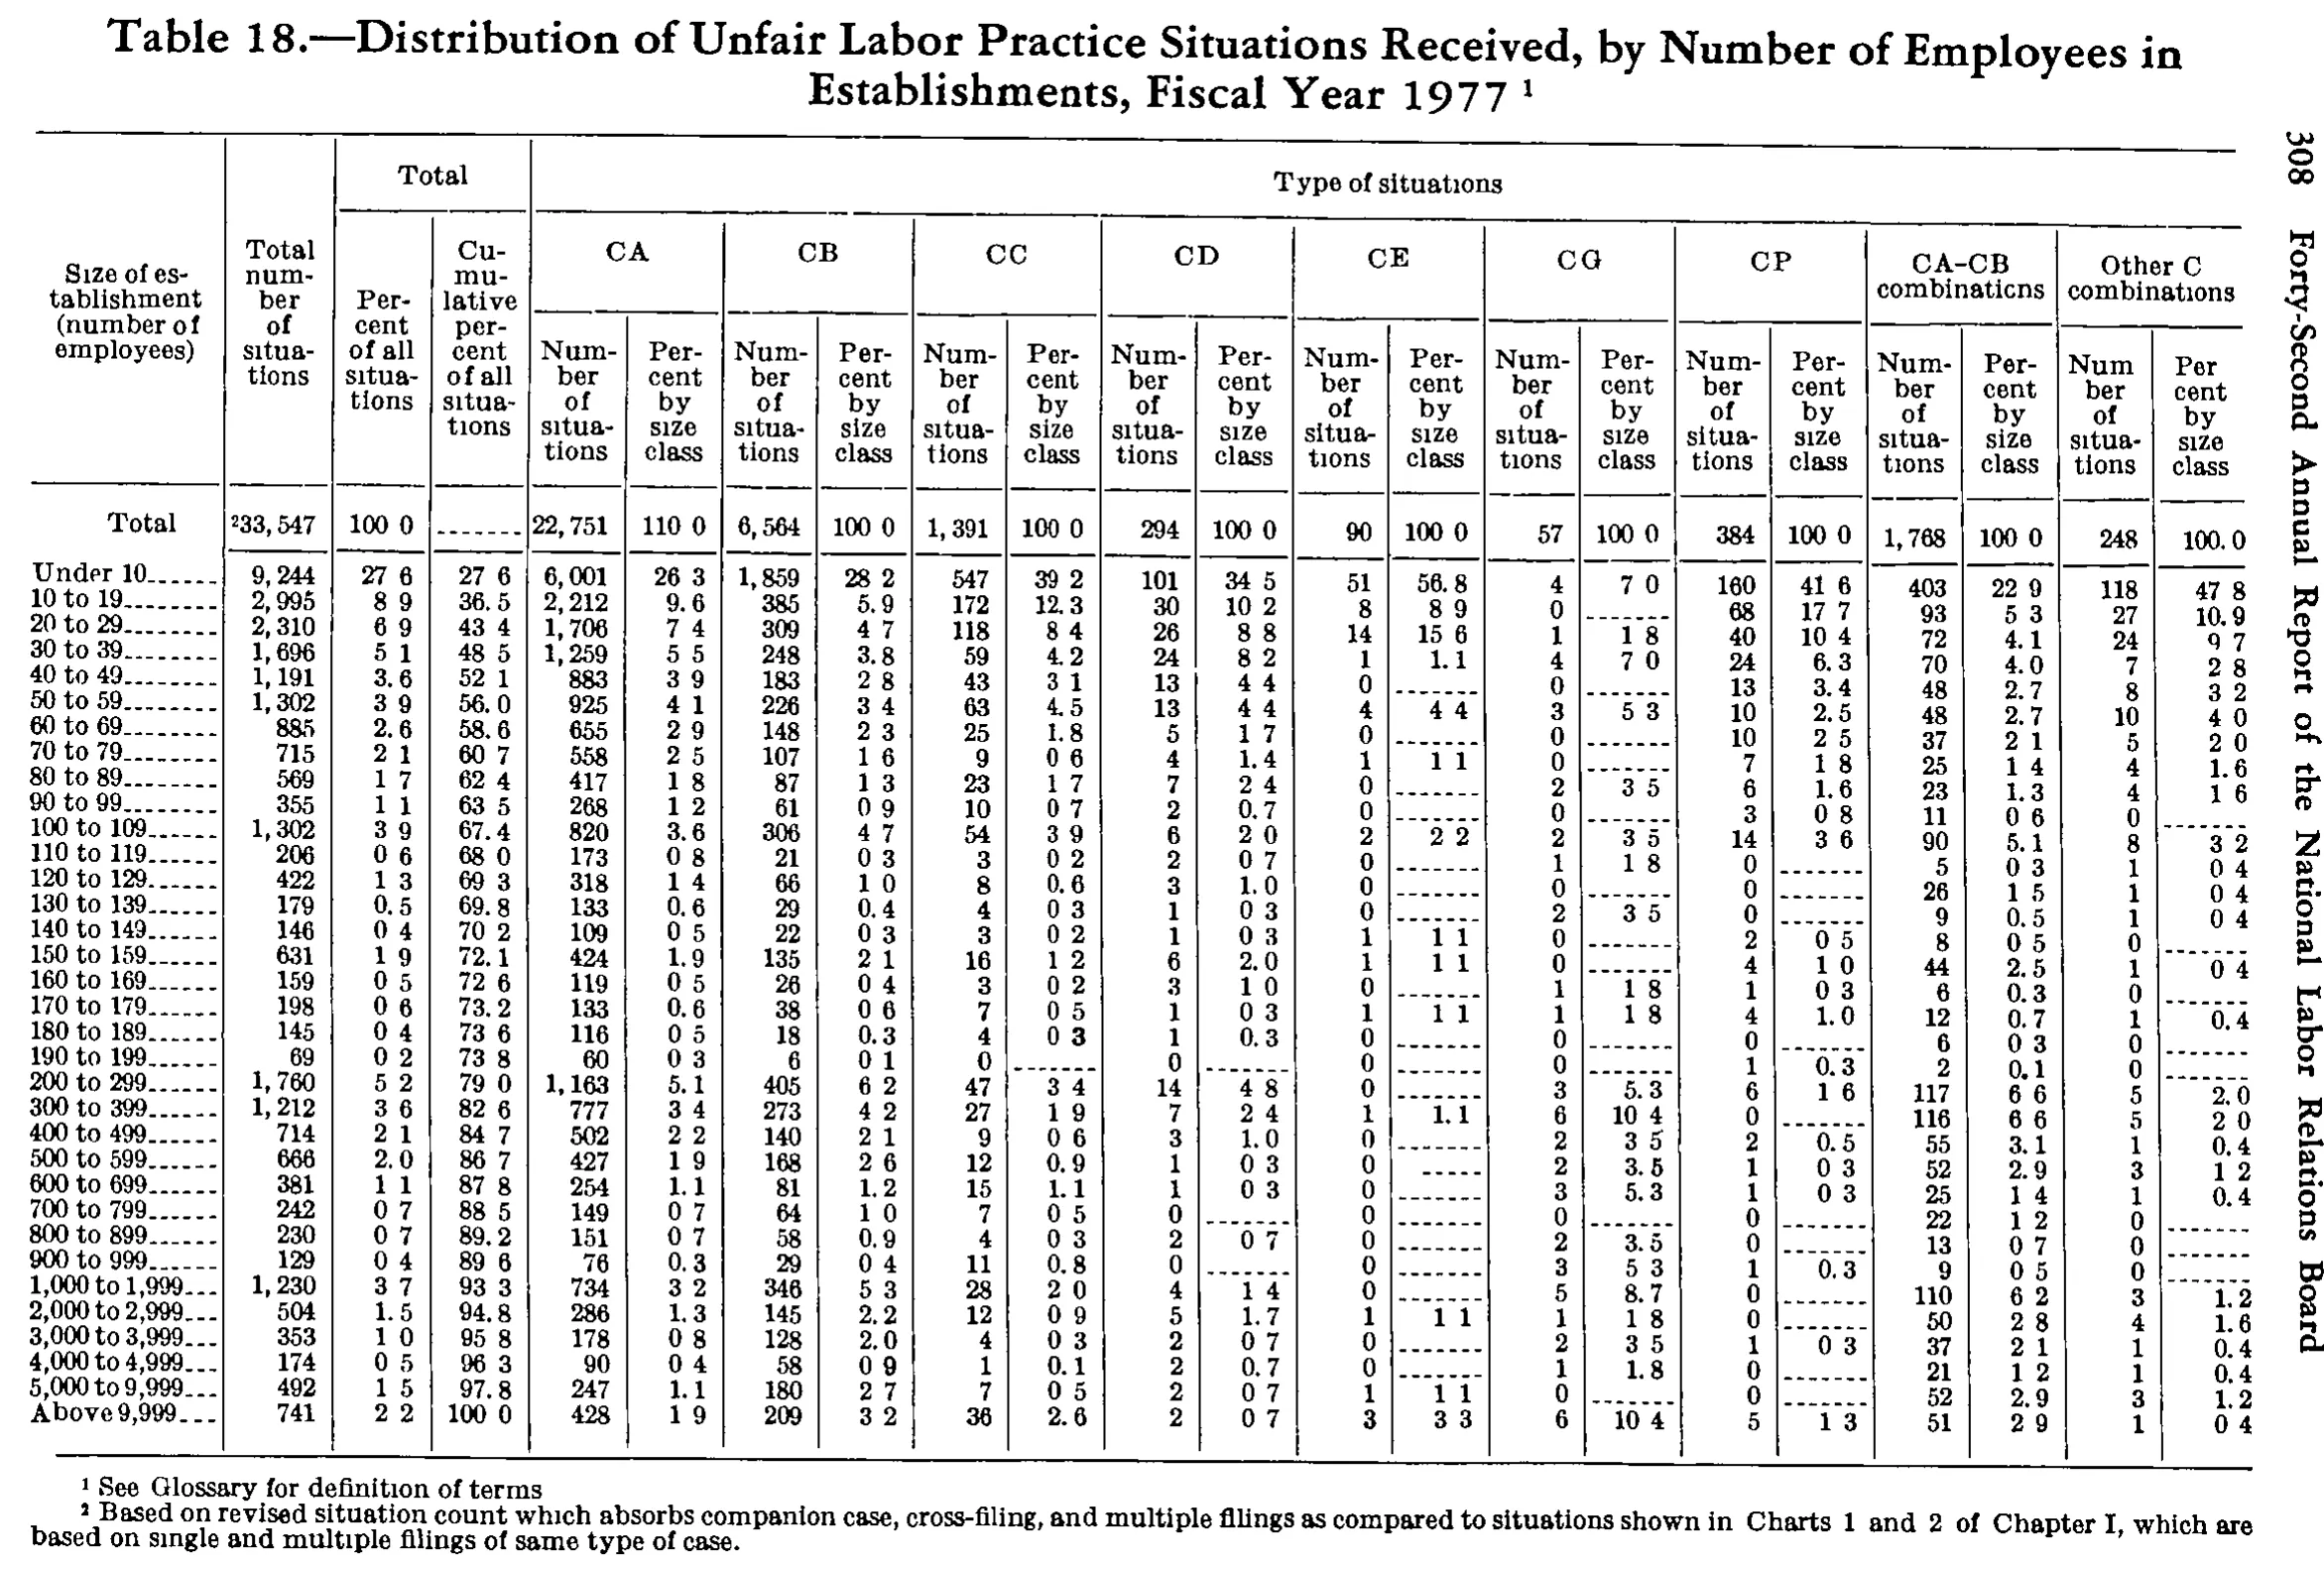
Distribution of Unfair Labor Practice Situations Received, by Number of Employees in Establishments, Fiscal Year 1977
| Size of establishment (number of employees) | Total number of situations | Total | Type of situations | ||||||||||||||||||
|---|---|---|---|---|---|---|---|---|---|---|---|---|---|---|---|---|---|---|---|---|---|
| Size of establishment (number of employees) | Total number of situations | Percent of all situations | Cumulative percent of all situations | CA | CB | CC | CD | CE | CG | CP | CA-CB combinations | Other C combinations | |||||||||
| Size of establishment (number of employees) | Total number of situations | Percent of all situations | Cumulative percent of all situations | Number of situations | Percent by size class | Number of situations | Percent by size class | Number of situations | Percent by size class | Number of situations | Percent by size class | Number of situations | Percent by size class | Number of situations | Percent by size class | Number of situations | Percent by size class | Number of situations | Percent by size class | Number of situations | Percent by size class |
| Total | 33,547 | 100.0 | 22,751 | 110.0 | 6,564 | 100.0 | 1,391 | 100.0 | 294 | 100.0 | 90 | 100.0 | 57 | 100.0 | 384 | 100.0 | 1,768 | 100.0 | 248 | 100.0 | |
| Under 10 | 9,244 | 27.6 | 27.6 | 6,001 | 26.3 | 1,859 | 28.2 | 547 | 39.2 | 101 | 34.5 | 51 | 56.8 | 4 | 7.0 | 160 | 41.6 | 403 | 22.9 | 118 | 47.8 |
| 10 to 19 | 2,995 | 8.9 | 36.5 | 2,212 | 9.6 | 385 | 5.9 | 172 | 12.3 | 30 | 10.2 | 8 | 8.9 | 0 | 68 | 17.7 | 93 | 5.3 | 27 | 10.9 | |
| 20 to 29 | 2,310 | 6.9 | 43.4 | 1,706 | 7.4 | 309 | 4.7 | 118 | 8.4 | 26 | 8.8 | 14 | 15.6 | 1 | 1.8 | 40 | 10.4 | 72 | 4.1 | 24 | 9.7 |
| 30 to 39 | 1,696 | 5.1 | 48.5 | 1,259 | 5.5 | 248 | 3.8 | 59 | 4.2 | 24 | 8.2 | 1 | 1.1 | 4 | 7.0 | 24 | 6.3 | 70 | 4.0 | 7 | 2.8 |
| 40 to 49 | 1,191 | 3.6 | 52.1 | 883 | 3.9 | 183 | 2.8 | 43 | 3.1 | 13 | 4.4 | 0 | 0 | 13 | 3.4 | 48 | 2.7 | 8 | 3.2 | ||
| 50 to 59 | 1,302 | 3.9 | 56.0 | 925 | 4.1 | 226 | 3.4 | 63 | 4.5 | 13 | 4.4 | 4 | 4.4 | 3 | 5.3 | 10 | 2.6 | 48 | 2.7 | 10 | 4.0 |
| 60 to 69 | 885 | 2.6 | 58.6 | 655 | 2.9 | 148 | 2.3 | 25 | 1.8 | 5 | 1.7 | 0 | 0 | 10 | 2.5 | 37 | 2.1 | 5 | 2.0 | ||
| 70 to 79 | 715 | 2.1 | 60.7 | 558 | 2.5 | 107 | 1.6 | 9 | 0.6 | 4 | 1.4 | 1 | 1.1 | 0 | 7 | 1.8 | 25 | 1.4 | 4 | 1.6 | |
| 80 to 89 | 569 | 1.7 | 62.4 | 417 | 1.8 | 87 | 1.3 | 23 | 1.7 | 7 | 2.4 | 0 | 2 | 3.5 | 6 | 1.6 | 23 | 1.3 | 4 | 1.6 | |
| 90 to 99 | 355 | 1.1 | 63.5 | 268 | 1.2 | 61 | 0.9 | 10 | 0.7 | 2 | 0.7 | 0 | 0 | 3 | 0.8 | 11 | 0.6 | 0 | |||
| 100 to 109 | 1,302 | 3.9 | 67.4 | 820 | 3.6 | 306 | 4.7 | 54 | 3.9 | 6 | 2.0 | 2 | 2.2 | 2 | 3.5 | 14 | 3.6 | 90 | 5.1 | 8 | 3.2 |
| 110 to 119 | 206 | 0.6 | 68.0 | 173 | 0.8 | 21 | 0.3 | 3 | 0.2 | 2 | 0.7 | 0 | 1 | 1.8 | 0 | 5 | 0.3 | 1 | 0.4 | ||
| 120 to 129 | 422 | 1.3 | 69.3 | 318 | 1.4 | 66 | 1.0 | 8 | 0.6 | 3 | 1.0 | 0 | 0 | 0 | 26 | 1.5 | 1 | 0.4 | |||
| 130 to 139 | 179 | 0.5 | 69.8 | 133 | 0.6 | 29 | 0.4 | 4 | 0.3 | 1 | 0.3 | 0 | 2 | 3.5 | 0 | 9 | 0.5 | 1 | 0.4 | ||
| 140 to 149 | 146 | 0.4 | 70.2 | 109 | 0.5 | 22 | 0.3 | 3 | 0.2 | 1 | 0.3 | 1 | 1.1 | 0 | 2 | 0.5 | 8 | 0.5 | 0 | ||
| 150 to 159 | 631 | 1.9 | 72.1 | 424 | 1.9 | 135 | 2.1 | 16 | 1.2 | 6 | 2.0 | 1 | 1.1 | 0 | 4 | 1.0 | 44 | 2.5 | 1 | 0.4 | |
| 160 to 169 | 159 | 0.5 | 72.6 | 119 | 0.5 | 26 | 0.4 | 3 | 0.2 | 3 | 1.0 | 0 | 1 | 1.8 | 1 | 0.3 | 6 | 0.3 | 0 | ||
| 170 to 179 | 198 | 0.6 | 73.2 | 133 | 0.6 | 38 | 0.6 | 7 | 0.5 | 1 | 0.3 | 1 | 1.1 | 1 | 1.8 | 4 | 1.0 | 12 | 0.7 | 1 | 0.4 |
| 180 to 189 | 145 | 0.4 | 73.6 | 116 | 0.5 | 18 | 0.3 | 4 | 0.3 | 1 | 0.3 | 1 | 1.1 | 0 | 0 | 6 | 0.3 | 0 | |||
| 190 to 199 | 69 | 0.2 | 73.8 | 60 | 0.3 | 6 | 0.1 | 0 | 0 | 0 | 0 | 1 | 0.3 | 2 | 0.1 | 0 | |||||
| 200 to 299 | 1,760 | 5.2 | 79.0 | 1,163 | 5.1 | 405 | 6.2 | 47 | 3.4 | 14 | 4.8 | 0 | 3 | 5.3 | 6 | 1.6 | 117 | 6.6 | 5 | 2.0 | |
| 300 to 399 | 1,212 | 3.6 | 82.6 | 777 | 3.4 | 273 | 4.2 | 27 | 1.9 | 7 | 2.4 | 1 | 1.1 | 6 | 10.4 | 0 | 116 | 6.6 | 5 | 2.0 | |
| 400 to 499 | 714 | 2.1 | 84.7 | 502 | 2.2 | 140 | 2.1 | 9 | 0.6 | 3 | 1.0 | 0 | 2 | 3.5 | 2 | 0.5 | 55 | 3.1 | 1 | 0.4 | |
| 500 to 599 | 666 | 2.0 | 86.7 | 427 | 1.9 | 168 | 2.6 | 12 | 0.9 | 1 | 0.3 | 0 | 2 | 3.5 | 1 | 0.3 | 52 | 2.9 | 3 | 1.2 | |
| 600 to 699 | 381 | 1.1 | 87.8 | 254 | 1.1 | 81 | 1.2 | 15 | 1.1 | 1 | 0.3 | 0 | 3 | 5.3 | 1 | 0.3 | 25 | 1.4 | 1 | 0.4 | |
| 700 to 799 | 242 | 0.7 | 88.5 | 149 | 0.7 | 64 | 1.0 | 7 | 0.5 | 0 | 0 | 0 | 0 | 22 | 1.2 | 0 | |||||
| 800 to 899 | 230 | 0.7 | 89.2 | 151 | 0.7 | 58 | 0.9 | 4 | 0.3 | 2 | 0.7 | 0 | 2 | 3.5 | 0 | 13 | 0.7 | 0 | |||
| 900 to 999 | 129 | 0.4 | 89.6 | 76 | 0.3 | 29 | 0.4 | 11 | 0.8 | 0 | 0 | 3 | 5.3 | 1 | 0.3 | 9 | 0.5 | 0 | |||
| 1,000 to 1,999 | 1,230 | 3.7 | 93.3 | 734 | 3.2 | 346 | 5.3 | 28 | 2.0 | 4 | 1.4 | 0 | 5 | 8.7 | 0 | 110 | 6.2 | 3 | 1.2 | ||
| 2,000 to 2,999 | 504 | 1.5 | 94.8 | 286 | 1.3 | 145 | 2.2 | 12 | 0.9 | 5 | 1.7 | 1 | 1.1 | 1 | 1.8 | 0 | 50 | 2.8 | 4 | 1.6 | |
| 3,000 to 3,999 | 353 | 1.0 | 95.8 | 178 | 0.8 | 128 | 2.0 | 4 | 0.3 | 2 | 0.7 | 0 | 2 | 3.5 | 1 | 0.3 | 37 | 2.1 | 1 | 0.4 | |
| 4,000 to 4,999 | 174 | 0.5 | 96.3 | 90 | 0.4 | 58 | 0.9 | 1 | 0.1 | 2 | 0.7 | 0 | 1 | 1.8 | 0 | 21 | 1.2 | 1 | 0.4 | ||
| 5,000 to 9,999 | 492 | 1.5 | 97.8 | 247 | 1.1 | 180 | 2.7 | 7 | 0.5 | 2 | 0.7 | 1 | 1.1 | 0 | 0 | 52 | 2.9 | 3 | 1.2 | ||
| Above 9,999 | 741 | 2.2 | 100.0 | 428 | 1.9 | 209 | 3.2 | 36 | 2.6 | 2 | 0.7 | 3 | 3.3 | 6 | 10.4 | 5 | 1.3 | 51 | 2.9 | 1 | 0.4 |
- 1 See Glossary for definition of terms
- 2 Based on revised situation count which absorbs companion case, cross-filing, and multiple filings as compared to situations shown in Charts 1 and 2 of Chapter I, which are based on single and multiple filings of same type of case.
295 of 296 figures sit in a row or column sum that works out. 2 cells break a sum: '180 to 189', column 2: prints 145, the subtotals in columns 5 to 21 add to 146; 'Total', column 13: prints 90, rows 'Under 10' to 'Above 9,999' add to 91.
Reader’s notes
p. 323. 22 printed columns: stub, "Total number of situations", the two "Total" percent columns, then nine two-column blocks (CA, CB, CC, CD, CE, CG, CP, CA-CB combinations, Other C combinations), each with "Number of situations" and "Percent by size class". Decimal points: the 1-bit scan drops most decimal points in the percent columns (they appear as "27 6", "100 0", etc.). All percent cells are one-decimal values and are transcribed with the point; no cell was otherwise altered. Dash rules ("------") in the percent columns, and the blank cumulative-percent cell in the Total row, are transcribed as "". Suspected misprint: in the Total row, the CA "Percent by size class" cell reads "110 0" (i.e. 110.0) where every other total-row percent reads 100.0. Transcribed as printed. Doubtful cells (scan is degraded; single digits in the narrow right-hand columns are hard to separate). Where I could not read a glyph with confidence I checked the cell against the printed column total and against the matching percent, both of which are internally exact elsewhere in this table: - "10 to 19" / CG "Number of situations": the cell carries a stray mark that could be read as a second digit. Transcribed "0"; the CG counts then sum exactly to the printed 57 and the CG percents to exactly 100.0, and this row's CG percent is a dash rule. - "800 to 899" / CD "Number of situations": read as "2" (the glyph could also be a 0); the printed percent in that cell is 0.7, and the CD counts then sum exactly to the printed 294. - "400 to 499" / CP "Number of situations": read as "2" (could also be 0); the printed percent is 0.5, and the CP counts then sum exactly to the printed 384. - "140 to 149" and "160 to 169" / Other C "Number of situations": read as "0" (each could also be a 1); both percent cells are dash rules, and the Other C counts then sum exactly to the printed 248. Unresolved discrepancy: as transcribed, the CE "Number of situations" column sums to 91 against the printed total of 90, and the CE percents sum to 101.1 rather than 100.0. Exactly one of the nine rows carrying "1 / 1.1" in the CE block (30 to 39, 70 to 79, 140 to 149, 150 to 159, 170 to 179, 180 to 189, 300 to 399, 2,000 to 2,999, 5,000 to 9,999) is probably a 0 with a dash rule, but I could not tell which at this resolution, so all nine are left as read. Minor printed rounding oddities, transcribed as printed and not corrected: Total-row percent bases give 56.7 rather than the printed 56.8 (Under 10 / CE), 22.8 rather than 22.9 (Under 10 / CA-CB), 47.6 rather than 47.8 (Under 10 / Other C), 10.5 rather than 10.4 (300 to 399 and Above 9,999 / CG), 8.8 rather than 8.7 (1,000 to 1,999 / CG), and 2.6 rather than 2.5 (60 to 69 / CP). The caption carries footnote marker 1 and is omitted per instructions; the superscript 2 on the Total row's situation count is kept as "33,547^2".
Source image
Source data: U.S. NLRB Annual Reports (public domain). Reconstruction by NLRB Stats Archive. Read by claude-opus-5 (effort max, prompt extract_v1) from the 300-dpi scan; stitched by page. Updated October 2026.