NLRB Stats Archive › Annual Reports › FY1977 › Standard Federal Administrative Regional Distribution of Cases Received, Fiscal Year 1977
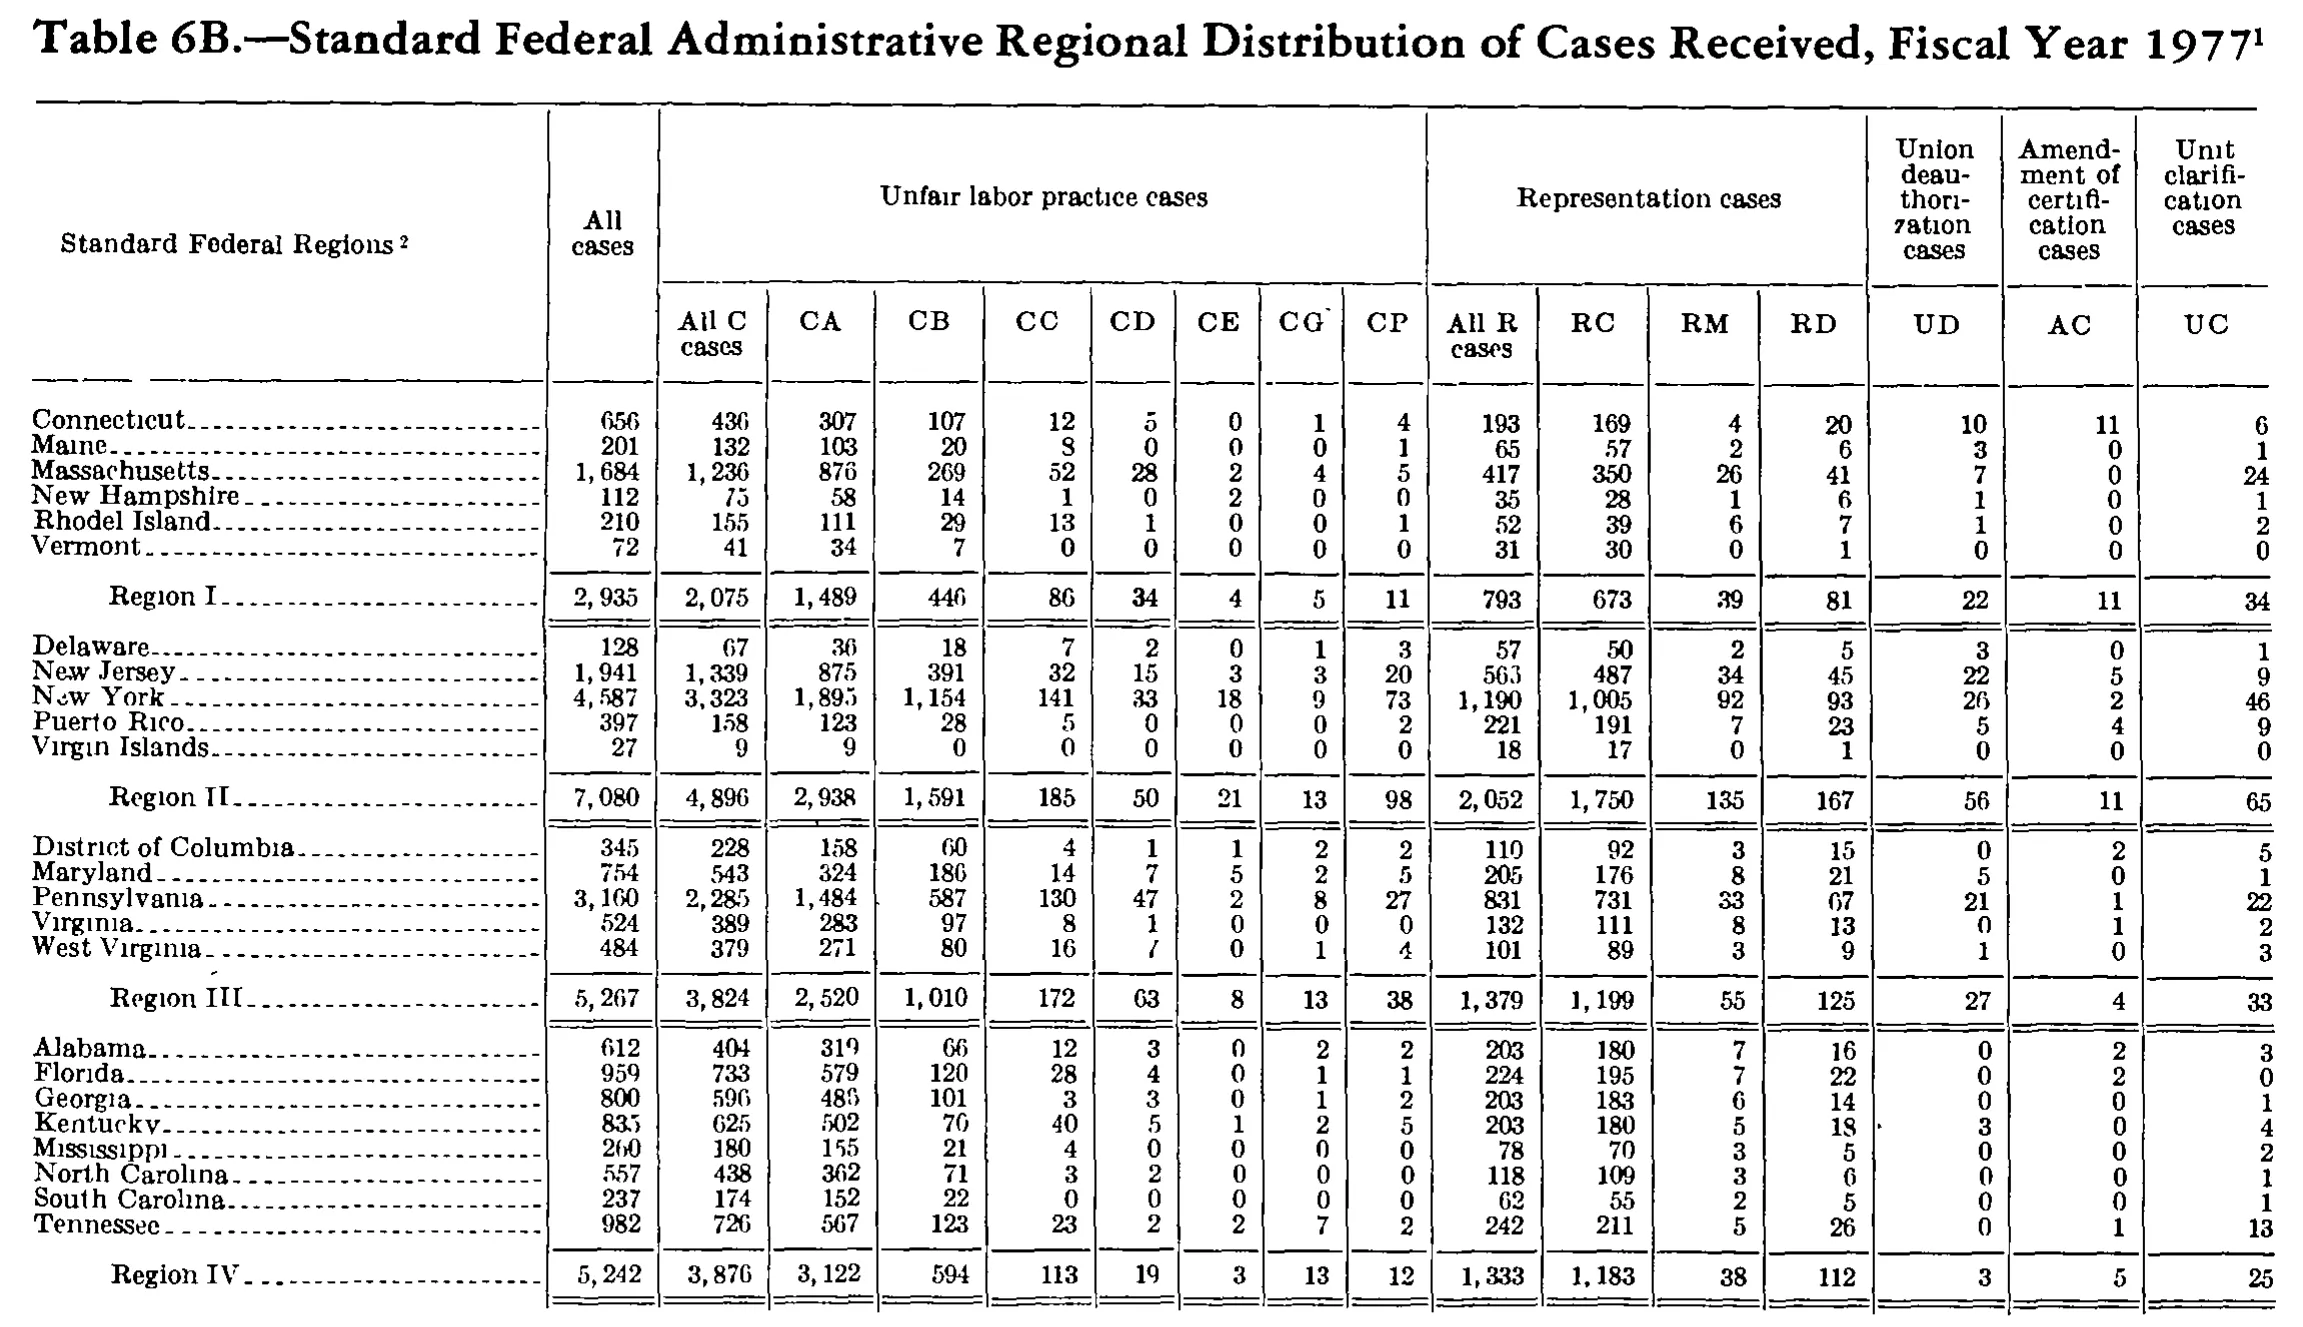
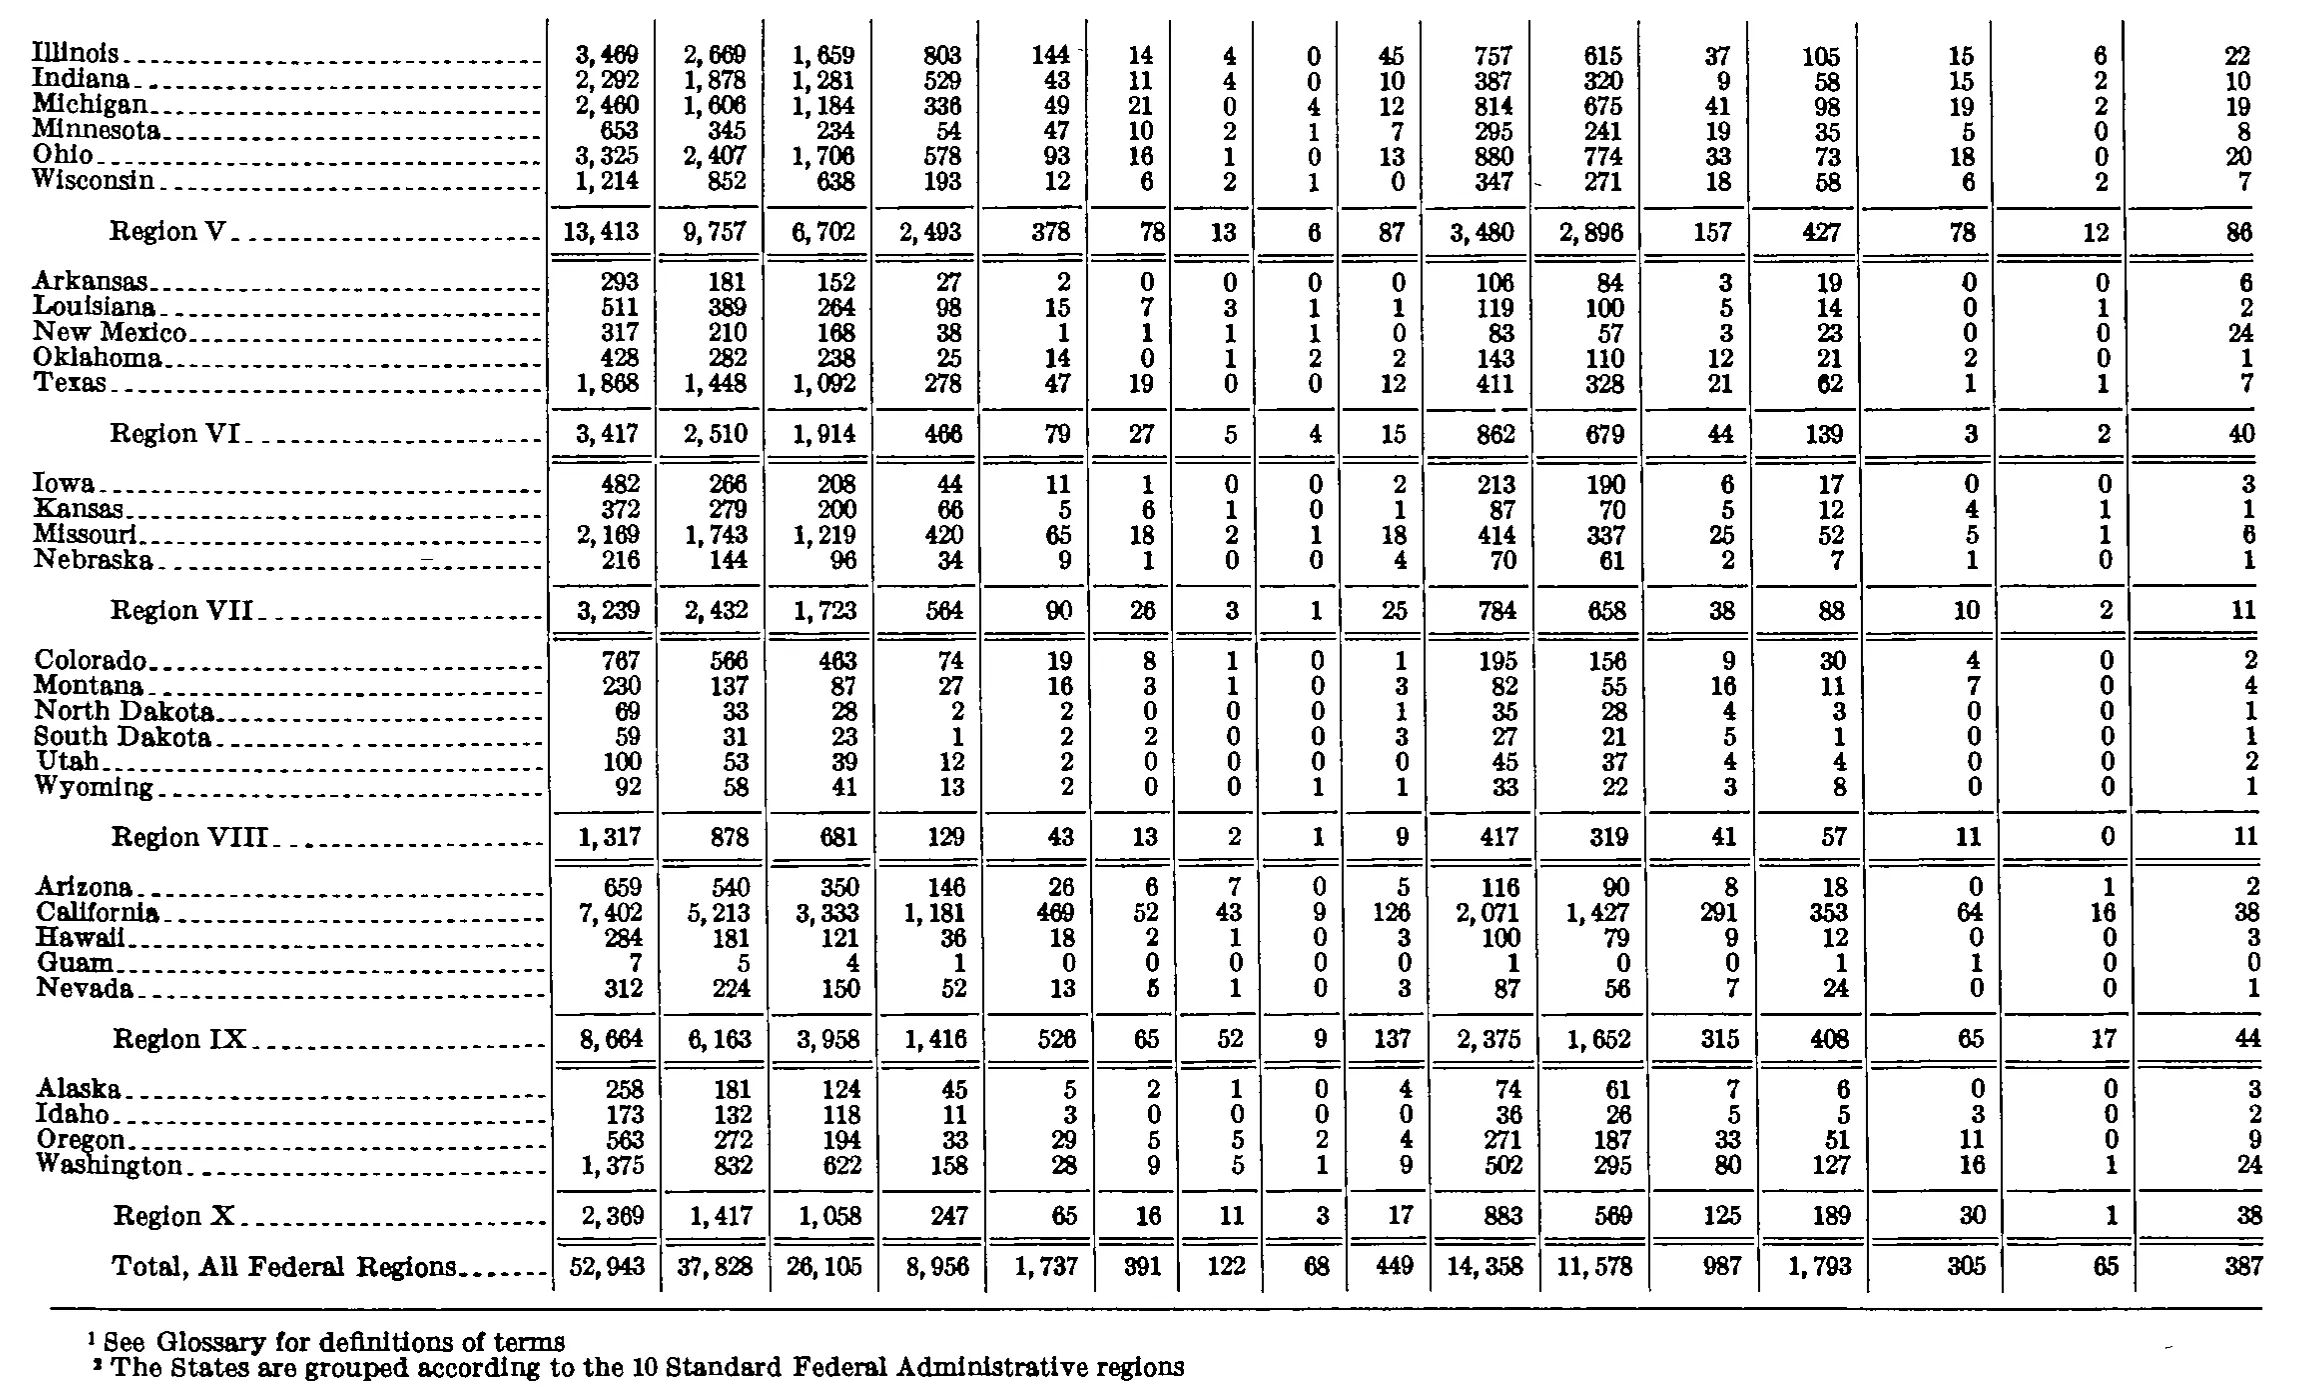
Standard Federal Administrative Regional Distribution of Cases Received, Fiscal Year 1977
Stitched from pp. 295–296.
| Standard Federal Regions | All cases | Unfair labor practice cases | Representation cases | Union deauthorization cases | Amendment of certification cases | Unit clarification cases | ||||||||||
|---|---|---|---|---|---|---|---|---|---|---|---|---|---|---|---|---|
| Standard Federal Regions | All cases | All C cases | CA | CB | CC | CD | CE | CG | CP | All R cases | RC | RM | RD | UD | AC | UC |
| Connecticut | 656 | 436 | 307 | 107 | 12 | 5 | 0 | 1 | 4 | 193 | 169 | 4 | 20 | 10 | 11 | 6 |
| Maine | 201 | 132 | 103 | 20 | 8 | 0 | 0 | 0 | 1 | 65 | 57 | 2 | 6 | 3 | 0 | 1 |
| Massachusetts | 1,684 | 1,236 | 876 | 269 | 52 | 28 | 2 | 4 | 5 | 417 | 350 | 26 | 41 | 7 | 0 | 24 |
| New Hampshire | 112 | 75 | 58 | 14 | 1 | 0 | 2 | 0 | 0 | 35 | 28 | 1 | 6 | 1 | 0 | 1 |
| Rhode Island | 210 | 155 | 111 | 29 | 13 | 1 | 0 | 0 | 1 | 52 | 39 | 6 | 7 | 1 | 0 | 2 |
| Vermont | 72 | 41 | 34 | 7 | 0 | 0 | 0 | 0 | 0 | 31 | 30 | 0 | 1 | 0 | 0 | 0 |
| Region I | 2,935 | 2,075 | 1,489 | 446 | 86 | 34 | 4 | 5 | 11 | 793 | 673 | 39 | 81 | 22 | 11 | 34 |
| Delaware | 128 | 67 | 36 | 18 | 7 | 2 | 0 | 1 | 3 | 57 | 50 | 2 | 5 | 3 | 0 | 1 |
| New Jersey | 1,941 | 1,339 | 875 | 391 | 32 | 15 | 3 | 3 | 20 | 566 | 487 | 34 | 45 | 22 | 5 | 9 |
| New York | 4,587 | 3,323 | 1,895 | 1,154 | 141 | 33 | 18 | 9 | 73 | 1,190 | 1,005 | 92 | 93 | 26 | 2 | 46 |
| Puerto Rico | 397 | 158 | 123 | 28 | 5 | 0 | 0 | 0 | 2 | 221 | 191 | 7 | 23 | 5 | 4 | 9 |
| Virgin Islands | 27 | 9 | 9 | 0 | 0 | 0 | 0 | 0 | 0 | 18 | 17 | 0 | 1 | 0 | 0 | 0 |
| Region II | 7,080 | 4,896 | 2,938 | 1,591 | 185 | 50 | 21 | 13 | 98 | 2,052 | 1,750 | 135 | 167 | 56 | 11 | 65 |
| District of Columbia | 345 | 228 | 158 | 60 | 4 | 1 | 1 | 2 | 2 | 110 | 92 | 3 | 15 | 0 | 2 | 5 |
| Maryland | 754 | 543 | 324 | 186 | 14 | 7 | 5 | 2 | 5 | 205 | 176 | 8 | 21 | 5 | 0 | 1 |
| Pennsylvania | 3,160 | 2,285 | 1,484 | 587 | 130 | 47 | 2 | 8 | 27 | 831 | 731 | 33 | 67 | 21 | 1 | 22 |
| Virginia | 524 | 389 | 283 | 97 | 8 | 1 | 0 | 0 | 0 | 132 | 111 | 8 | 13 | 0 | 1 | 2 |
| West Virginia | 484 | 379 | 271 | 80 | 16 | 7 | 0 | 1 | 4 | 101 | 89 | 3 | 9 | 1 | 0 | 3 |
| Region III | 5,267 | 3,824 | 2,520 | 1,010 | 172 | 63 | 8 | 13 | 38 | 1,379 | 1,199 | 55 | 125 | 27 | 4 | 33 |
| Alabama | 612 | 404 | 319 | 66 | 12 | 3 | 0 | 2 | 2 | 203 | 180 | 7 | 16 | 0 | 2 | 3 |
| Florida | 959 | 733 | 579 | 120 | 28 | 4 | 0 | 1 | 1 | 224 | 195 | 7 | 22 | 0 | 2 | 0 |
| Georgia | 800 | 596 | 486 | 101 | 3 | 3 | 0 | 1 | 2 | 203 | 183 | 6 | 14 | 0 | 0 | 1 |
| Kentucky | 835 | 625 | 502 | 70 | 40 | 5 | 1 | 2 | 5 | 203 | 180 | 5 | 18 | 3 | 0 | 4 |
| Mississippi | 260 | 180 | 155 | 21 | 4 | 0 | 0 | 0 | 0 | 78 | 70 | 3 | 5 | 0 | 0 | 2 |
| North Carolina | 557 | 438 | 362 | 71 | 3 | 2 | 0 | 0 | 0 | 118 | 109 | 3 | 6 | 0 | 0 | 1 |
| South Carolina | 237 | 174 | 152 | 22 | 0 | 0 | 0 | 0 | 0 | 62 | 55 | 2 | 5 | 0 | 0 | 1 |
| Tennessee | 982 | 726 | 567 | 123 | 23 | 2 | 2 | 7 | 2 | 242 | 211 | 5 | 26 | 0 | 1 | 13 |
| Region IV | 5,242 | 3,876 | 3,122 | 594 | 113 | 19 | 3 | 13 | 12 | 1,333 | 1,183 | 38 | 112 | 3 | 5 | 25 |
| Illinois | 3,469 | 2,669 | 1,659 | 803 | 144 | 14 | 4 | 0 | 45 | 757 | 615 | 37 | 105 | 15 | 6 | 22 |
| Indiana | 2,292 | 1,878 | 1,281 | 529 | 43 | 11 | 4 | 0 | 10 | 387 | 320 | 9 | 58 | 15 | 2 | 10 |
| Michigan | 2,460 | 1,606 | 1,184 | 336 | 49 | 21 | 0 | 4 | 12 | 814 | 675 | 41 | 98 | 19 | 2 | 19 |
| Minnesota | 653 | 345 | 234 | 54 | 47 | 10 | 2 | 1 | 7 | 295 | 241 | 19 | 35 | 5 | 0 | 8 |
| Ohio | 3,325 | 2,407 | 1,706 | 578 | 93 | 16 | 1 | 0 | 13 | 880 | 774 | 33 | 73 | 18 | 0 | 20 |
| Wisconsin | 1,214 | 852 | 638 | 193 | 12 | 6 | 2 | 1 | 0 | 347 | 271 | 18 | 58 | 6 | 2 | 7 |
| Region V | 13,413 | 9,757 | 6,702 | 2,493 | 378 | 78 | 13 | 6 | 87 | 3,480 | 2,896 | 157 | 427 | 78 | 12 | 86 |
| Arkansas | 293 | 181 | 152 | 27 | 2 | 0 | 0 | 0 | 0 | 106 | 84 | 3 | 19 | 0 | 0 | 6 |
| Louisiana | 511 | 389 | 264 | 98 | 15 | 7 | 3 | 1 | 1 | 119 | 100 | 5 | 14 | 0 | 1 | 2 |
| New Mexico | 317 | 210 | 168 | 38 | 1 | 1 | 1 | 1 | 0 | 83 | 57 | 3 | 23 | 0 | 0 | 24 |
| Oklahoma | 428 | 282 | 238 | 25 | 14 | 0 | 1 | 2 | 2 | 143 | 110 | 12 | 21 | 2 | 0 | 1 |
| Texas | 1,868 | 1,448 | 1,092 | 278 | 47 | 19 | 0 | 0 | 12 | 411 | 328 | 21 | 62 | 1 | 1 | 7 |
| Region VI | 3,417 | 2,510 | 1,914 | 466 | 79 | 27 | 5 | 4 | 15 | 862 | 679 | 44 | 139 | 3 | 2 | 40 |
| Iowa | 482 | 266 | 208 | 44 | 11 | 1 | 0 | 0 | 2 | 213 | 190 | 6 | 17 | 0 | 0 | 3 |
| Kansas | 372 | 279 | 200 | 66 | 5 | 6 | 1 | 0 | 1 | 87 | 70 | 5 | 12 | 4 | 1 | 1 |
| Missouri | 2,169 | 1,743 | 1,219 | 420 | 65 | 18 | 2 | 1 | 18 | 414 | 337 | 25 | 52 | 5 | 1 | 6 |
| Nebraska | 216 | 144 | 96 | 34 | 9 | 1 | 0 | 0 | 4 | 70 | 61 | 2 | 7 | 1 | 0 | 1 |
| Region VII | 3,239 | 2,432 | 1,723 | 564 | 90 | 26 | 3 | 1 | 25 | 784 | 658 | 38 | 88 | 10 | 2 | 11 |
| Colorado | 767 | 566 | 463 | 74 | 19 | 8 | 1 | 0 | 1 | 195 | 156 | 9 | 30 | 4 | 0 | 2 |
| Montana | 230 | 137 | 87 | 27 | 16 | 3 | 1 | 0 | 3 | 82 | 55 | 16 | 11 | 7 | 0 | 4 |
| North Dakota | 69 | 33 | 28 | 2 | 2 | 0 | 0 | 0 | 1 | 35 | 28 | 4 | 3 | 0 | 0 | 1 |
| South Dakota | 59 | 31 | 23 | 1 | 2 | 2 | 0 | 0 | 3 | 27 | 21 | 5 | 1 | 0 | 0 | 1 |
| Utah | 100 | 53 | 39 | 12 | 2 | 0 | 0 | 0 | 0 | 45 | 37 | 4 | 4 | 0 | 0 | 2 |
| Wyoming | 92 | 58 | 41 | 13 | 2 | 0 | 0 | 1 | 1 | 33 | 22 | 3 | 8 | 0 | 0 | 1 |
| Region VIII | 1,317 | 878 | 681 | 129 | 43 | 13 | 2 | 1 | 9 | 417 | 319 | 41 | 57 | 11 | 0 | 11 |
| Arizona | 659 | 540 | 350 | 146 | 26 | 6 | 7 | 0 | 5 | 116 | 90 | 8 | 18 | 0 | 1 | 2 |
| California | 7,402 | 5,213 | 3,333 | 1,181 | 469 | 52 | 43 | 9 | 126 | 2,071 | 1,427 | 291 | 353 | 64 | 16 | 38 |
| Hawaii | 284 | 181 | 121 | 36 | 18 | 2 | 1 | 0 | 3 | 100 | 79 | 9 | 12 | 0 | 0 | 3 |
| Guam | 7 | 5 | 4 | 1 | 0 | 0 | 0 | 0 | 0 | 1 | 0 | 0 | 1 | 1 | 0 | 0 |
| Nevada | 312 | 224 | 150 | 52 | 13 | 5 | 1 | 0 | 3 | 87 | 56 | 7 | 24 | 0 | 0 | 1 |
| Region IX | 8,664 | 6,163 | 3,958 | 1,416 | 526 | 65 | 52 | 9 | 137 | 2,375 | 1,652 | 315 | 408 | 65 | 17 | 44 |
| Alaska | 258 | 181 | 124 | 45 | 5 | 2 | 1 | 0 | 4 | 74 | 61 | 7 | 6 | 0 | 0 | 3 |
| Idaho | 173 | 132 | 118 | 11 | 3 | 0 | 0 | 0 | 0 | 36 | 26 | 5 | 5 | 3 | 0 | 2 |
| Oregon | 563 | 272 | 194 | 33 | 29 | 5 | 5 | 2 | 4 | 271 | 187 | 33 | 51 | 11 | 0 | 9 |
| Washington | 1,375 | 832 | 622 | 158 | 28 | 9 | 5 | 1 | 9 | 502 | 295 | 80 | 127 | 16 | 1 | 24 |
| Region X | 2,369 | 1,417 | 1,058 | 247 | 65 | 16 | 11 | 3 | 17 | 883 | 569 | 125 | 189 | 30 | 1 | 38 |
| Total, All Federal Regions | 52,943 | 37,828 | 26,105 | 8,956 | 1,737 | 391 | 122 | 68 | 449 | 14,358 | 11,578 | 987 | 1,793 | 305 | 65 | 387 |
- 1 See Glossary for definitions of terms
- 2 The States are grouped according to the 10 Standard Federal Administrative regions
887 of 888 figures sit in a row or column sum that works out. 2 cells break a sum: 'Minnesota', column 3: prints 345, columns 4 to 10 add to 355; 'Region V', column 6: prints 378, rows 'Illinois' to 'Wisconsin' add to 388.
Reader’s notes
p. 295. 17 columns: stub + "All cases" + 8 ULP columns (All C cases, CA, CB, CC, CD, CE, CG, CP) + 4 representation columns (All R cases, RC, RM, RD) + UD + AC + UC. Crop is cut off after the "Region IV" subtotal: the table continues (Regions V onward) on the following page, and the footnote texts for markers 1 (on the caption) and 2 (on the stub heading "Standard Federal Regions") are not printed on this image, so `footnotes` is empty. Doubtful cells, resolved by cross-checking against the printed row and region totals (every other cell in the grid reconciles exactly, both across each row and down each region block, which is why these readings were chosen): - New Jersey, "All R cases": the glyphs render as "563" at this scan resolution, but 487+34+45 = 566, the row's All cases 1,941 requires 566, and the Region II All R subtotal 2,052 requires 566. Transcribed as 566; worth re-checking at higher resolution. - Maine, "CG" and "CP": the scan leaves an extra stray mark in the CG/CP area. Read as CG = 0, CP = 1, which is what Maine's All C of 132 and the Region I subtotals (CG 5, CP 11) both require. - Maine, "CC": the digit renders ambiguously between 3 and 8; read as 8, which the Region I CC subtotal of 86 requires. - West Virginia, "CD": the digit is broken in the scan and looks like a slash; read as 7 (Region III CD subtotal 63 requires it). - Georgia, "CA": last digit degraded; read as 486 (Georgia All C 596 and Region IV CA subtotal 3,122 both require it). Row-label artifacts: "Rhode Island" prints with a broken "e" that reads as "Rhodel Island" in the scan; transcribed as "Rhode Island". Several other labels show similar speckle ("Connecticut", "Mississippi", "Virginia"); they are ordinary state names and were transcribed normally. A small isolated ink speck sits between the RD and UD rules on the Kentucky line; it is not a digit. No arithmetic was altered: every printed total is transcribed as printed, and all of them are internally consistent with their components.
p. 296. This crop is a continuation page: no column headings are printed on it, so header_rows is empty. The grid has 17 columns (stub + 16 numeric columns), counted from the vertical column rules; the first numeric column is the one beginning 3,469 for Illinois and the last is the one beginning 22 for Illinois. The only doubtful cell is Minnesota, 5th numeric column, which I read as "47". Every other number in the table reconciles under four independent internal checks (numeric col 2 = sum of numeric cols 3-9; numeric col 10 = cols 11+12+13; numeric col 1 = col 2 + col 10 + cols 14+15+16; each Region line = sum of its States), but Minnesota's row and the Region V line both fail by exactly 10 in that one column: 234+54+47+10+2+1+7 = 355 against the printed 345, and the Region V column sums to 388 against the printed 378. Both would reconcile exactly if the digit were 3 rather than 4 (i.e. 37). I have transcribed the glyph as it appears to me rather than substituting the arithmetically implied value; a reader should treat this cell as either a misprint or a scan artifact and prefer 37 if using the data. The leading digits in this table are all part of the numbers; the only raised characters are the footnote markers 1 and 2 under the table, which are not attached to any cell visible in this crop (the caption and column headings carrying them are on the preceding page). Blank vertical gaps separate the State blocks from their Region lines; these are spacing only, not label-bearing rows, so no empty rows are included. The table continues from the previous page (Regions I-IV are not on this crop); the "Total, All Federal Regions" line at the bottom covers all ten regions and so cannot be checked against the rows shown here alone.
Source image
Source data: U.S. NLRB Annual Reports (public domain). Reconstruction by NLRB Stats Archive. Read by claude-opus-5 (effort max, prompt extract_v1) from the 300-dpi scan; stitched by page. Updated October 2026.