NLRB Stats Archive › Annual Reports › FY1977 › Geographic Distribution of Cases Received, Fiscal Year 1977
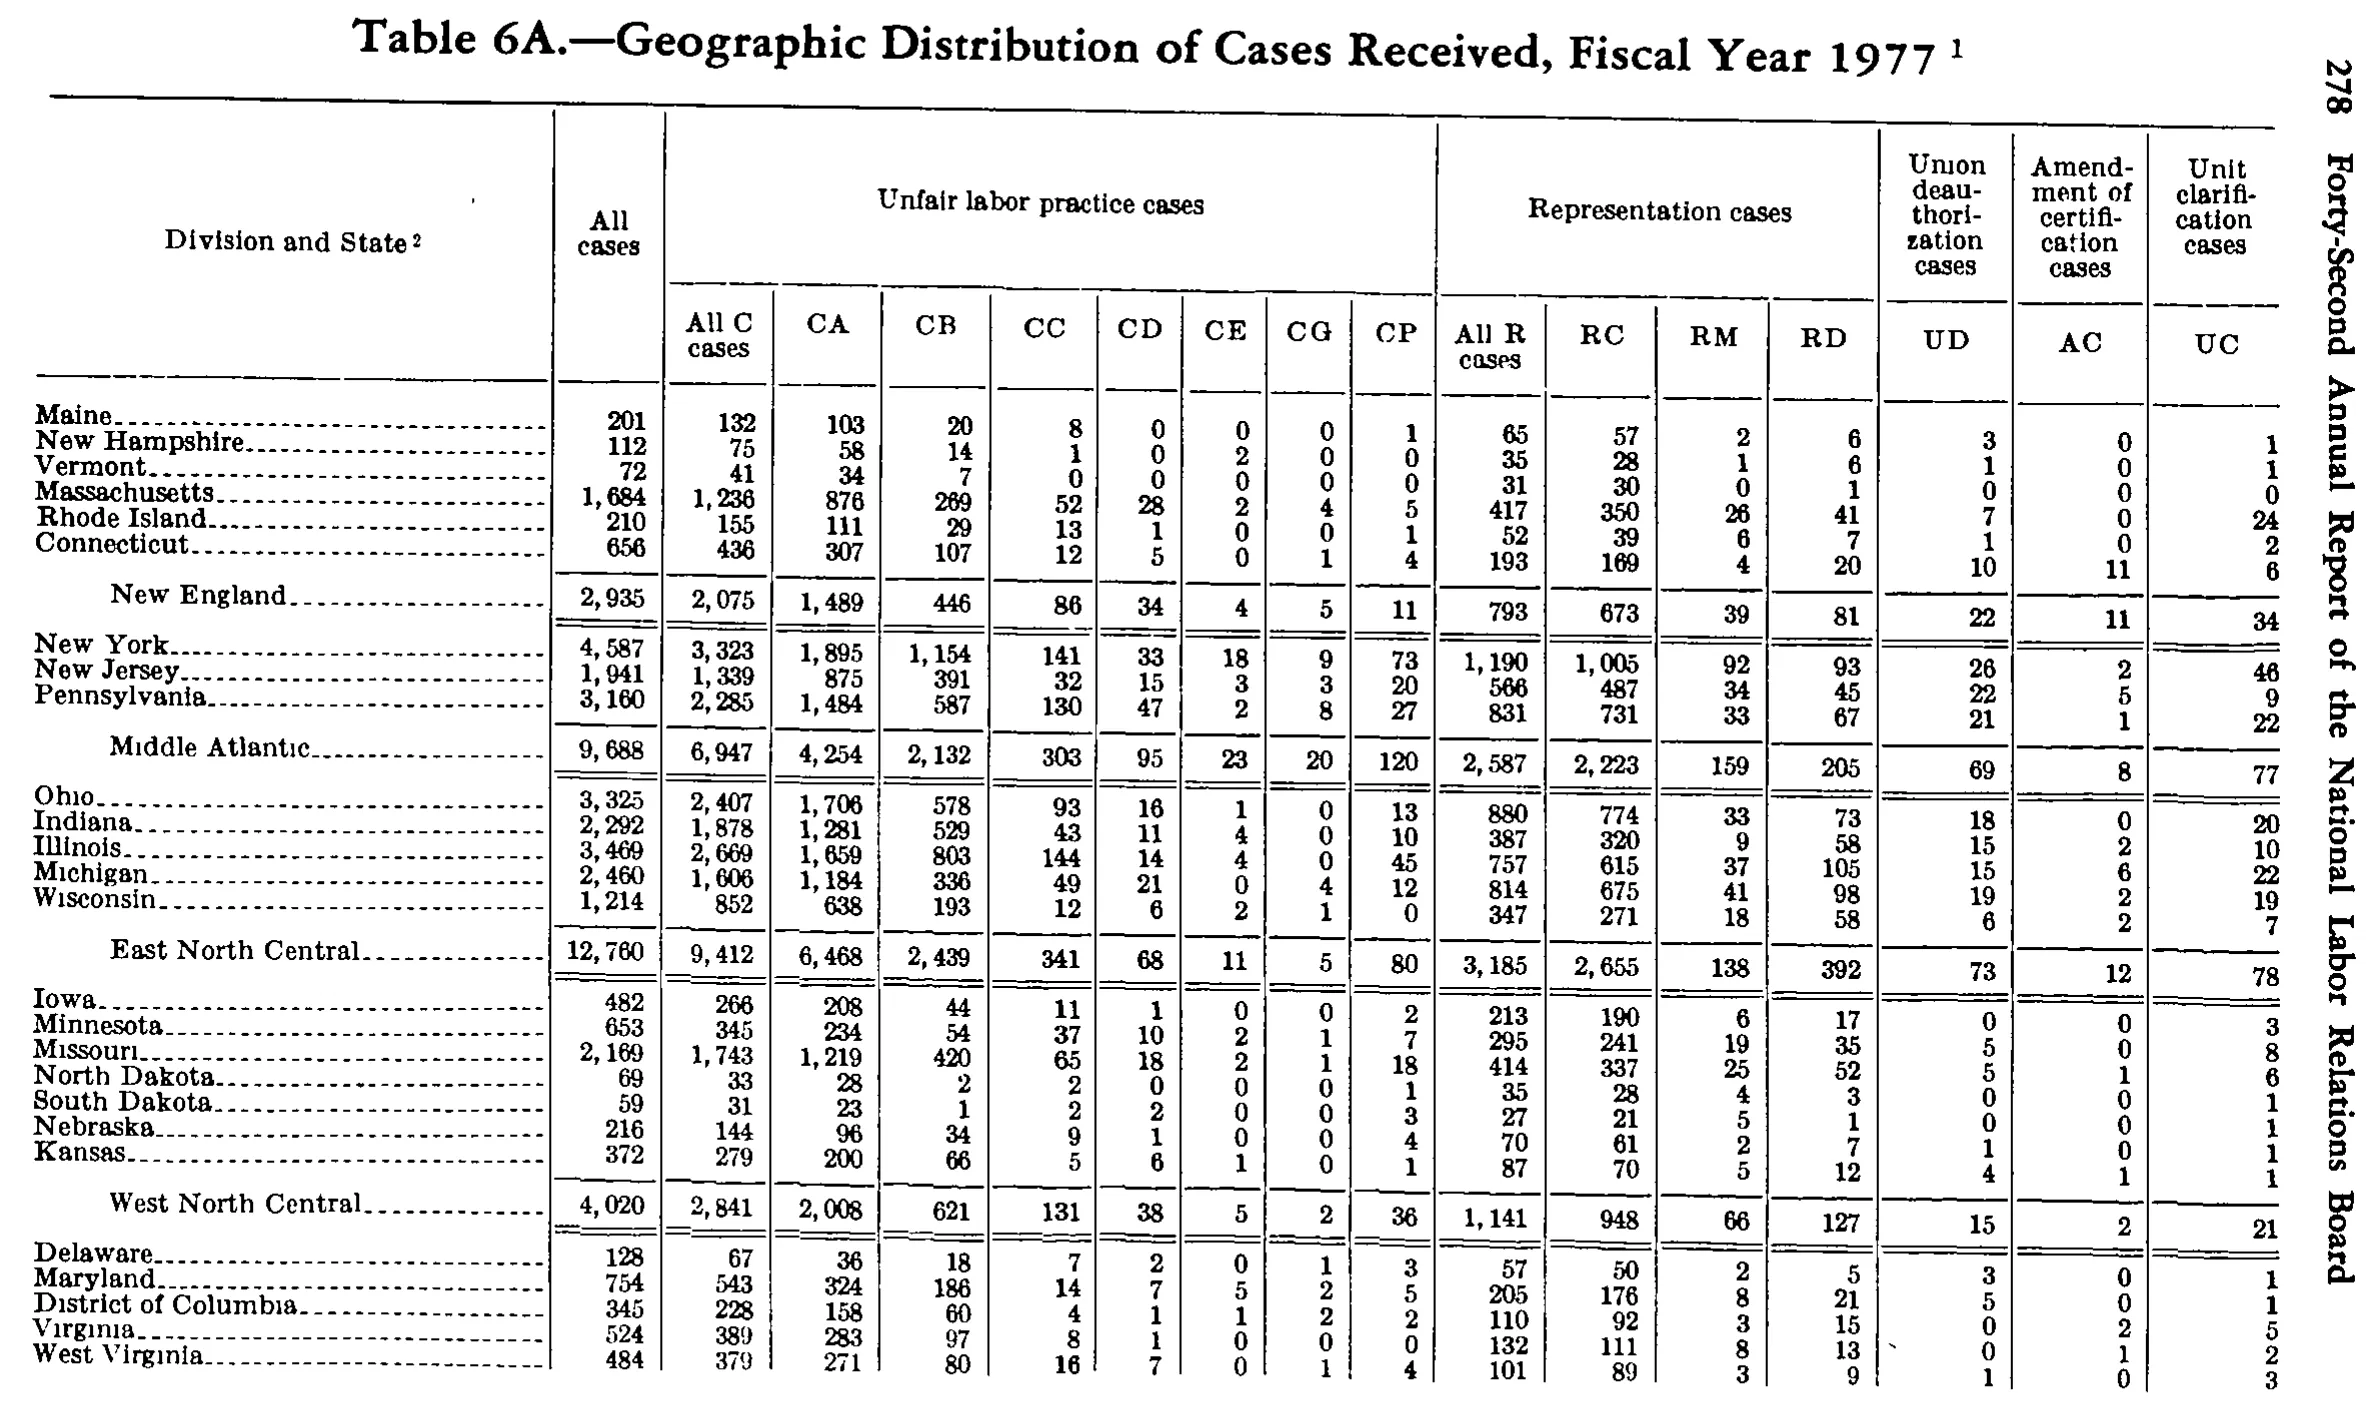
Geographic Distribution of Cases Received, Fiscal Year 1977
Stitched from pp. 293–294.
| Division and State | All cases | Unfair labor practice cases | Representation cases | Union deauthorization cases | Amendment of certification cases | Unit clarification cases | ||||||||||
|---|---|---|---|---|---|---|---|---|---|---|---|---|---|---|---|---|
| Division and State | All cases | All C cases | CA | CB | CC | CD | CE | CG | CP | All R cases | RC | RM | RD | UD | AC | UC |
| Maine | 201 | 132 | 103 | 20 | 8 | 0 | 0 | 0 | 1 | 65 | 57 | 2 | 6 | 3 | 0 | 1 |
| New Hampshire | 112 | 75 | 58 | 14 | 1 | 0 | 2 | 0 | 0 | 35 | 28 | 1 | 6 | 1 | 0 | 1 |
| Vermont | 72 | 41 | 34 | 7 | 0 | 0 | 0 | 0 | 0 | 31 | 30 | 1 | 0 | 0 | 0 | 0 |
| Massachusetts | 1,684 | 1,236 | 876 | 269 | 52 | 28 | 2 | 4 | 5 | 417 | 350 | 26 | 41 | 7 | 0 | 24 |
| Rhode Island | 210 | 155 | 111 | 29 | 13 | 1 | 0 | 0 | 1 | 52 | 39 | 6 | 7 | 1 | 0 | 2 |
| Connecticut | 656 | 436 | 307 | 107 | 12 | 5 | 0 | 1 | 4 | 193 | 169 | 4 | 20 | 10 | 11 | 6 |
| New England | 2,935 | 2,075 | 1,489 | 446 | 86 | 34 | 4 | 5 | 11 | 793 | 673 | 39 | 81 | 22 | 11 | 34 |
| New York | 4,587 | 3,323 | 1,895 | 1,154 | 141 | 33 | 18 | 9 | 73 | 1,190 | 1,005 | 92 | 93 | 26 | 2 | 46 |
| New Jersey | 1,941 | 1,339 | 875 | 391 | 32 | 15 | 3 | 3 | 20 | 566 | 487 | 34 | 45 | 22 | 5 | 9 |
| Pennsylvania | 3,160 | 2,285 | 1,484 | 587 | 130 | 47 | 2 | 8 | 27 | 831 | 731 | 33 | 67 | 21 | 1 | 22 |
| Middle Atlantic | 9,688 | 6,947 | 4,254 | 2,132 | 303 | 95 | 23 | 20 | 120 | 2,587 | 2,223 | 159 | 205 | 69 | 8 | 77 |
| Ohio | 3,325 | 2,407 | 1,706 | 578 | 93 | 16 | 1 | 0 | 13 | 880 | 774 | 33 | 73 | 18 | 0 | 20 |
| Indiana | 2,292 | 1,878 | 1,281 | 529 | 43 | 11 | 4 | 0 | 10 | 387 | 320 | 9 | 58 | 15 | 2 | 10 |
| Illinois | 3,469 | 2,669 | 1,659 | 803 | 144 | 14 | 4 | 0 | 45 | 757 | 615 | 37 | 105 | 15 | 6 | 22 |
| Michigan | 2,460 | 1,606 | 1,184 | 336 | 49 | 21 | 0 | 4 | 12 | 814 | 675 | 41 | 98 | 19 | 2 | 19 |
| Wisconsin | 1,214 | 852 | 638 | 193 | 12 | 6 | 2 | 1 | 0 | 347 | 271 | 18 | 58 | 6 | 2 | 7 |
| East North Central | 12,760 | 9,412 | 6,468 | 2,439 | 341 | 68 | 11 | 5 | 80 | 3,185 | 2,655 | 138 | 392 | 73 | 12 | 78 |
| Iowa | 482 | 266 | 208 | 44 | 11 | 1 | 0 | 0 | 2 | 213 | 190 | 6 | 17 | 0 | 0 | 3 |
| Minnesota | 653 | 345 | 234 | 54 | 37 | 10 | 2 | 1 | 7 | 295 | 241 | 19 | 35 | 5 | 0 | 8 |
| Missouri | 2,169 | 1,743 | 1,219 | 420 | 65 | 18 | 2 | 1 | 18 | 414 | 337 | 25 | 52 | 5 | 1 | 6 |
| North Dakota | 69 | 33 | 28 | 2 | 2 | 0 | 0 | 0 | 1 | 35 | 28 | 4 | 3 | 0 | 0 | 1 |
| South Dakota | 59 | 31 | 23 | 1 | 2 | 2 | 0 | 0 | 3 | 27 | 21 | 5 | 1 | 0 | 0 | 1 |
| Nebraska | 216 | 144 | 96 | 34 | 9 | 1 | 0 | 0 | 4 | 70 | 61 | 2 | 7 | 1 | 0 | 1 |
| Kansas | 372 | 279 | 200 | 66 | 5 | 6 | 1 | 0 | 1 | 87 | 70 | 5 | 12 | 4 | 1 | 1 |
| West North Central | 4,020 | 2,841 | 2,008 | 621 | 131 | 38 | 5 | 2 | 36 | 1,141 | 948 | 66 | 127 | 15 | 2 | 21 |
| Delaware | 128 | 67 | 36 | 18 | 7 | 2 | 0 | 1 | 3 | 57 | 50 | 2 | 5 | 3 | 0 | 1 |
| Maryland | 754 | 543 | 324 | 186 | 14 | 7 | 5 | 2 | 5 | 205 | 176 | 8 | 21 | 5 | 0 | 1 |
| District of Columbia | 345 | 228 | 158 | 60 | 4 | 1 | 1 | 2 | 2 | 110 | 92 | 3 | 15 | 0 | 2 | 5 |
| Virginia | 524 | 389 | 283 | 97 | 8 | 1 | 1 | 0 | 0 | 132 | 111 | 8 | 13 | 0 | 1 | 2 |
| West Virginia | 484 | 379 | 271 | 80 | 16 | 7 | 0 | 1 | 4 | 101 | 89 | 3 | 9 | 1 | 0 | 3 |
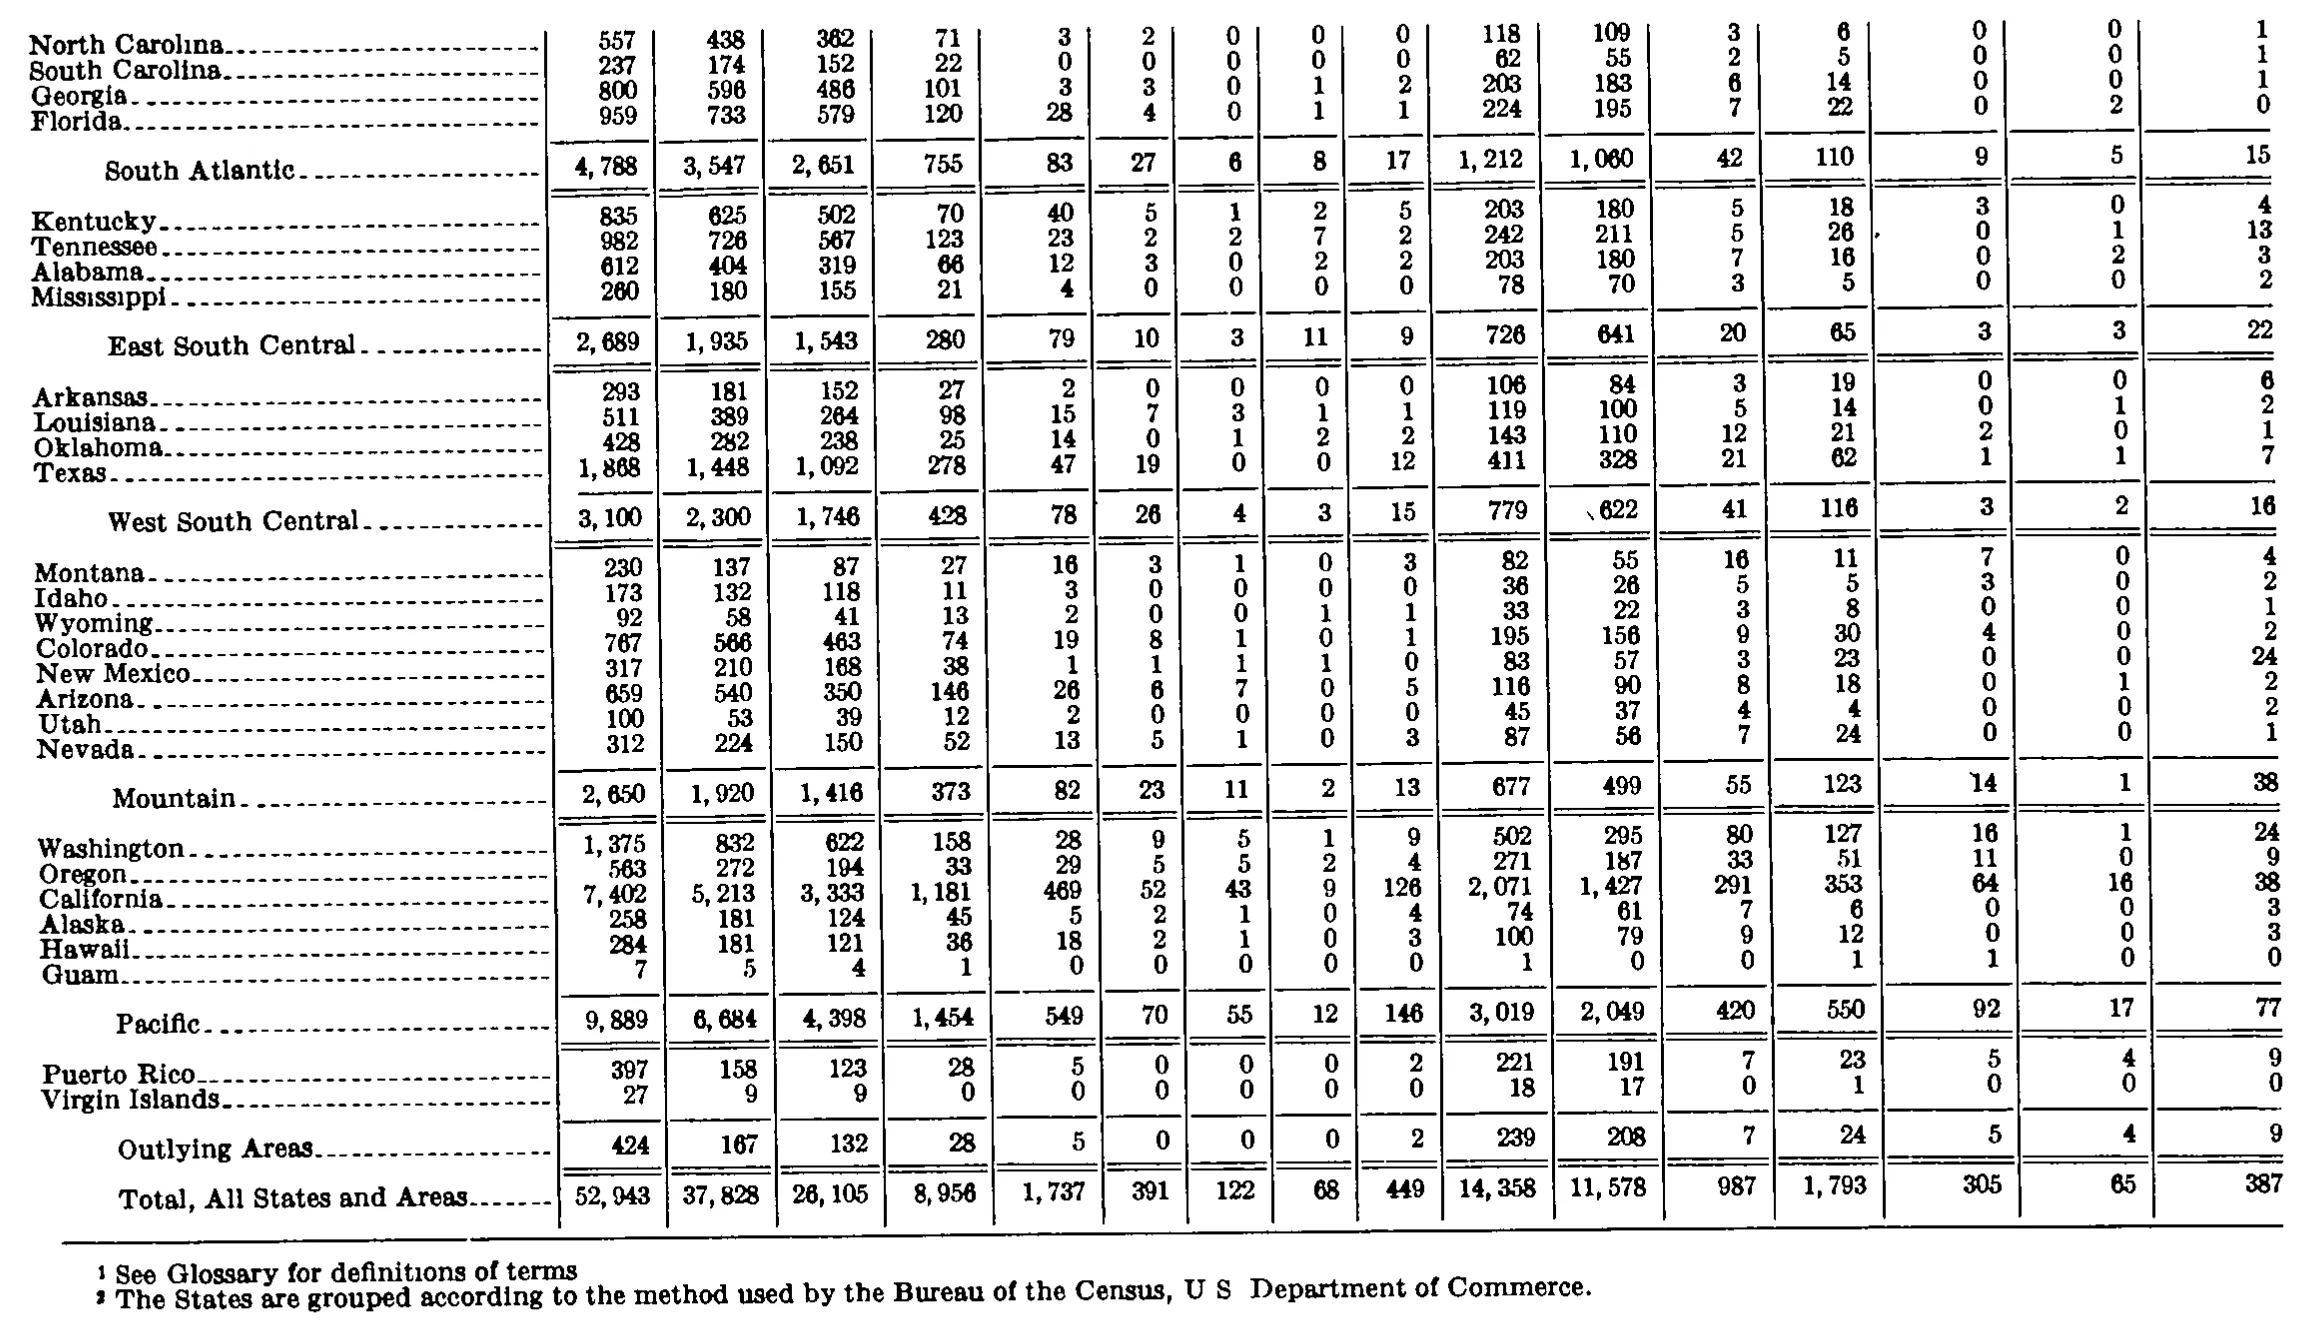
| North Carolina | 557 | 438 | 362 | 71 | 3 | 2 | 0 | 0 | 0 | 118 | 109 | 3 | 6 | 0 | 0 | 1 |
| South Carolina | 237 | 174 | 152 | 22 | 0 | 0 | 0 | 0 | 0 | 62 | 55 | 2 | 5 | 0 | 0 | 1 |
| Georgia | 800 | 596 | 486 | 101 | 3 | 3 | 0 | 1 | 2 | 203 | 183 | 6 | 14 | 0 | 0 | 1 |
| Florida | 959 | 733 | 579 | 120 | 28 | 4 | 0 | 1 | 1 | 224 | 195 | 7 | 22 | 0 | 2 | 0 |
| South Atlantic | 4,788 | 3,547 | 2,651 | 755 | 83 | 27 | 6 | 8 | 17 | 1,212 | 1,060 | 42 | 110 | 9 | 5 | 15 |
| Kentucky | 835 | 625 | 502 | 70 | 40 | 5 | 1 | 2 | 5 | 203 | 180 | 5 | 18 | 3 | 0 | 4 |
| Tennessee | 982 | 726 | 567 | 123 | 23 | 2 | 2 | 7 | 2 | 242 | 211 | 5 | 26 | 0 | 1 | 13 |
| Alabama | 612 | 404 | 319 | 66 | 12 | 3 | 0 | 2 | 2 | 203 | 180 | 7 | 16 | 0 | 2 | 3 |
| Mississippi | 260 | 180 | 155 | 21 | 4 | 0 | 0 | 0 | 0 | 78 | 70 | 3 | 5 | 0 | 0 | 2 |
| East South Central | 2,689 | 1,935 | 1,543 | 280 | 79 | 10 | 3 | 11 | 9 | 726 | 641 | 20 | 65 | 3 | 3 | 22 |
| Arkansas | 293 | 181 | 152 | 27 | 2 | 0 | 0 | 0 | 0 | 106 | 84 | 3 | 19 | 0 | 0 | 6 |
| Louisiana | 511 | 389 | 264 | 98 | 15 | 7 | 3 | 1 | 1 | 119 | 100 | 5 | 14 | 0 | 1 | 2 |
| Oklahoma | 428 | 282 | 238 | 25 | 14 | 0 | 1 | 2 | 2 | 143 | 110 | 12 | 21 | 2 | 0 | 1 |
| Texas | 1,868 | 1,448 | 1,092 | 278 | 47 | 19 | 0 | 0 | 12 | 411 | 328 | 21 | 62 | 1 | 1 | 7 |
| West South Central | 3,100 | 2,300 | 1,746 | 428 | 78 | 26 | 4 | 3 | 15 | 779 | 622 | 41 | 116 | 3 | 2 | 16 |
| Montana | 230 | 137 | 87 | 27 | 16 | 3 | 1 | 0 | 3 | 82 | 55 | 16 | 11 | 7 | 0 | 4 |
| Idaho | 173 | 132 | 118 | 11 | 3 | 0 | 0 | 0 | 0 | 36 | 26 | 5 | 5 | 3 | 0 | 2 |
| Wyoming | 92 | 58 | 41 | 13 | 2 | 0 | 0 | 1 | 1 | 33 | 22 | 3 | 8 | 0 | 0 | 1 |
| Colorado | 767 | 566 | 463 | 74 | 19 | 8 | 1 | 0 | 1 | 195 | 156 | 9 | 30 | 4 | 0 | 2 |
| New Mexico | 317 | 210 | 168 | 38 | 1 | 1 | 1 | 1 | 0 | 83 | 57 | 3 | 23 | 0 | 0 | 24 |
| Arizona | 659 | 540 | 350 | 146 | 26 | 6 | 7 | 0 | 5 | 116 | 90 | 8 | 18 | 0 | 1 | 2 |
| Utah | 100 | 53 | 39 | 12 | 2 | 0 | 0 | 0 | 0 | 45 | 37 | 4 | 4 | 0 | 0 | 2 |
| Nevada | 312 | 224 | 150 | 52 | 13 | 5 | 1 | 0 | 3 | 87 | 56 | 7 | 24 | 0 | 0 | 1 |
| Mountain | 2,650 | 1,920 | 1,416 | 373 | 82 | 23 | 11 | 2 | 13 | 677 | 499 | 55 | 123 | 14 | 1 | 38 |
| Washington | 1,375 | 832 | 622 | 158 | 28 | 9 | 5 | 1 | 9 | 502 | 295 | 80 | 127 | 16 | 1 | 24 |
| Oregon | 563 | 272 | 194 | 33 | 29 | 5 | 5 | 2 | 4 | 271 | 187 | 33 | 51 | 11 | 0 | 9 |
| California | 7,402 | 5,213 | 3,333 | 1,181 | 469 | 52 | 43 | 9 | 126 | 2,071 | 1,427 | 291 | 353 | 64 | 16 | 38 |
| Alaska | 258 | 181 | 124 | 45 | 5 | 2 | 1 | 0 | 4 | 74 | 61 | 7 | 6 | 0 | 0 | 3 |
| Hawaii | 284 | 181 | 121 | 36 | 18 | 2 | 1 | 0 | 3 | 100 | 79 | 9 | 12 | 0 | 0 | 3 |
| Guam | 7 | 5 | 4 | 1 | 0 | 0 | 0 | 0 | 0 | 1 | 0 | 0 | 1 | 1 | 0 | 0 |
| Pacific | 9,889 | 6,684 | 4,398 | 1,454 | 549 | 70 | 55 | 12 | 146 | 3,019 | 2,049 | 420 | 550 | 92 | 17 | 77 |
| Puerto Rico | 397 | 158 | 123 | 28 | 5 | 0 | 0 | 0 | 2 | 221 | 191 | 7 | 23 | 5 | 4 | 9 |
| Virgin Islands | 27 | 9 | 9 | 0 | 0 | 0 | 0 | 0 | 0 | 18 | 17 | 0 | 1 | 0 | 0 | 0 |
| Outlying Areas | 424 | 167 | 132 | 28 | 5 | 0 | 0 | 0 | 2 | 239 | 208 | 7 | 24 | 5 | 4 | 9 |
| Total, All States and Areas | 52,943 | 37,828 | 26,105 | 8,956 | 1,737 | 391 | 122 | 68 | 449 | 14,358 | 11,578 | 987 | 1,793 | 305 | 65 | 387 |
- 1 See Glossary for definitions of terms.
- 2 The States are grouped according to the method used by the Bureau of the Census, U.S. Department of Commerce.
886 of 887 figures sit in a row or column sum that works out. 4 cells break a sum: 'Virginia', column 3: prints 389, columns 4 to 10 add to 390; 'New England', column 13: prints 39, rows 'Maine' to 'Connecticut' add to 40; 'New England', column 14: prints 81, rows 'Maine' to 'Connecticut' add to 80; 'South Atlantic', column 8: prints 6, rows 'Delaware' to 'Florida' add to 7.
Reader’s notes
p. 293. The crop is cut off at the bottom: the table continues past West Virginia (no South Atlantic subtotal line, no further divisions, and no footnote block are visible on this image), so `footnotes` is empty even though markers 1 (in the caption) and 2 (on the stub heading "Division and State") are present. 17 columns: stub, All cases, 8 unfair-labor-practice columns, 4 representation columns, UD, AC, UC. "All cases", "Union deauthorization cases", "Amendment of certification cases" and "Unit clarification cases" are tall single headings spanning both heading levels and are repeated in both. Verification: every state row was checked against its own All C / All R subtotals and its All cases total, and every column was checked against the four printed division subtotals (New England, Middle Atlantic, East North Central, West North Central). All of these balance exactly, with the two exceptions noted below. (1) Virginia, unfair-labor-practice columns: as printed, CA 283 + CB 97 + CC 8 + CD 1 + CE 1 + CG 0 + CP 0 = 390, one more than the printed All C cases figure of 389. Virginia's All cases (524 = 389 + 132 + 0 + 1 + 2) is internally consistent, so the discrepancy sits inside the C breakdown. Because the South Atlantic division subtotal is cut off by the crop, there is no column check to say which of CC, CD or CE is at fault, so the cells are transcribed exactly as read; treat Virginia CD and CE as doubtful. (2) Vermont, UD column: transcribed as 0. The glyph is small and sits in a region of this scan where the right-hand columns drift vertically relative to their row, and on inspection it could plausibly be read as 1. Two independent printed checks require 0: Vermont's row (All cases 72 = All C 41 + All R 31, leaving 0 for UD + AC + UC) and the New England UD subtotal of 22 (3 + 1 + 0 + 7 + 1 + 10). I read it as 0 on that basis; flagging it so it can be re-checked against the original page. Minor residual ambiguity: in the New England block the split of the CG and CP columns between Rhode Island and Connecticut is forced only jointly by the subtotals (CG sums to 5, CP to 11). Two assignments satisfy every printed total — the one transcribed here (Rhode Island CG 0 / CP 1, Connecticut CG 1 / CP 4, which matches what I read on the Connecticut line) and the mirror (Rhode Island CG 1 / CP 0, Connecticut CG 0 / CP 5). All other cells in that block are uniquely pinned by the totals. Row labels carry dotted leaders, which have been dropped. Division lines (New England, Middle Atlantic, East North Central, West North Central) are indented subtotal rows and are kept in place with their values.
p. 294. Continuation page: no column headings are printed on this crop, so header_rows is empty. The grid has 17 columns (stub + 16 numeric), counted from the column rules and confirmed by the total row (52,943 / 37,828 / 26,105 / 8,956 / 1,737 / 391 / 122 / 68 / 449 / 14,358 / 11,578 / 987 / 1,793 / 305 / 65 / 387). The table begins on the previous page: the New England, Middle Atlantic, East North Central and West North Central groups, and the first five South Atlantic States (the rows preceding North Carolina), are not on this crop, which is why the "South Atlantic" subtotal exceeds the sum of the four South Atlantic States shown here. Doubtful cell: Georgia, 15th numeric column (the second-to-last). At this scan resolution the cell is hard to separate from the "2" standing in Georgia's 9th numeric column and from Florida's "2" in the same column below it; I transcribed it as 0, which is what makes Georgia's row agree with its own printed components and totals (596 + 203 + 0 + 0 + 1 = 800). If the printed digit is in fact 2, the row's stub total 800 would be short by 2. Every other row and every regional subtotal on this page reconciles exactly with its component columns as transcribed. Printing artifacts, not transcribed as content: a small speck sits just right of "26" in the Tennessee row (13th numeric column) and could be mistaken for a footnote marker or comma; a short stray stroke sits just left of "622" in the West South Central row (11th numeric column). Neither is a footnote marker. The scan also drops or faints small periods: footnote 1 shows no terminal period and footnote 2 shows "U S Department of Commerce"; I have written both with normal punctuation. Several state names render with dotless i's ("North Carolına", "Mississıppi") from the same scan degradation and are written normally.
Source image
Source data: U.S. NLRB Annual Reports (public domain). Reconstruction by NLRB Stats Archive. Read by claude-opus-5 (effort max, prompt extract_v1) from the 300-dpi scan; stitched by page. Updated October 2026.