NLRB Stats Archive › Annual Reports › FY1977 › Proceedings Decided by Circuit Courts of Appeals on Petitions for Enforcement and/or Review of Board Orders, Transition Quarter 1976, Compared With 5-Year Cumulative Totals, Fiscal Years 1972 Through 1976
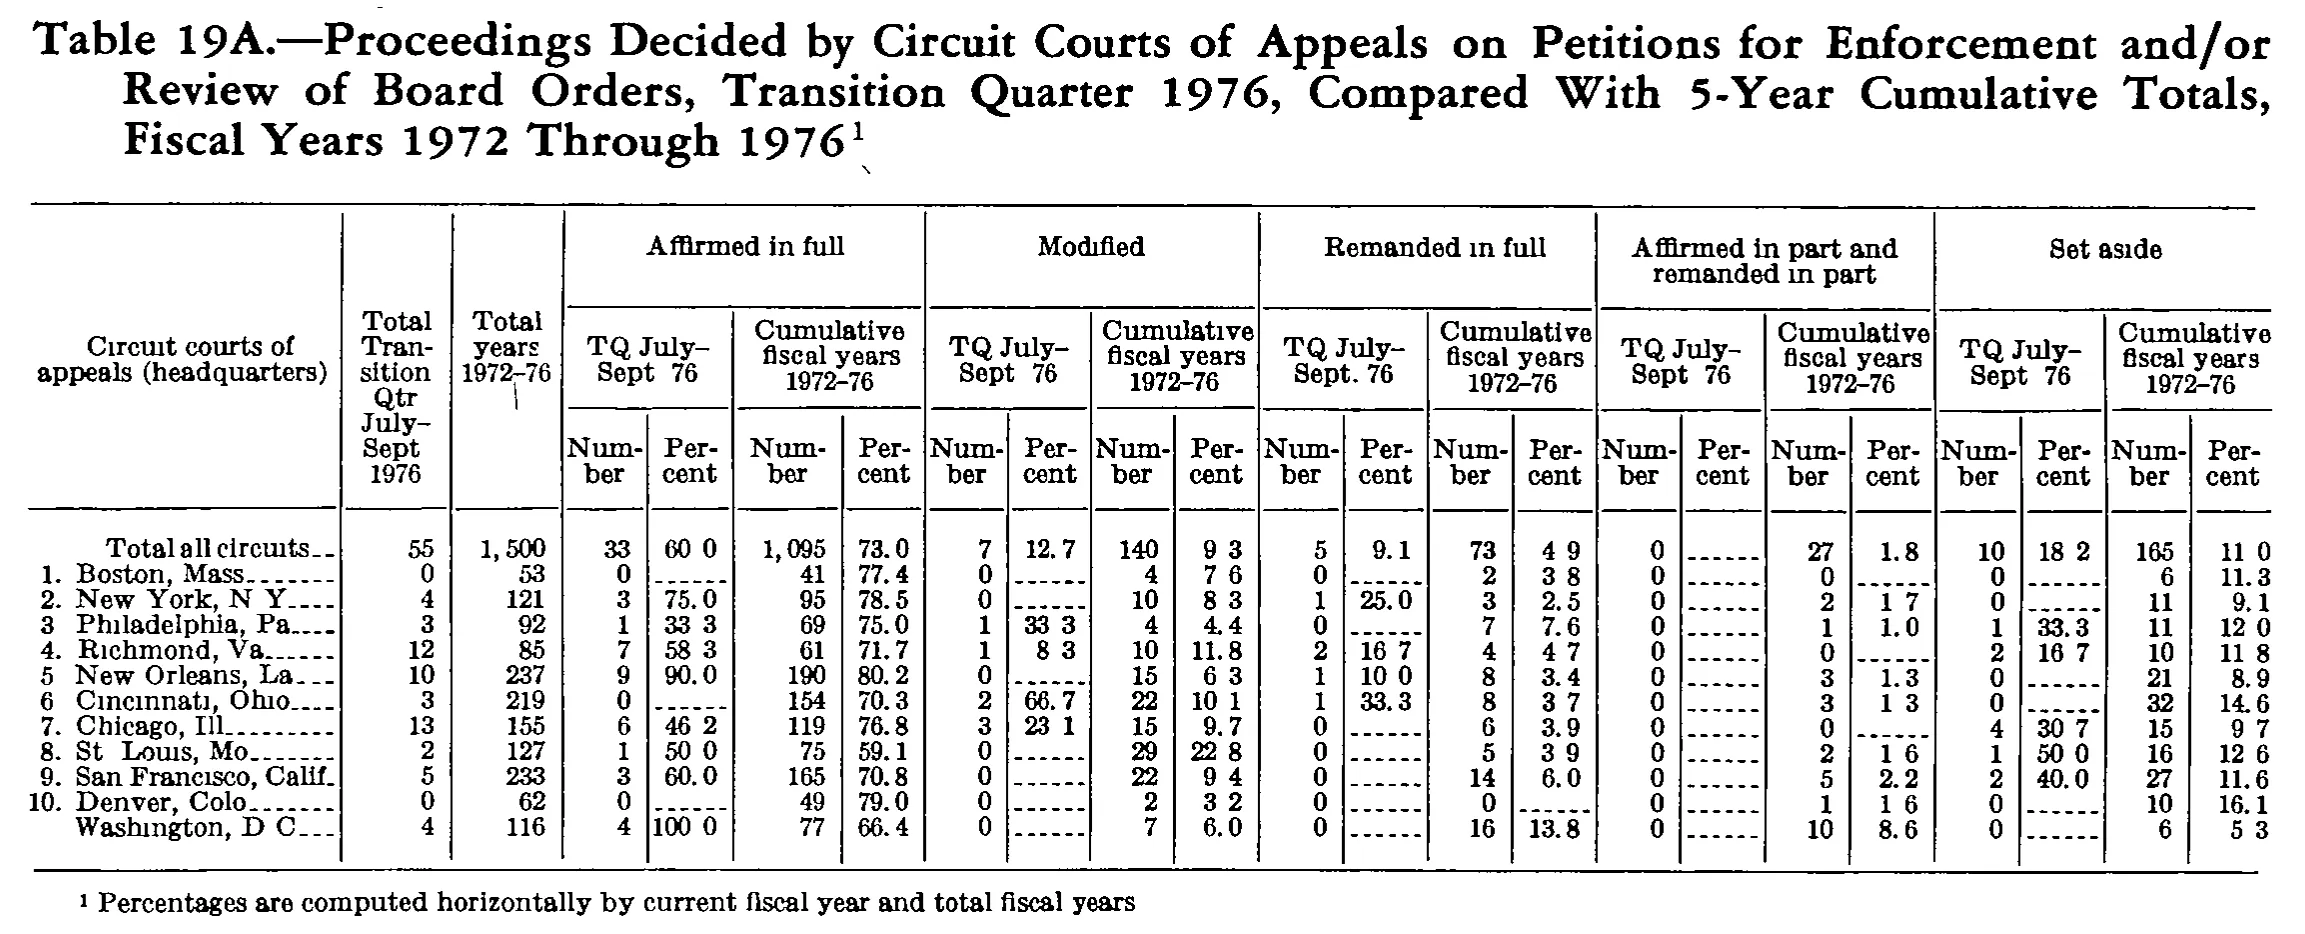
Proceedings Decided by Circuit Courts of Appeals on Petitions for Enforcement and/or Review of Board Orders, Transition Quarter 1976, Compared With 5-Year Cumulative Totals, Fiscal Years 1972 Through 1976
| Circuit courts of appeals (headquarters) | Total Transition Qtr July-Sept 1976 | Total years 1972-76 | Affirmed in full | Modified | Remanded in full | Affirmed in part and remanded in part | Set aside | |||||||||||||||
|---|---|---|---|---|---|---|---|---|---|---|---|---|---|---|---|---|---|---|---|---|---|---|
| Circuit courts of appeals (headquarters) | Total Transition Qtr July-Sept 1976 | Total years 1972-76 | TQ July-Sept 76 | Cumulative fiscal years 1972-76 | TQ July-Sept 76 | Cumulative fiscal years 1972-76 | TQ July-Sept. 76 | Cumulative fiscal years 1972-76 | TQ July-Sept 76 | Cumulative fiscal years 1972-76 | TQ July-Sept 76 | Cumulative fiscal years 1972-76 | ||||||||||
| Circuit courts of appeals (headquarters) | Total Transition Qtr July-Sept 1976 | Total years 1972-76 | Number | Percent | Number | Percent | Number | Percent | Number | Percent | Number | Percent | Number | Percent | Number | Percent | Number | Percent | Number | Percent | Number | Percent |
| Total all circuits | 55 | 1,500 | 33 | 60.0 | 1,095 | 73.0 | 7 | 12.7 | 140 | 9.3 | 5 | 9.1 | 73 | 4.9 | 0 | 27 | 1.8 | 10 | 18.2 | 165 | 11.0 | |
| 1. Boston, Mass. | 0 | 53 | 0 | 41 | 77.4 | 0 | 4 | 7.6 | 0 | 2 | 3.8 | 0 | 0 | 0 | 6 | 11.3 | ||||||
| 2. New York, N.Y. | 4 | 121 | 3 | 75.0 | 95 | 78.5 | 0 | 10 | 8.3 | 1 | 25.0 | 3 | 2.5 | 0 | 2 | 1.7 | 0 | 11 | 9.1 | |||
| 3. Philadelphia, Pa. | 3 | 92 | 1 | 33.3 | 69 | 75.0 | 1 | 33.3 | 4 | 4.4 | 0 | 7 | 7.6 | 0 | 1 | 1.0 | 1 | 33.3 | 11 | 12.0 | ||
| 4. Richmond, Va. | 12 | 85 | 7 | 58.3 | 61 | 71.7 | 1 | 8.3 | 10 | 11.8 | 2 | 16.7 | 4 | 4.7 | 0 | 0 | 2 | 16.7 | 10 | 11.8 | ||
| 5. New Orleans, La. | 10 | 237 | 9 | 90.0 | 190 | 80.2 | 0 | 15 | 6.3 | 1 | 10.0 | 8 | 3.4 | 0 | 3 | 1.3 | 0 | 21 | 8.9 | |||
| 6. Cincinnati, Ohio | 3 | 219 | 0 | 154 | 70.3 | 2 | 66.7 | 22 | 10.1 | 1 | 33.3 | 8 | 3.7 | 0 | 3 | 1.3 | 0 | 32 | 14.6 | |||
| 7. Chicago, Ill. | 13 | 155 | 6 | 46.2 | 119 | 76.8 | 3 | 23.1 | 15 | 9.7 | 0 | 6 | 3.9 | 0 | 0 | 4 | 30.7 | 15 | 9.7 | |||
| 8. St. Louis, Mo. | 2 | 127 | 1 | 50.0 | 75 | 59.1 | 0 | 29 | 22.8 | 0 | 5 | 3.9 | 0 | 2 | 1.6 | 1 | 50.0 | 16 | 12.6 | |||
| 9. San Francisco, Calif. | 5 | 233 | 3 | 60.0 | 165 | 70.8 | 0 | 22 | 9.4 | 0 | 14 | 6.0 | 0 | 5 | 2.2 | 2 | 40.0 | 27 | 11.6 | |||
| 10. Denver, Colo. | 0 | 62 | 0 | 49 | 79.0 | 0 | 2 | 3.2 | 0 | 0 | 0 | 1 | 1.6 | 0 | 10 | 16.1 | ||||||
| Washington, D.C. | 4 | 116 | 4 | 100.0 | 77 | 66.4 | 0 | 7 | 6.0 | 0 | 16 | 13.8 | 0 | 10 | 8.6 | 0 | 6 | 5.3 | ||||
- 1 Percentages are computed horizontally by current fiscal year and total fiscal years
0 of 103 figures sit in a row or column sum that works out.
Reader’s notes
p. 277. 23 columns: stub, two "Total" columns, then five outcome blocks (Affirmed in full; Modified; Remanded in full; Affirmed in part and remanded in part; Set aside), each split into a TQ July-Sept 76 Number/Percent pair and a Cumulative fiscal years 1972-76 Number/Percent pair. Decimal points: the scan drops many of the periods in the percent columns, so values print as e.g. "60 0", "9 3", "4 9", "18 2", "11 0", "7 6", "3 8", "8 3", "1 7", "33 3", "58 3", "10 0", "10 1", "1 3", "46 2", "23 1", "22 8", "1 6", "2 2", "30 7", "50 0", "100 0", "16 7", "5 3". Every percent in the table carries exactly one decimal, and each value checks out against its own Number/Total ratio, so I have written them with the decimal point restored (60.0, 9.3, etc.). No digits were changed. Empty percent cells are printed as a short dash rule ("------") and are transcribed as "" per instructions; this includes the Denver "Remanded in full / Cumulative fiscal years / Percent" cell, where the Number is 0 and the Percent field is blank. Row-label punctuation: the periods after the ordinal numbers for rows 3, 5 and 6, and the trailing periods on the state abbreviations (Mass., N.Y., Pa., Va., La., Ill., Mo., Colo., D.C., and the "St." in St. Louis), are lost in or merged with the leader dots in this scan. I have restored them to the conventional printed form; "Cincinnati, Ohio" and "San Francisco, Calif." are unambiguous as printed. Apparent misprints, transcribed as printed: (a) the "Total all circuits" Transition Quarter total is 55, but the eleven circuit rows sum to 56; (b) the "Total all circuits" Affirmed in full / TQ / Number is 33, but the circuit rows sum to 34. The two discrepancies are consistent with each other (the total row itself sums internally: 33+7+5+0+10 = 55, and 33/55 = 60.0). Every cumulative-column total reconciles exactly (1,095+140+73+27+165 = 1,500), so the inconsistency is confined to the Transition Quarter columns. Minor rounding oddities also appear in a few printed percents (Boston Modified cumulative 7.6 vs 7.5; Philadelphia "Affirmed in part" cumulative 1.0 vs 1.1; Richmond Affirmed in full cumulative 71.7 vs 71.8; Cincinnati "Affirmed in part" cumulative 1.3 vs 1.4; Washington Set aside cumulative 5.3 vs 5.2); all are left as printed. The "Remanded in full" block heads its TQ column "TQ July-Sept. 76" (with a period after Sept), while the other four blocks print "TQ July-Sept 76"; kept as printed. The caption's footnote marker 1 is attached to the caption, which is excluded.
Source image
Source data: U.S. NLRB Annual Reports (public domain). Reconstruction by NLRB Stats Archive. Read by claude-opus-5 (effort max, prompt extract_v1) from the 300-dpi scan; stitched by page. Updated October 2026.