NLRB Stats Archive › Annual Reports › FY1977 › Distribution of Unfair Labor Practice Situations Received, by Number of Employees in Establishments, Transition Quarter (July-September 1976)
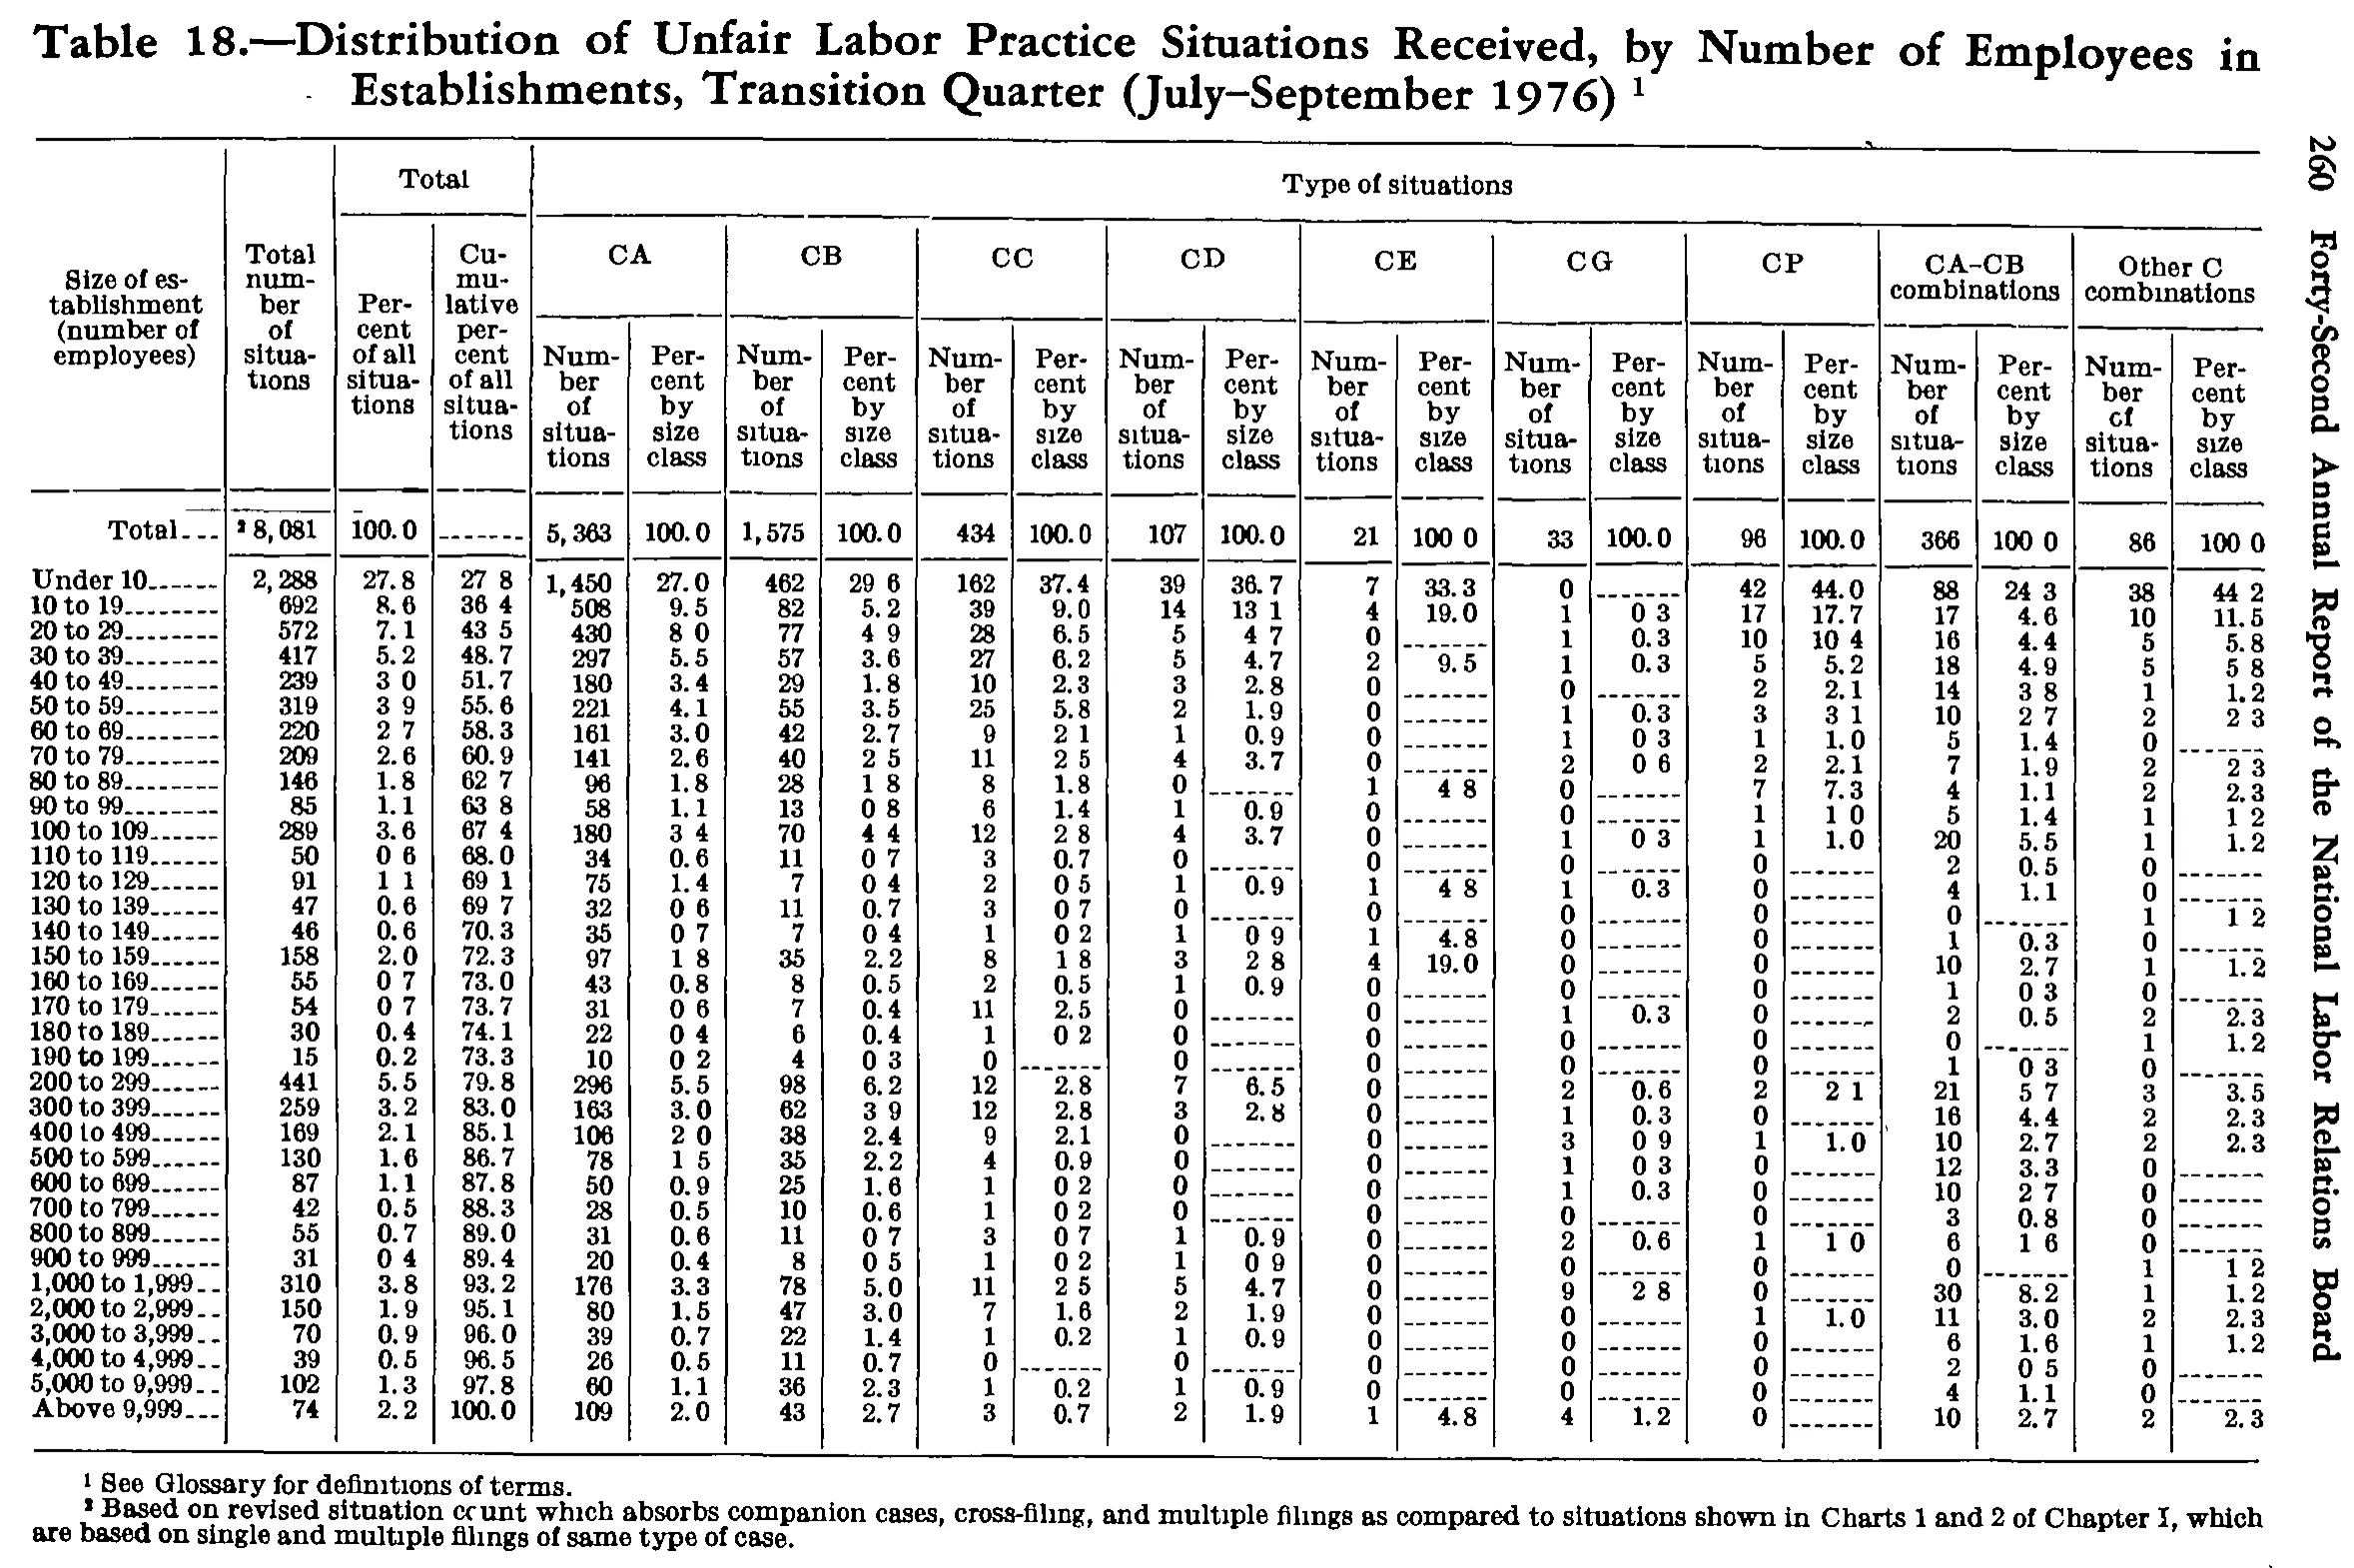
Distribution of Unfair Labor Practice Situations Received, by Number of Employees in Establishments, Transition Quarter (July-September 1976)
| Size of establishment (number of employees) | Total number of situations | Total | Type of situations | ||||||||||||||||||
|---|---|---|---|---|---|---|---|---|---|---|---|---|---|---|---|---|---|---|---|---|---|
| Size of establishment (number of employees) | Total number of situations | Percent of all situations | Cumulative percent of all situations | CA | CB | CC | CD | CE | CG | CP | CA-CB combinations | Other C combinations | |||||||||
| Size of establishment (number of employees) | Total number of situations | Percent of all situations | Cumulative percent of all situations | Number of situations | Percent by size class | Number of situations | Percent by size class | Number of situations | Percent by size class | Number of situations | Percent by size class | Number of situations | Percent by size class | Number of situations | Percent by size class | Number of situations | Percent by size class | Number of situations | Percent by size class | Number of situations | Percent by size class |
| Total | 8,081 | 100.0 | 5,363 | 100.0 | 1,575 | 100.0 | 434 | 100.0 | 107 | 100.0 | 21 | 100.0 | 33 | 100.0 | 96 | 100.0 | 366 | 100.0 | 86 | 100.0 | |
| Under 10 | 2,288 | 27.8 | 27.8 | 1,450 | 27.0 | 462 | 29.6 | 162 | 37.4 | 39 | 36.7 | 7 | 33.3 | 0 | 42 | 44.0 | 88 | 24.3 | 38 | 44.2 | |
| 10 to 19 | 692 | 8.6 | 36.4 | 508 | 9.5 | 82 | 5.2 | 39 | 9.0 | 14 | 13.1 | 4 | 19.0 | 1 | 0.3 | 17 | 17.7 | 17 | 4.6 | 10 | 11.5 |
| 20 to 29 | 572 | 7.1 | 43.5 | 430 | 8.0 | 77 | 4.9 | 28 | 6.5 | 5 | 4.7 | 0 | 1 | 0.3 | 10 | 10.4 | 16 | 4.4 | 5 | 5.8 | |
| 30 to 39 | 417 | 5.2 | 48.7 | 297 | 5.5 | 57 | 3.6 | 27 | 6.2 | 5 | 4.7 | 2 | 9.5 | 1 | 0.3 | 5 | 5.2 | 18 | 4.9 | 5 | 5.8 |
| 40 to 49 | 239 | 3.0 | 51.7 | 180 | 3.4 | 29 | 1.8 | 10 | 2.3 | 3 | 2.8 | 0 | 0 | 2 | 2.1 | 14 | 3.8 | 1 | 1.2 | ||
| 50 to 59 | 319 | 3.9 | 55.6 | 221 | 4.1 | 55 | 3.5 | 25 | 5.8 | 2 | 1.9 | 0 | 1 | 0.3 | 3 | 3.1 | 10 | 2.7 | 2 | 2.3 | |
| 60 to 69 | 220 | 2.7 | 58.3 | 161 | 3.0 | 42 | 2.7 | 9 | 2.1 | 1 | 0.9 | 0 | 1 | 0.3 | 1 | 1.0 | 5 | 1.4 | 0 | ||
| 70 to 79 | 209 | 2.6 | 60.9 | 141 | 2.6 | 40 | 2.5 | 11 | 2.5 | 4 | 3.7 | 0 | 2 | 0.6 | 2 | 2.1 | 7 | 1.9 | 2 | 2.3 | |
| 80 to 89 | 146 | 1.8 | 62.7 | 96 | 1.8 | 28 | 1.8 | 8 | 1.8 | 0 | 1 | 4.8 | 0 | 7 | 7.3 | 4 | 1.1 | 2 | 2.3 | ||
| 90 to 99 | 85 | 1.1 | 63.8 | 58 | 1.1 | 13 | 0.8 | 6 | 1.4 | 1 | 0.9 | 0 | 0 | 1 | 1.0 | 5 | 1.4 | 1 | 1.2 | ||
| 100 to 109 | 289 | 3.6 | 67.4 | 180 | 3.4 | 70 | 4.4 | 12 | 2.8 | 4 | 3.7 | 0 | 1 | 0.3 | 1 | 1.0 | 20 | 5.5 | 1 | 1.2 | |
| 110 to 119 | 50 | 0.6 | 68.0 | 34 | 0.6 | 11 | 0.7 | 3 | 0.7 | 0 | 0 | 0 | 0 | 2 | 0.5 | 0 | |||||
| 120 to 129 | 91 | 1.1 | 69.1 | 75 | 1.4 | 7 | 0.4 | 2 | 0.5 | 1 | 0.9 | 1 | 4.8 | 1 | 0.3 | 0 | 4 | 1.1 | 0 | ||
| 130 to 139 | 47 | 0.6 | 69.7 | 32 | 0.6 | 11 | 0.7 | 3 | 0.7 | 0 | 0 | 0 | 0 | 0 | 1 | 1.2 | |||||
| 140 to 149 | 46 | 0.6 | 70.3 | 35 | 0.7 | 7 | 0.4 | 1 | 0.2 | 1 | 0.9 | 1 | 4.8 | 0 | 0 | 1 | 0.3 | 0 | |||
| 150 to 159 | 158 | 2.0 | 72.3 | 97 | 1.8 | 35 | 2.2 | 8 | 1.8 | 3 | 2.8 | 4 | 19.0 | 0 | 0 | 10 | 2.7 | 1 | 1.2 | ||
| 160 to 169 | 55 | 0.7 | 73.0 | 43 | 0.8 | 8 | 0.5 | 2 | 0.5 | 1 | 0.9 | 0 | 0 | 0 | 1 | 0.3 | 0 | ||||
| 170 to 179 | 54 | 0.7 | 73.7 | 31 | 0.6 | 7 | 0.4 | 11 | 2.5 | 0 | 0 | 1 | 0.3 | 0 | 2 | 0.5 | 2 | 2.3 | |||
| 180 to 189 | 30 | 0.4 | 74.1 | 22 | 0.4 | 6 | 0.4 | 1 | 0.2 | 0 | 0 | 0 | 0 | 0 | 1 | 1.2 | |||||
| 190 to 199 | 15 | 0.2 | 73.3 | 10 | 0.2 | 4 | 0.3 | 0 | 0 | 0 | 0 | 0 | 1 | 0.3 | 0 | ||||||
| 200 to 299 | 441 | 5.5 | 79.8 | 296 | 5.5 | 98 | 6.2 | 12 | 2.8 | 7 | 6.5 | 0 | 2 | 0.6 | 2 | 2.1 | 21 | 5.7 | 3 | 3.5 | |
| 300 to 399 | 259 | 3.2 | 83.0 | 163 | 3.0 | 62 | 3.9 | 12 | 2.8 | 3 | 2.8 | 0 | 1 | 0.3 | 0 | 16 | 4.4 | 2 | 2.3 | ||
| 400 to 499 | 169 | 2.1 | 85.1 | 106 | 2.0 | 38 | 2.4 | 9 | 2.1 | 0 | 0 | 3 | 0.9 | 1 | 1.0 | 10 | 2.7 | 2 | 2.3 | ||
| 500 to 599 | 130 | 1.6 | 86.7 | 78 | 1.5 | 35 | 2.2 | 4 | 0.9 | 0 | 0 | 1 | 0.3 | 0 | 12 | 3.3 | 0 | ||||
| 600 to 699 | 87 | 1.1 | 87.8 | 50 | 0.9 | 25 | 1.6 | 1 | 0.2 | 0 | 0 | 1 | 0.3 | 0 | 10 | 2.7 | 0 | ||||
| 700 to 799 | 42 | 0.5 | 88.3 | 28 | 0.5 | 10 | 0.6 | 1 | 0.2 | 0 | 0 | 0 | 0 | 3 | 0.8 | 0 | |||||
| 800 to 899 | 55 | 0.7 | 89.0 | 31 | 0.6 | 11 | 0.7 | 3 | 0.7 | 1 | 0.9 | 0 | 2 | 0.6 | 1 | 1.0 | 6 | 1.6 | 0 | ||
| 900 to 999 | 31 | 0.4 | 89.4 | 20 | 0.4 | 8 | 0.5 | 1 | 0.2 | 1 | 0.9 | 0 | 0 | 0 | 0 | 1 | 1.2 | ||||
| 1,000 to 1,999 | 310 | 3.8 | 93.2 | 176 | 3.3 | 78 | 5.0 | 11 | 2.5 | 5 | 4.7 | 0 | 9 | 2.8 | 0 | 30 | 8.2 | 1 | 1.2 | ||
| 2,000 to 2,999 | 150 | 1.9 | 95.1 | 80 | 1.5 | 47 | 3.0 | 7 | 1.6 | 2 | 1.9 | 0 | 0 | 1 | 1.0 | 11 | 3.0 | 2 | 2.3 | ||
| 3,000 to 3,999 | 70 | 0.9 | 96.0 | 39 | 0.7 | 22 | 1.4 | 1 | 0.2 | 1 | 0.9 | 0 | 0 | 0 | 6 | 1.6 | 1 | 1.2 | |||
| 4,000 to 4,999 | 39 | 0.5 | 96.5 | 26 | 0.5 | 11 | 0.7 | 0 | 1 | 0.9 | 0 | 0 | 0 | 2 | 0.5 | 0 | |||||
| 5,000 to 9,999 | 102 | 1.3 | 97.8 | 60 | 1.1 | 36 | 2.3 | 1 | 0.2 | 1 | 0.9 | 0 | 0 | 0 | 4 | 1.1 | 0 | ||||
| Above 9,999 | 74 | 2.2 | 100.0 | 109 | 2.0 | 43 | 2.7 | 3 | 0.7 | 2 | 1.9 | 1 | 4.8 | 4 | 1.2 | 0 | 10 | 2.7 | 2 | 2.3 | |
- 1 See Glossary for definitions of terms.
- 2 Based on revised situation count which absorbs companion cases, cross-filing, and multiple filings as compared to situations shown in Charts 1 and 2 of Chapter I, which are based on single and multiple filings of same type of case.
257 of 261 figures sit in a row or column sum that works out. 4 cells break a sum: '4,000 to 4,999', column 2: prints 39, the subtotals in columns 5 to 21 add to 40; 'Above 9,999', column 2: prints 74, the subtotals in columns 5 to 21 add to 174; 'Total', column 2: prints 8,081, rows 'Under 10' to 'Above 9,999' add to 7,981; 'Total', column 11: prints 107, rows 'Under 10' to 'Above 9,999' add to 108.
Reader’s notes
p. 275. 22 columns: stub, Total (3 columns, the first of which is the tall "Total number of situations" heading standing outside the "Total" spanner), then 9 two-column type-of-situation panels. Cells printed as leader dots or a dash rule are given as "". Decimal points: this is a 1-bit scan in which many periods drop out, so values such as the Total row's "100 0" and the cumulative column's "27 8", "36 4" are printed as 100.0, 27.8, 36.4. I have written the decimal point everywhere the column is plainly a one-decimal percentage; no digits were changed. Placement checked by arithmetic, two cells worth flagging: the CG pair "9 / 2.8" and the CP pair "1 / 1.0" sit in the tightly spaced bottom block and visually hug the line below them. I have put the CG 9/2.8 on "1,000 to 1,999" and the CP 1/1.0 on "2,000 to 2,999", because that is the only assignment consistent with both the printed row totals (310 and 150, and 70 for "3,000 to 3,999") and the printed column totals (CG 33, CP 96). Printed values that do not reconcile, transcribed as printed: - "Above 9,999", Total number of situations: printed 74. Its own row components sum to 174, its "Percent of all situations" is 2.2 and the cumulative column steps 97.8 to 100.0, all of which imply 174; the leading 1 appears to be missing from the print. - "190 to 199", Cumulative percent of all situations: printed 73.3, which breaks the monotone sequence (74.1 above it, 79.8 below); 74.3 is implied. - "4,000 to 4,999": its components sum to 40 against a printed total of 39, and the CD column sums to 108 against its printed total of 107; the CD entry 1 / 0.9 on this row is the likely source of both. Every other column sums exactly to its printed total (CA 5,363; CB 1,575; CC 434; CE 21; CG 33; CP 96; CA-CB 366; Other C 86) and every other row sums to its printed total. - A few first-row ("Under 10") percentages run slightly high against their counts (27.8 vs 2,288/8,081; CB 29.6; CA-CB 24.3), and the CG percent column is scaled against roughly 321 rather than its printed total of 33 (1 prints as 0.3, 9 as 2.8). Left as printed. The row label "400 to 499" prints with a broken "t" that reads as "400 lo 499"; transcribed as "to".
Source image
Source data: U.S. NLRB Annual Reports (public domain). Reconstruction by NLRB Stats Archive. Read by claude-opus-5 (effort max, prompt extract_v1) from the 300-dpi scan; stitched by page. Updated October 2026.