NLRB Stats Archive › Annual Reports › FY1977 › Standard Federal Administrative Regional Distribution of Representation Elections Held in Cases Closed, Transition Quarter (July–September 1976)
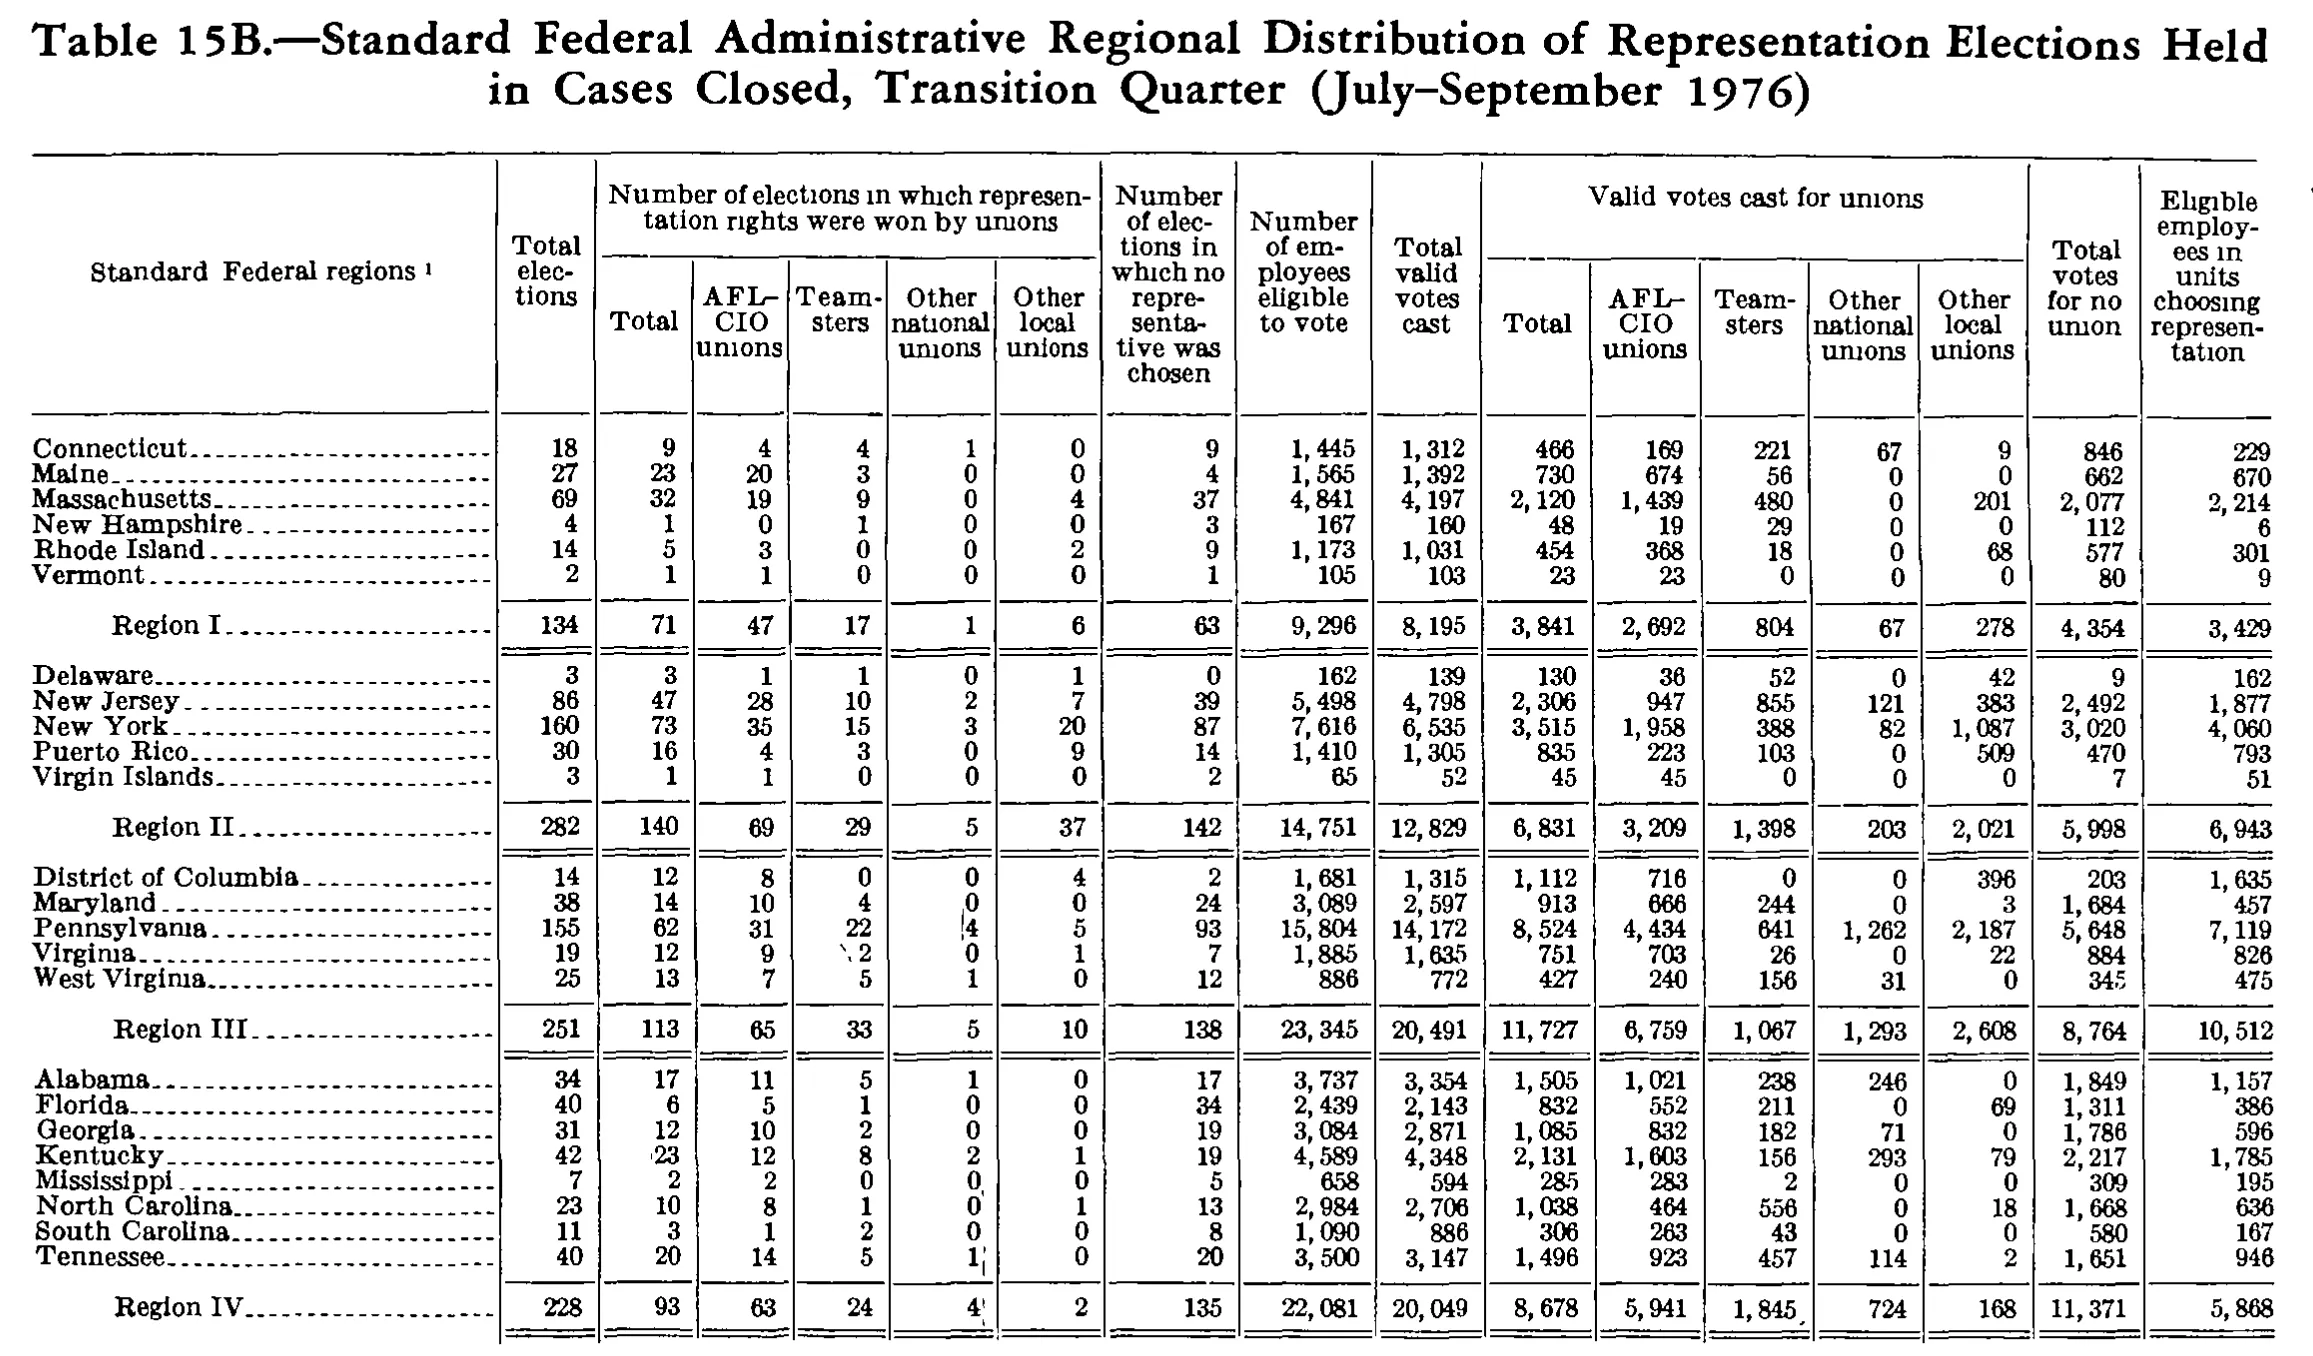
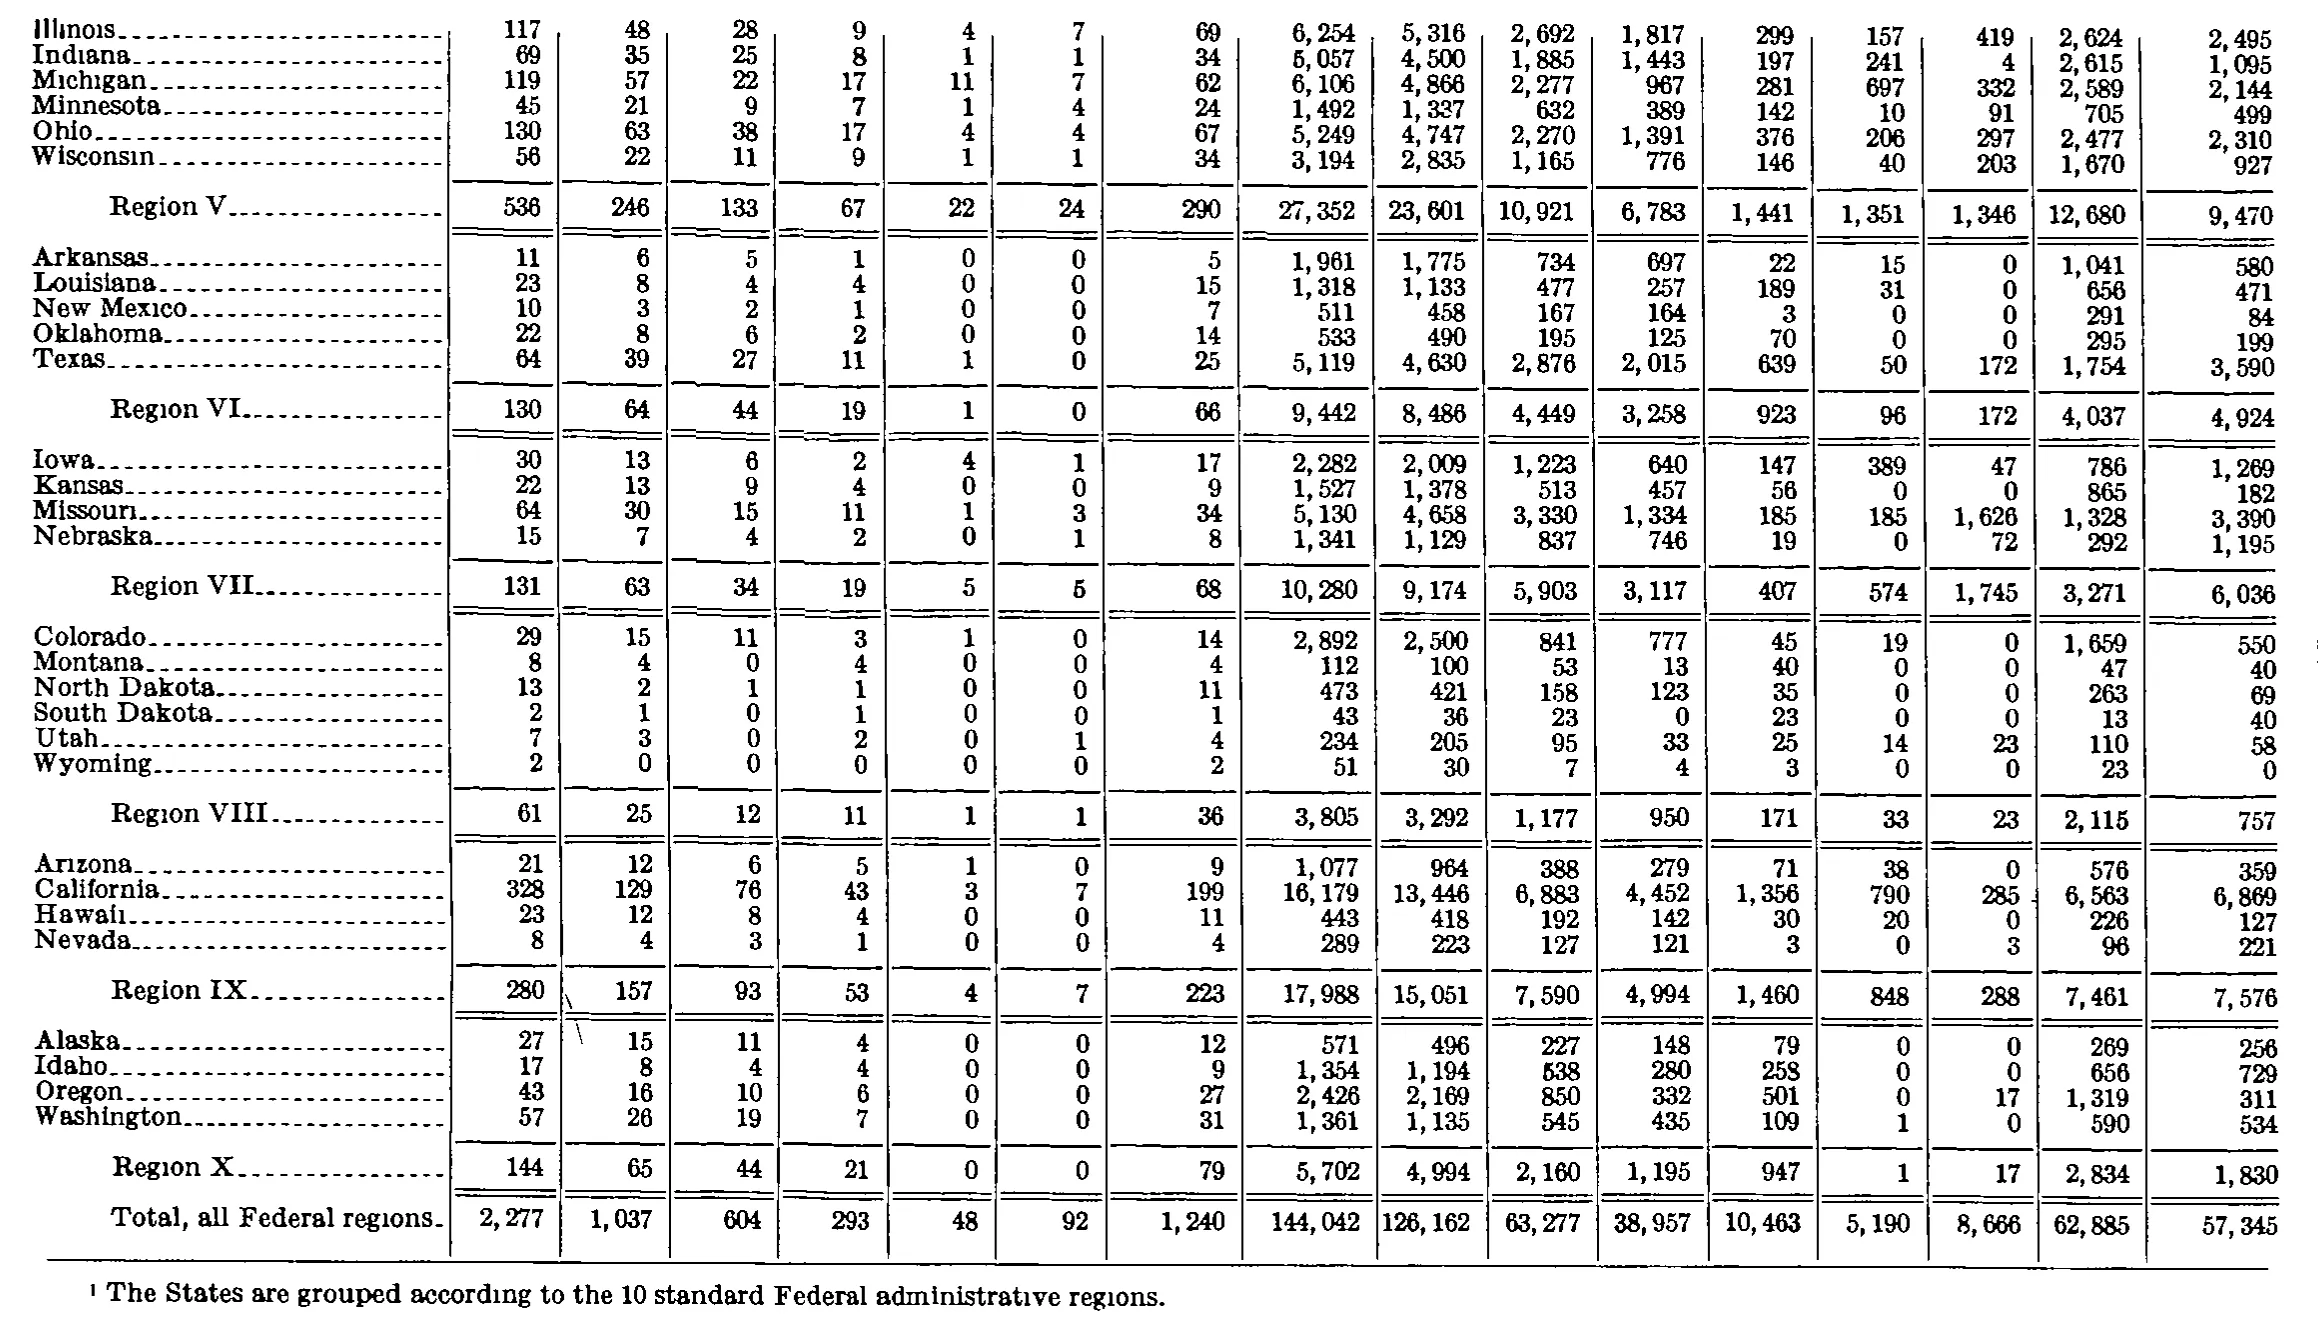
Standard Federal Administrative Regional Distribution of Representation Elections Held in Cases Closed, Transition Quarter (July–September 1976)
Stitched from pp. 269–270.
| Standard Federal regions | Total elections | Number of elections in which representation rights were won by unions | Number of elections in which no representative was chosen | Number of employees eligible to vote | Total valid votes cast | Valid votes cast for unions | Total votes for no union | Eligible employees in units choosing representation | ||||||||
|---|---|---|---|---|---|---|---|---|---|---|---|---|---|---|---|---|
| Standard Federal regions | Total elections | Total | AFL-CIO unions | Teamsters | Other national unions | Other local unions | Number of elections in which no representative was chosen | Number of employees eligible to vote | Total valid votes cast | Total | AFL-CIO unions | Teamsters | Other national unions | Other local unions | Total votes for no union | Eligible employees in units choosing representation |
| Connecticut | 18 | 9 | 4 | 4 | 1 | 0 | 9 | 1,445 | 1,312 | 466 | 169 | 221 | 67 | 9 | 846 | 229 |
| Maine | 27 | 23 | 20 | 3 | 0 | 0 | 4 | 1,565 | 1,392 | 730 | 674 | 56 | 0 | 0 | 662 | 670 |
| Massachusetts | 69 | 32 | 19 | 9 | 0 | 4 | 37 | 4,841 | 4,197 | 2,120 | 1,439 | 480 | 0 | 201 | 2,077 | 2,214 |
| New Hampshire | 4 | 1 | 0 | 1 | 0 | 0 | 3 | 167 | 160 | 48 | 19 | 29 | 0 | 0 | 112 | 6 |
| Rhode Island | 14 | 5 | 3 | 0 | 0 | 2 | 9 | 1,173 | 1,031 | 454 | 368 | 18 | 0 | 68 | 577 | 301 |
| Vermont | 2 | 1 | 1 | 0 | 0 | 0 | 1 | 105 | 103 | 23 | 23 | 0 | 0 | 0 | 80 | 9 |
| Region I | 134 | 71 | 47 | 17 | 1 | 6 | 63 | 9,296 | 8,195 | 3,841 | 2,692 | 804 | 67 | 278 | 4,354 | 3,429 |
| Delaware | 3 | 3 | 1 | 1 | 0 | 1 | 0 | 162 | 139 | 130 | 36 | 52 | 0 | 42 | 9 | 162 |
| New Jersey | 86 | 47 | 28 | 10 | 2 | 7 | 39 | 5,498 | 4,798 | 2,306 | 947 | 855 | 121 | 383 | 2,492 | 1,877 |
| New York | 160 | 73 | 35 | 15 | 3 | 20 | 87 | 7,616 | 6,535 | 3,515 | 1,958 | 388 | 82 | 1,087 | 3,020 | 4,060 |
| Puerto Rico | 30 | 16 | 4 | 3 | 0 | 9 | 14 | 1,410 | 1,305 | 835 | 223 | 103 | 0 | 509 | 470 | 793 |
| Virgin Islands | 3 | 1 | 1 | 0 | 0 | 0 | 2 | 65 | 52 | 45 | 45 | 0 | 0 | 0 | 7 | 51 |
| Region II | 282 | 140 | 69 | 29 | 5 | 37 | 142 | 14,751 | 12,829 | 6,831 | 3,209 | 1,398 | 203 | 2,021 | 5,998 | 6,943 |
| District of Columbia | 14 | 12 | 8 | 0 | 0 | 4 | 2 | 1,681 | 1,315 | 1,112 | 716 | 0 | 0 | 396 | 203 | 1,635 |
| Maryland | 38 | 14 | 10 | 4 | 0 | 0 | 24 | 3,089 | 2,597 | 913 | 666 | 244 | 0 | 3 | 1,684 | 457 |
| Pennsylvania | 155 | 62 | 31 | 22 | 4 | 5 | 93 | 15,804 | 14,172 | 8,524 | 4,434 | 641 | 1,262 | 2,187 | 5,648 | 7,119 |
| Virginia | 19 | 12 | 9 | 2 | 0 | 1 | 7 | 1,885 | 1,635 | 751 | 703 | 26 | 0 | 22 | 884 | 826 |
| West Virginia | 25 | 13 | 7 | 5 | 1 | 0 | 12 | 886 | 772 | 427 | 240 | 156 | 31 | 0 | 345 | 475 |
| Region III | 251 | 113 | 65 | 33 | 5 | 10 | 138 | 23,345 | 20,491 | 11,727 | 6,759 | 1,067 | 1,293 | 2,608 | 8,764 | 10,512 |
| Alabama | 34 | 17 | 11 | 5 | 1 | 0 | 17 | 3,737 | 3,354 | 1,505 | 1,021 | 238 | 246 | 0 | 1,849 | 1,157 |
| Florida | 40 | 6 | 5 | 1 | 0 | 0 | 34 | 2,439 | 2,143 | 832 | 552 | 211 | 0 | 69 | 1,311 | 386 |
| Georgia | 31 | 12 | 10 | 2 | 0 | 0 | 19 | 3,084 | 2,871 | 1,085 | 832 | 182 | 71 | 0 | 1,786 | 596 |
| Kentucky | 42 | 23 | 12 | 8 | 2 | 1 | 19 | 4,589 | 4,348 | 2,131 | 1,603 | 156 | 293 | 79 | 2,217 | 1,785 |
| Mississippi | 7 | 2 | 2 | 0 | 0 | 0 | 5 | 658 | 594 | 285 | 283 | 2 | 0 | 0 | 309 | 195 |
| North Carolina | 23 | 10 | 8 | 1 | 0 | 1 | 13 | 2,984 | 2,706 | 1,038 | 464 | 556 | 0 | 18 | 1,668 | 636 |
| South Carolina | 11 | 3 | 1 | 2 | 0 | 0 | 8 | 1,090 | 886 | 306 | 263 | 43 | 0 | 0 | 580 | 167 |
| Tennessee | 40 | 20 | 14 | 5 | 1 | 0 | 20 | 3,500 | 3,147 | 1,496 | 923 | 457 | 114 | 2 | 1,651 | 946 |
| Region IV | 228 | 93 | 63 | 24 | 4 | 2 | 135 | 22,081 | 20,049 | 8,678 | 5,941 | 1,845 | 724 | 168 | 11,371 | 5,868 |
| Illinois | 117 | 48 | 28 | 9 | 4 | 7 | 69 | 6,254 | 5,316 | 2,692 | 1,817 | 299 | 157 | 419 | 2,624 | 2,495 |
| Indiana | 69 | 35 | 25 | 8 | 1 | 1 | 34 | 5,057 | 4,500 | 1,885 | 1,443 | 197 | 241 | 4 | 2,615 | 1,095 |
| Michigan | 119 | 57 | 22 | 17 | 11 | 7 | 62 | 6,106 | 4,866 | 2,277 | 967 | 281 | 697 | 332 | 2,589 | 2,144 |
| Minnesota | 45 | 21 | 9 | 7 | 1 | 4 | 24 | 1,492 | 1,337 | 632 | 389 | 142 | 10 | 91 | 705 | 499 |
| Ohio | 130 | 63 | 38 | 17 | 4 | 4 | 67 | 5,249 | 4,747 | 2,270 | 1,391 | 376 | 206 | 297 | 2,477 | 2,310 |
| Wisconsin | 56 | 22 | 11 | 9 | 1 | 1 | 34 | 3,194 | 2,835 | 1,165 | 776 | 146 | 40 | 203 | 1,670 | 927 |
| Region V | 536 | 246 | 133 | 67 | 22 | 24 | 290 | 27,352 | 23,601 | 10,921 | 6,783 | 1,441 | 1,351 | 1,346 | 12,680 | 9,470 |
| Arkansas | 11 | 6 | 5 | 1 | 0 | 0 | 5 | 1,961 | 1,775 | 734 | 697 | 22 | 15 | 0 | 1,041 | 580 |
| Louisiana | 23 | 8 | 4 | 4 | 0 | 0 | 15 | 1,318 | 1,133 | 477 | 257 | 189 | 31 | 0 | 656 | 471 |
| New Mexico | 10 | 3 | 2 | 1 | 0 | 0 | 7 | 511 | 458 | 167 | 164 | 3 | 0 | 0 | 291 | 84 |
| Oklahoma | 22 | 8 | 6 | 2 | 0 | 0 | 14 | 533 | 490 | 195 | 125 | 70 | 0 | 0 | 295 | 199 |
| Texas | 64 | 39 | 27 | 11 | 1 | 0 | 25 | 5,119 | 4,630 | 2,876 | 2,015 | 639 | 50 | 172 | 1,754 | 3,590 |
| Region VI | 130 | 64 | 44 | 19 | 1 | 0 | 66 | 9,442 | 8,486 | 4,449 | 3,258 | 923 | 96 | 172 | 4,037 | 4,924 |
| Iowa | 30 | 13 | 6 | 2 | 4 | 1 | 17 | 2,282 | 2,009 | 1,223 | 640 | 147 | 389 | 47 | 786 | 1,269 |
| Kansas | 22 | 13 | 9 | 4 | 0 | 0 | 9 | 1,527 | 1,378 | 513 | 457 | 56 | 0 | 0 | 865 | 182 |
| Missouri | 64 | 30 | 15 | 11 | 1 | 3 | 34 | 5,130 | 4,658 | 3,330 | 1,334 | 185 | 185 | 1,626 | 1,328 | 3,390 |
| Nebraska | 15 | 7 | 4 | 2 | 0 | 1 | 8 | 1,341 | 1,129 | 837 | 746 | 19 | 0 | 72 | 292 | 1,195 |
| Region VII | 131 | 63 | 34 | 19 | 5 | 5 | 68 | 10,280 | 9,174 | 5,903 | 3,117 | 407 | 574 | 1,745 | 3,271 | 6,036 |
| Colorado | 29 | 15 | 11 | 3 | 1 | 0 | 14 | 2,892 | 2,500 | 841 | 777 | 45 | 19 | 0 | 1,659 | 550 |
| Montana | 8 | 4 | 0 | 4 | 0 | 0 | 4 | 112 | 100 | 53 | 13 | 40 | 0 | 0 | 47 | 40 |
| North Dakota | 13 | 2 | 1 | 1 | 0 | 0 | 11 | 473 | 421 | 158 | 123 | 35 | 0 | 0 | 263 | 69 |
| South Dakota | 2 | 1 | 0 | 1 | 0 | 0 | 1 | 43 | 36 | 23 | 0 | 23 | 0 | 0 | 13 | 40 |
| Utah | 7 | 3 | 0 | 2 | 0 | 1 | 4 | 234 | 205 | 95 | 33 | 25 | 14 | 23 | 110 | 58 |
| Wyoming | 2 | 0 | 0 | 0 | 0 | 0 | 2 | 51 | 30 | 7 | 4 | 3 | 0 | 0 | 23 | 0 |
| Region VIII | 61 | 25 | 12 | 11 | 1 | 1 | 36 | 3,805 | 3,292 | 1,177 | 950 | 171 | 33 | 23 | 2,115 | 757 |
| Arizona | 21 | 12 | 6 | 5 | 1 | 0 | 9 | 1,077 | 964 | 388 | 279 | 71 | 38 | 0 | 576 | 359 |
| California | 328 | 129 | 76 | 43 | 3 | 7 | 199 | 16,179 | 13,446 | 6,883 | 4,452 | 1,356 | 790 | 285 | 6,563 | 6,869 |
| Hawaii | 23 | 12 | 8 | 4 | 0 | 0 | 11 | 443 | 418 | 192 | 142 | 30 | 20 | 0 | 226 | 127 |
| Nevada | 8 | 4 | 3 | 1 | 0 | 0 | 4 | 289 | 223 | 127 | 121 | 3 | 0 | 3 | 96 | 221 |
| Region IX | 280 | 157 | 93 | 53 | 4 | 7 | 223 | 17,988 | 15,051 | 7,590 | 4,994 | 1,460 | 848 | 288 | 7,461 | 7,576 |
| Alaska | 27 | 15 | 11 | 4 | 0 | 0 | 12 | 571 | 496 | 227 | 148 | 79 | 0 | 0 | 269 | 256 |
| Idaho | 17 | 8 | 4 | 4 | 0 | 0 | 9 | 1,354 | 1,194 | 538 | 280 | 258 | 0 | 0 | 656 | 729 |
| Oregon | 43 | 16 | 10 | 6 | 0 | 0 | 27 | 2,426 | 2,169 | 850 | 332 | 501 | 0 | 17 | 1,319 | 311 |
| Washington | 57 | 26 | 19 | 7 | 0 | 0 | 31 | 1,361 | 1,135 | 545 | 435 | 109 | 1 | 0 | 590 | 534 |
| Region X | 144 | 65 | 44 | 21 | 0 | 0 | 79 | 5,702 | 4,994 | 2,160 | 1,195 | 947 | 1 | 17 | 2,834 | 1,830 |
| Total, all Federal regions | 2,277 | 1,037 | 604 | 293 | 48 | 92 | 1,240 | 144,042 | 126,162 | 63,277 | 38,957 | 10,463 | 5,190 | 8,666 | 62,885 | 57,345 |
- 1 The States are grouped according to the 10 standard Federal administrative regions.
881 of 888 figures sit in a row or column sum that works out. 8 cells break a sum: 'Region VII', column 11: prints 5,903, columns 12 to 15 add to 5,843; 'Total, all Federal regions', column 11: prints 63,277, columns 12 to 15 add to 63,276; 'Region IX', column 2: prints 280, the subtotals in columns 3 to 8 add to 380; 'Region VII', column 12: prints 3,117, rows 'Iowa' to 'Nebraska' add to 3,177; 'Region IX', column 2: prints 280, rows 'Arizona' to 'Nevada' add to 380; 'Region X', column 9: prints 5,702, rows 'Alaska' to 'Washington' add to 5,712; 'Total, all Federal regions', column 2: prints 2,277, the subtotals in rows 'Region I' to 'Region X' add to 2,177; 'Total, all Federal regions', column 12: prints 38,957, the subtotals in rows 'Region I' to 'Region X' add to 38,898.
Reader’s notes
p. 269. The crop ends just below the "Region IV" subtotal line; the table continues on the following page (Regions V onward are not on this image). The stub heading carries a raised "1" footnote marker, but the footnote text itself is not printed within this crop, so `footnotes` is empty. Scan quality: the page has stray ink specks and broken rules in the "Other national unions" election column (e.g. small marks beside Maryland's 0, Pennsylvania's 4, Virginia's 2, Kentucky's 23, Mississippi's 0, North Carolina's 0, Tennessee's 1 and the Region IV 4). I read these as speckle rather than digits or markers; all affected columns were checked arithmetically and are consistent. Verification: every one of the 16 numeric columns in each of the four regional subtotal rows (Region I, II, III, IV) equals the sum of its member state rows exactly, and in each region the five "won by unions" component columns sum to their printed Total, as do the five "valid votes cast for unions" components. No printed value appears to be a misprint.
p. 270. Continuation page: no column headings are printed on this crop, so header_rows is empty. The grid has 17 columns (stub + 16 numeric), counted from the column rules; the last numeric column is set off from the rest by a wider gap and its figures sit slightly lower on each line, but it is one regular column. The table continues from the previous page (Regions I-IV are not on this crop); the crop ends after the "Total, all Federal regions" line and its footnote 1. Four printed totals do not add up from the printed detail; all are transcribed exactly as printed: - Region VII, column 11 (the 4th of the large-number columns, printed 3,117): the four state figures above it (640, 457, 1,334, 746) sum to 3,177, and 3,177 is also what the same row's column 10 value of 5,903 requires (3,177+407+574+1,745). The printed digits do read "3, 117"; a misprint (or a worn 7) is likely. - Region IX, column 1 (printed 280): the four state figures above it (21, 328, 23, 8) sum to 380, and the row's own columns 2 and 7 (157 + 223) also give 380. Printed as 280; the glyph is clearly a 2. A short stray ink stroke crosses the rule just to the right of this cell and again just below it, between the Region IX and Alaska lines; it is a scan artifact, not a digit or a footnote marker. - Region X, column 8 (printed 5,702): the four state figures above it (571, 1,354, 2,426, 1,361) sum to 5,712. No internal cross-check resolves which cell is at fault. - Total, all Federal regions, column 10 (printed 63,277): columns 11-14 of the same row (38,957 + 10,463 + 5,190 + 8,666) sum to 63,276, one less. Every other row satisfies this relation exactly. Every other row and region subtotal was cross-checked against the table's internal relations (col 1 = col 2 + col 7; col 2 = cols 3-6; col 10 = cols 11-14; col 9 = col 10 + col 15) and against the column sums within each region, and all agree. Row labels are lightly broken by the scan (e.g. the dotted i in "Illinois", "Michigan", "Missouri", "Hawaii") but all state names are unambiguous.
Source image
Source data: U.S. NLRB Annual Reports (public domain). Reconstruction by NLRB Stats Archive. Read by claude-opus-5 (effort max, prompt extract_v1) from the 300-dpi scan; stitched by page. Updated October 2026.