NLRB Stats Archive › Annual Reports › FY1977 › Results of Union-Shop Deauthorization Polls in Cases Closed, Transition Quarter (July–September 1976)
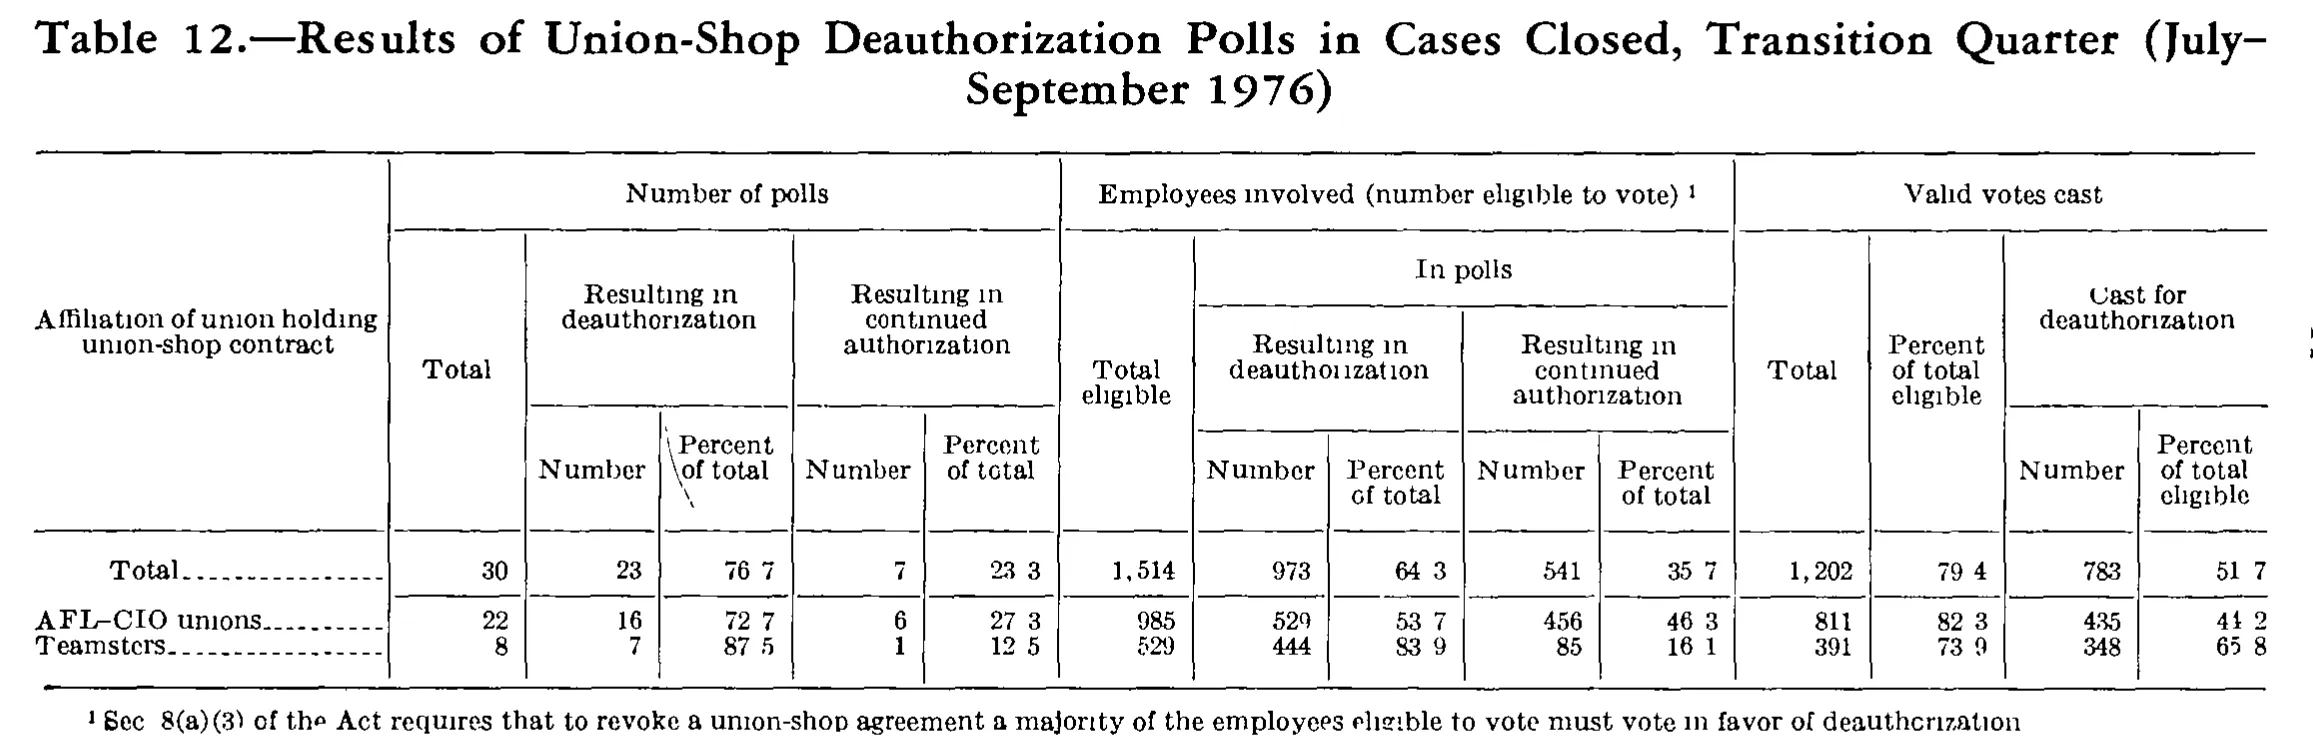
Results of Union-Shop Deauthorization Polls in Cases Closed, Transition Quarter (July–September 1976)
| Affiliation of union holding union-shop contract | Number of polls | Employees involved (number eligible to vote) | Valid votes cast | |||||||||||
|---|---|---|---|---|---|---|---|---|---|---|---|---|---|---|
| Affiliation of union holding union-shop contract | Total | Resulting in deauthorization | Resulting in continued authorization | Total eligible | In polls | Total | Percent of total eligible | Cast for deauthorization | ||||||
| Affiliation of union holding union-shop contract | Total | Resulting in deauthorization | Resulting in continued authorization | Total eligible | Resulting in deauthorization | Resulting in continued authorization | Total | Percent of total eligible | Cast for deauthorization | |||||
| Affiliation of union holding union-shop contract | Total | Number | Percent of total | Number | Percent of total | Total eligible | Number | Percent of total | Number | Percent of total | Total | Percent of total eligible | Number | Percent of total eligible |
| Total | 30 | 23 | 76.7 | 7 | 23.3 | 1,514 | 973 | 64.3 | 541 | 35.7 | 1,202 | 79.4 | 783 | 51.7 |
| AFL-CIO unions | 22 | 16 | 72.7 | 6 | 27.3 | 985 | 529 | 53.7 | 456 | 46.3 | 811 | 82.3 | 435 | 44.2 |
| Teamsters | 8 | 7 | 87.5 | 1 | 12.5 | 529 | 444 | 83.9 | 85 | 16.1 | 391 | 73.9 | 348 | 65.8 |
- 1 Sec. 8(a)(3) of the Act requires that to revoke a union-shop agreement a majority of the employees eligible to vote must vote in favor of deauthorization
24 of 24 figures sit in a row or column sum that works out.
Reader’s notes
p. 260. Table has 15 printed columns (stub + 5 under "Number of polls" + 5 under "Employees involved" + 4 under "Valid votes cast") and 4 heading levels; "Total" (polls), "Total eligible", "Total" (valid votes) and "Percent of total eligible" are tall single headings spanning levels 2-4, "Resulting in deauthorization"/"Resulting in continued authorization" (polls group) and "Cast for deauthorization" span levels 2-3. Decimal points: the period in every percent value is faint or dropped in this scan, so the cells image as "76 7", "23 3", "64 3", etc. I read them as decimal points ("76.7", "23.3", ...). Every one of the 18 percentages is arithmetically consistent with the integer counts in the same row (e.g. 23/30 = 76.7, 435/985 = 44.2, 348/529 = 65.8), which confirms both the decimal reading and the digits. Other faint-period instances: "Sec 8(a)(3)" in the footnote is transcribed as "Sec. 8(a)(3)"; no terminal period is visible at the end of the footnote and none was added. The AFL-CIO row's last cell ("44.2") has a damaged first digit in the scan that could be misread as "41"; the ratio 435/985 = 44.2 settles it as 44.2. Minor: a stray ink mark sits in the right margin outside the table rule, level with the "Cast for deauthorization" heading; it is a page artifact, not a table cell. A diagonal scratch crosses the "Percent of total" heading in the polls-deauthorization column but the words are legible. Row labels are printed with leader dots, which have been dropped.
Source image
Source data: U.S. NLRB Annual Reports (public domain). Reconstruction by NLRB Stats Archive. Read by claude-opus-5 (effort max, prompt extract_v1) from the 300-dpi scan; stitched by page. Updated October 2026.