NLRB Stats Archive › Annual Reports › FY1977 › Analysis of Methods of Disposition of Representation and Union Deauthorization Cases Closed, Transition Quarter (July–September 1976)
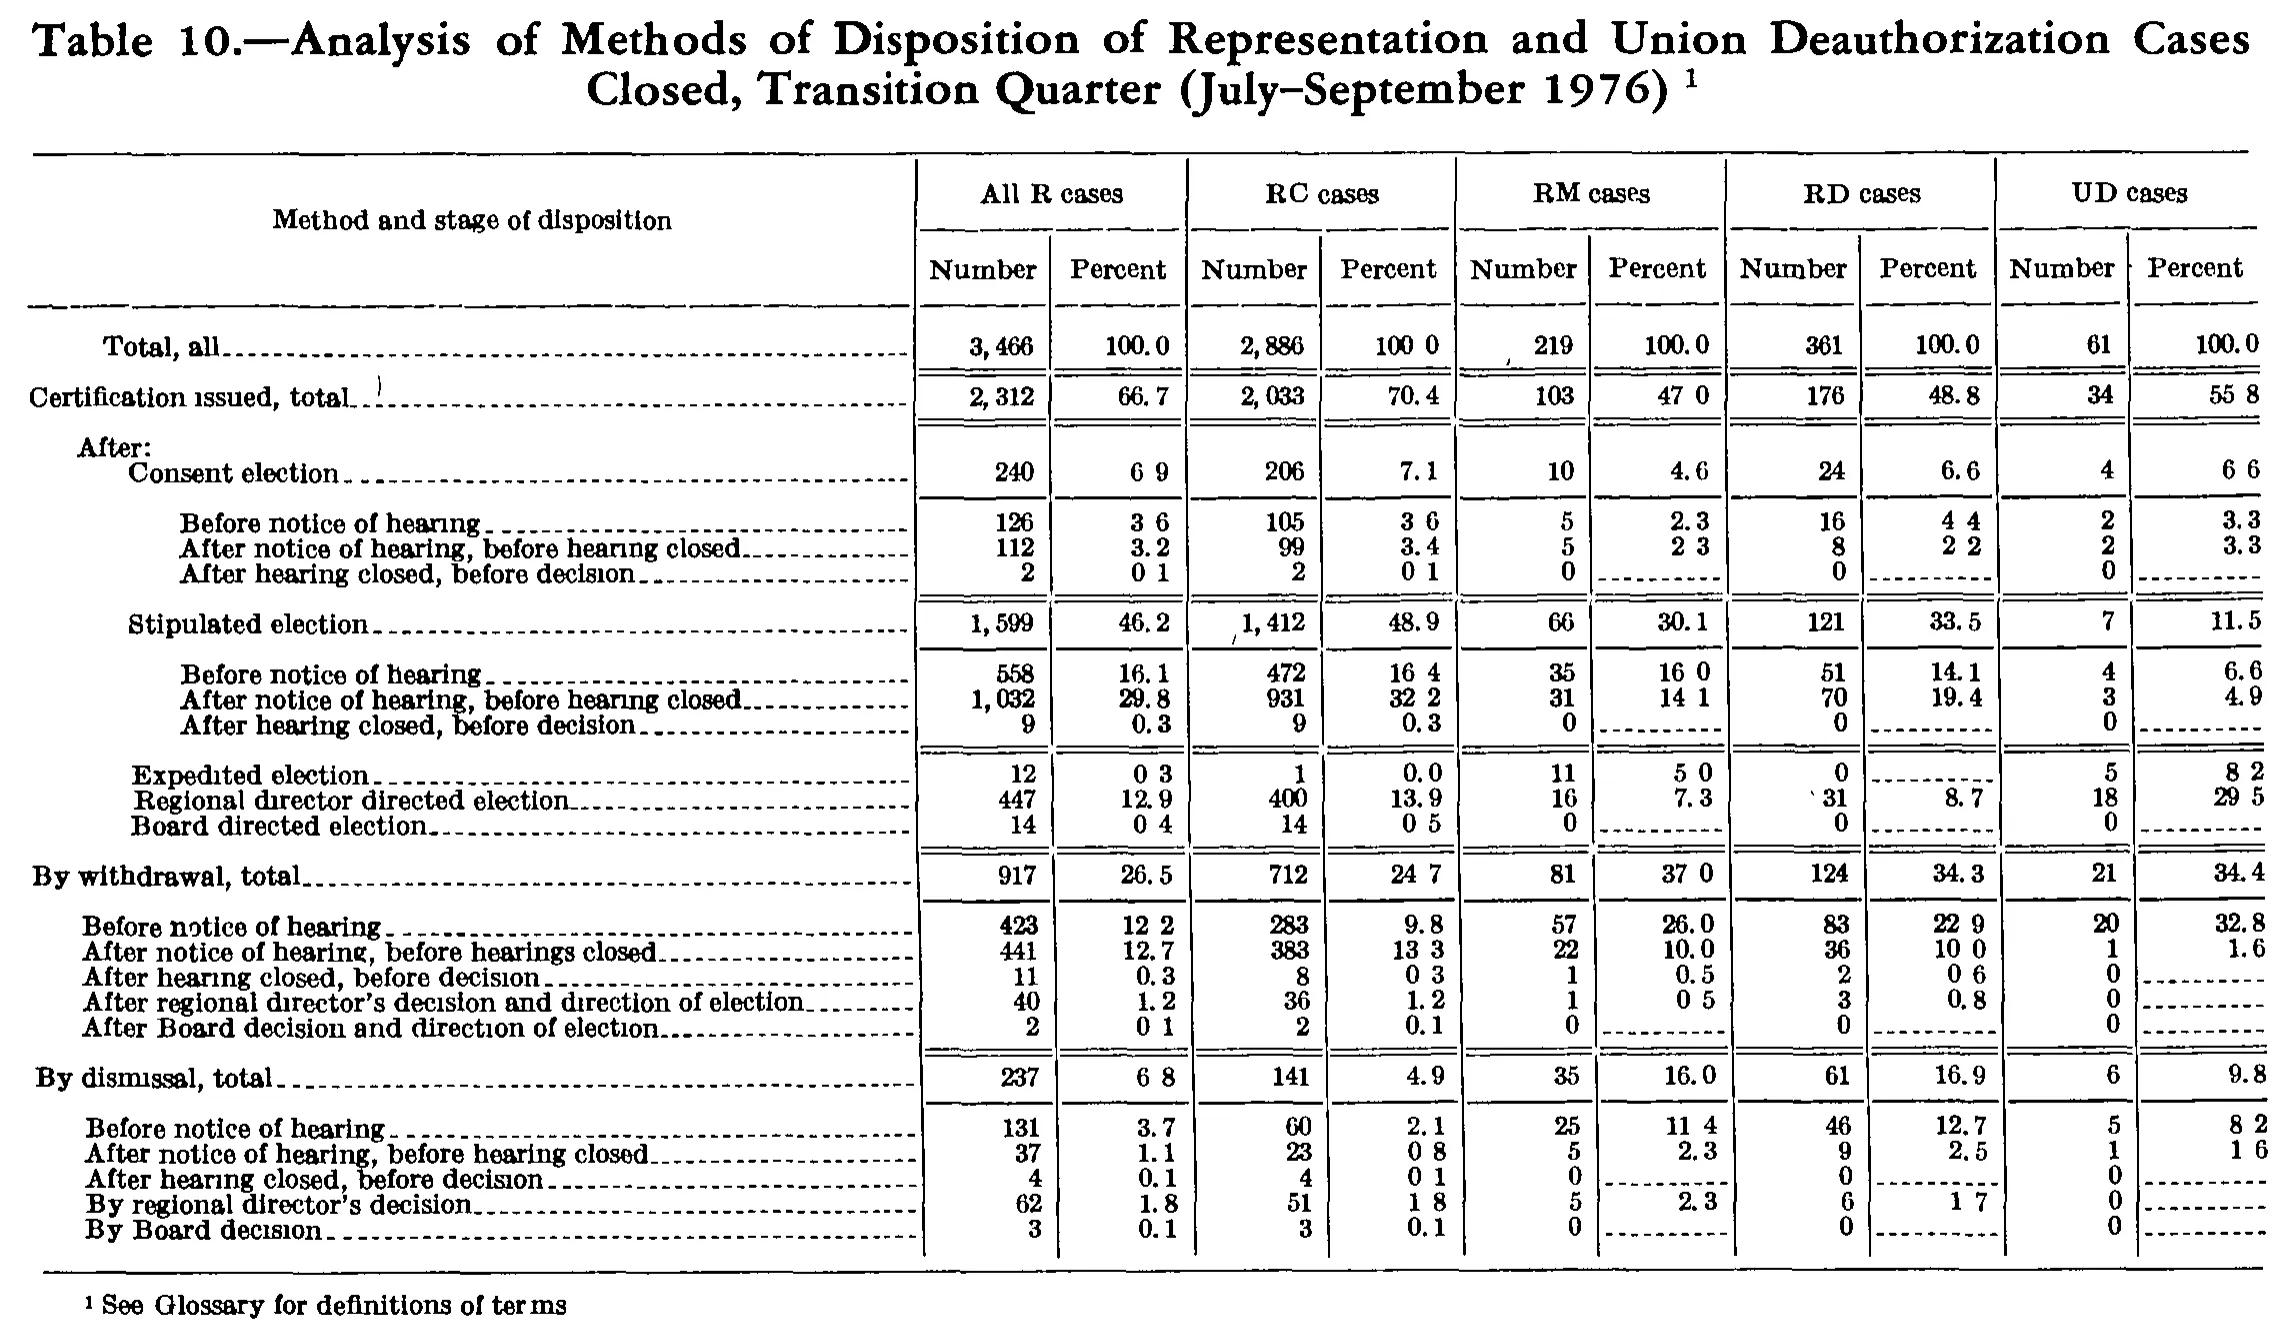
Analysis of Methods of Disposition of Representation and Union Deauthorization Cases Closed, Transition Quarter (July–September 1976)
| Method and stage of disposition | All R cases | RC cases | RM cases | RD cases | UD cases | |||||
|---|---|---|---|---|---|---|---|---|---|---|
| Method and stage of disposition | Number | Percent | Number | Percent | Number | Percent | Number | Percent | Number | Percent |
| Total, all | 3,466 | 100.0 | 2,886 | 100.0 | 219 | 100.0 | 361 | 100.0 | 61 | 100.0 |
| Certification issued, total | 2,312 | 66.7 | 2,033 | 70.4 | 103 | 47.0 | 176 | 48.8 | 34 | 55.8 |
| After: | ||||||||||
| Consent election | 240 | 6.9 | 206 | 7.1 | 10 | 4.6 | 24 | 6.6 | 4 | 6.6 |
| Before notice of hearing | 126 | 3.6 | 105 | 3.6 | 5 | 2.3 | 16 | 4.4 | 2 | 3.3 |
| After notice of hearing, before hearing closed | 112 | 3.2 | 99 | 3.4 | 5 | 2.3 | 8 | 2.2 | 2 | 3.3 |
| After hearing closed, before decision | 2 | 0.1 | 2 | 0.1 | 0 | 0 | 0 | |||
| Stipulated election | 1,599 | 46.2 | 1,412 | 48.9 | 66 | 30.1 | 121 | 33.5 | 7 | 11.5 |
| Before notice of hearing | 558 | 16.1 | 472 | 16.4 | 35 | 16.0 | 51 | 14.1 | 4 | 6.6 |
| After notice of hearing, before hearing closed | 1,032 | 29.8 | 931 | 32.2 | 31 | 14.1 | 70 | 19.4 | 3 | 4.9 |
| After hearing closed, before decision | 9 | 0.3 | 9 | 0.3 | 0 | 0 | 0 | |||
| Expedited election | 12 | 0.3 | 1 | 0.0 | 11 | 5.0 | 0 | 5 | 8.2 | |
| Regional director directed election | 447 | 12.9 | 400 | 13.9 | 16 | 7.3 | 31 | 8.7 | 18 | 29.5 |
| Board directed election | 14 | 0.4 | 14 | 0.5 | 0 | 0 | 0 | |||
| By withdrawal, total | 917 | 26.5 | 712 | 24.7 | 81 | 37.0 | 124 | 34.3 | 21 | 34.4 |
| Before notice of hearing | 423 | 12.2 | 283 | 9.8 | 57 | 26.0 | 83 | 22.9 | 20 | 32.8 |
| After notice of hearing, before hearings closed | 441 | 12.7 | 383 | 13.3 | 22 | 10.0 | 36 | 10.0 | 1 | 1.6 |
| After hearing closed, before decision | 11 | 0.3 | 8 | 0.3 | 1 | 0.5 | 2 | 0.6 | 0 | |
| After regional director's decision and direction of election | 40 | 1.2 | 36 | 1.2 | 1 | 0.5 | 3 | 0.8 | 0 | |
| After Board decision and direction of election | 2 | 0.1 | 2 | 0.1 | 0 | 0 | 0 | |||
| By dismissal, total | 237 | 6.8 | 141 | 4.9 | 35 | 16.0 | 61 | 16.9 | 6 | 9.8 |
| Before notice of hearing | 131 | 3.7 | 60 | 2.1 | 25 | 11.4 | 46 | 12.7 | 5 | 8.2 |
| After notice of hearing, before hearing closed | 37 | 1.1 | 23 | 0.8 | 5 | 2.3 | 9 | 2.5 | 1 | 1.6 |
| After hearing closed, before decision | 4 | 0.1 | 4 | 0.1 | 0 | 0 | 0 | |||
| By regional director's decision | 62 | 1.8 | 51 | 1.8 | 5 | 2.3 | 6 | 1.7 | 0 | |
| By Board decision | 3 | 0.1 | 3 | 0.1 | 0 | 0 | 0 | |||
- 1 See Glossary for definitions of terms
103 of 103 figures sit in a row or column sum that works out.
Reader’s notes
p. 254. Eleven columns: stub plus Number/Percent pairs for All R, RC, RM, RD and UD cases. The caption carries footnote marker 1 but the caption is excluded per instructions; no row label or in-table value carries a marker. Decimal points: in this 1-bit scan the period drops out of many Percent cells, which print as e.g. "100 0", "47 0", "6 9", "22 9", "0 1". Every Percent value in the table is a one-decimal figure, so these have been written with the decimal point restored (100.0, 47.0, 6.9, 22.9, 0.1). No digits were altered. Percent cells whose dash rule ("------") marks a zero-value row are given as "" ; the paired Number cell in those rows prints an explicit 0 and is kept as 0. Arithmetic cross-checks: every Number column reconciles exactly (section components sum to their totals, and the three method totals sum to "Total, all") for all five case types, so the Number grid is well supported. Doubtful cells, all in Percent columns, where the printed figure sits one tenth above the value implied by the printed counts: "Certification issued, total" / UD cases Percent read as 55.8 (34 of 61 = 55.7); "Stipulated election" / All R cases Percent read as 46.2 (1,599 of 3,466 = 46.1); "Regional director directed election" / RD cases Percent read as 8.7 (31 of 361 = 8.6). The final digit in each is small and partly broken up by the scan, so these may be either printer's roundings or misreadings of 7/1/6. All three are transcribed as read. Elsewhere the table rounds inconsistently (e.g. "Before notice of hearing" under By withdrawal / RD cases prints 22.9 where 83 of 361 = 22.99, and "Before notice of hearing" under By dismissal / All R prints 3.7 where 131 of 3,466 = 3.78), i.e. truncation rather than rounding; these are transcribed as printed. "After notice of hearing, before hearings closed" under "By withdrawal, total" prints "hearings" in the plural, unlike the otherwise identical labels in the other sections; kept as printed. The "After:" line is a label-only lead-in to the certification breakdown and carries no values. A stray ink tick appears just left of 31 in "Regional director directed election" / RD cases Number and just left of 1,412 and 1,599; these are not digits or markers.
Source image
Source data: U.S. NLRB Annual Reports (public domain). Reconstruction by NLRB Stats Archive. Read by claude-opus-5 (effort max, prompt extract_v1) from the 300-dpi scan; stitched by page. Updated October 2026.