NLRB Stats Archive › Annual Reports › FY1977 › Geographic Distribution of Cases Received, Transition Quarter (July–September 1976)
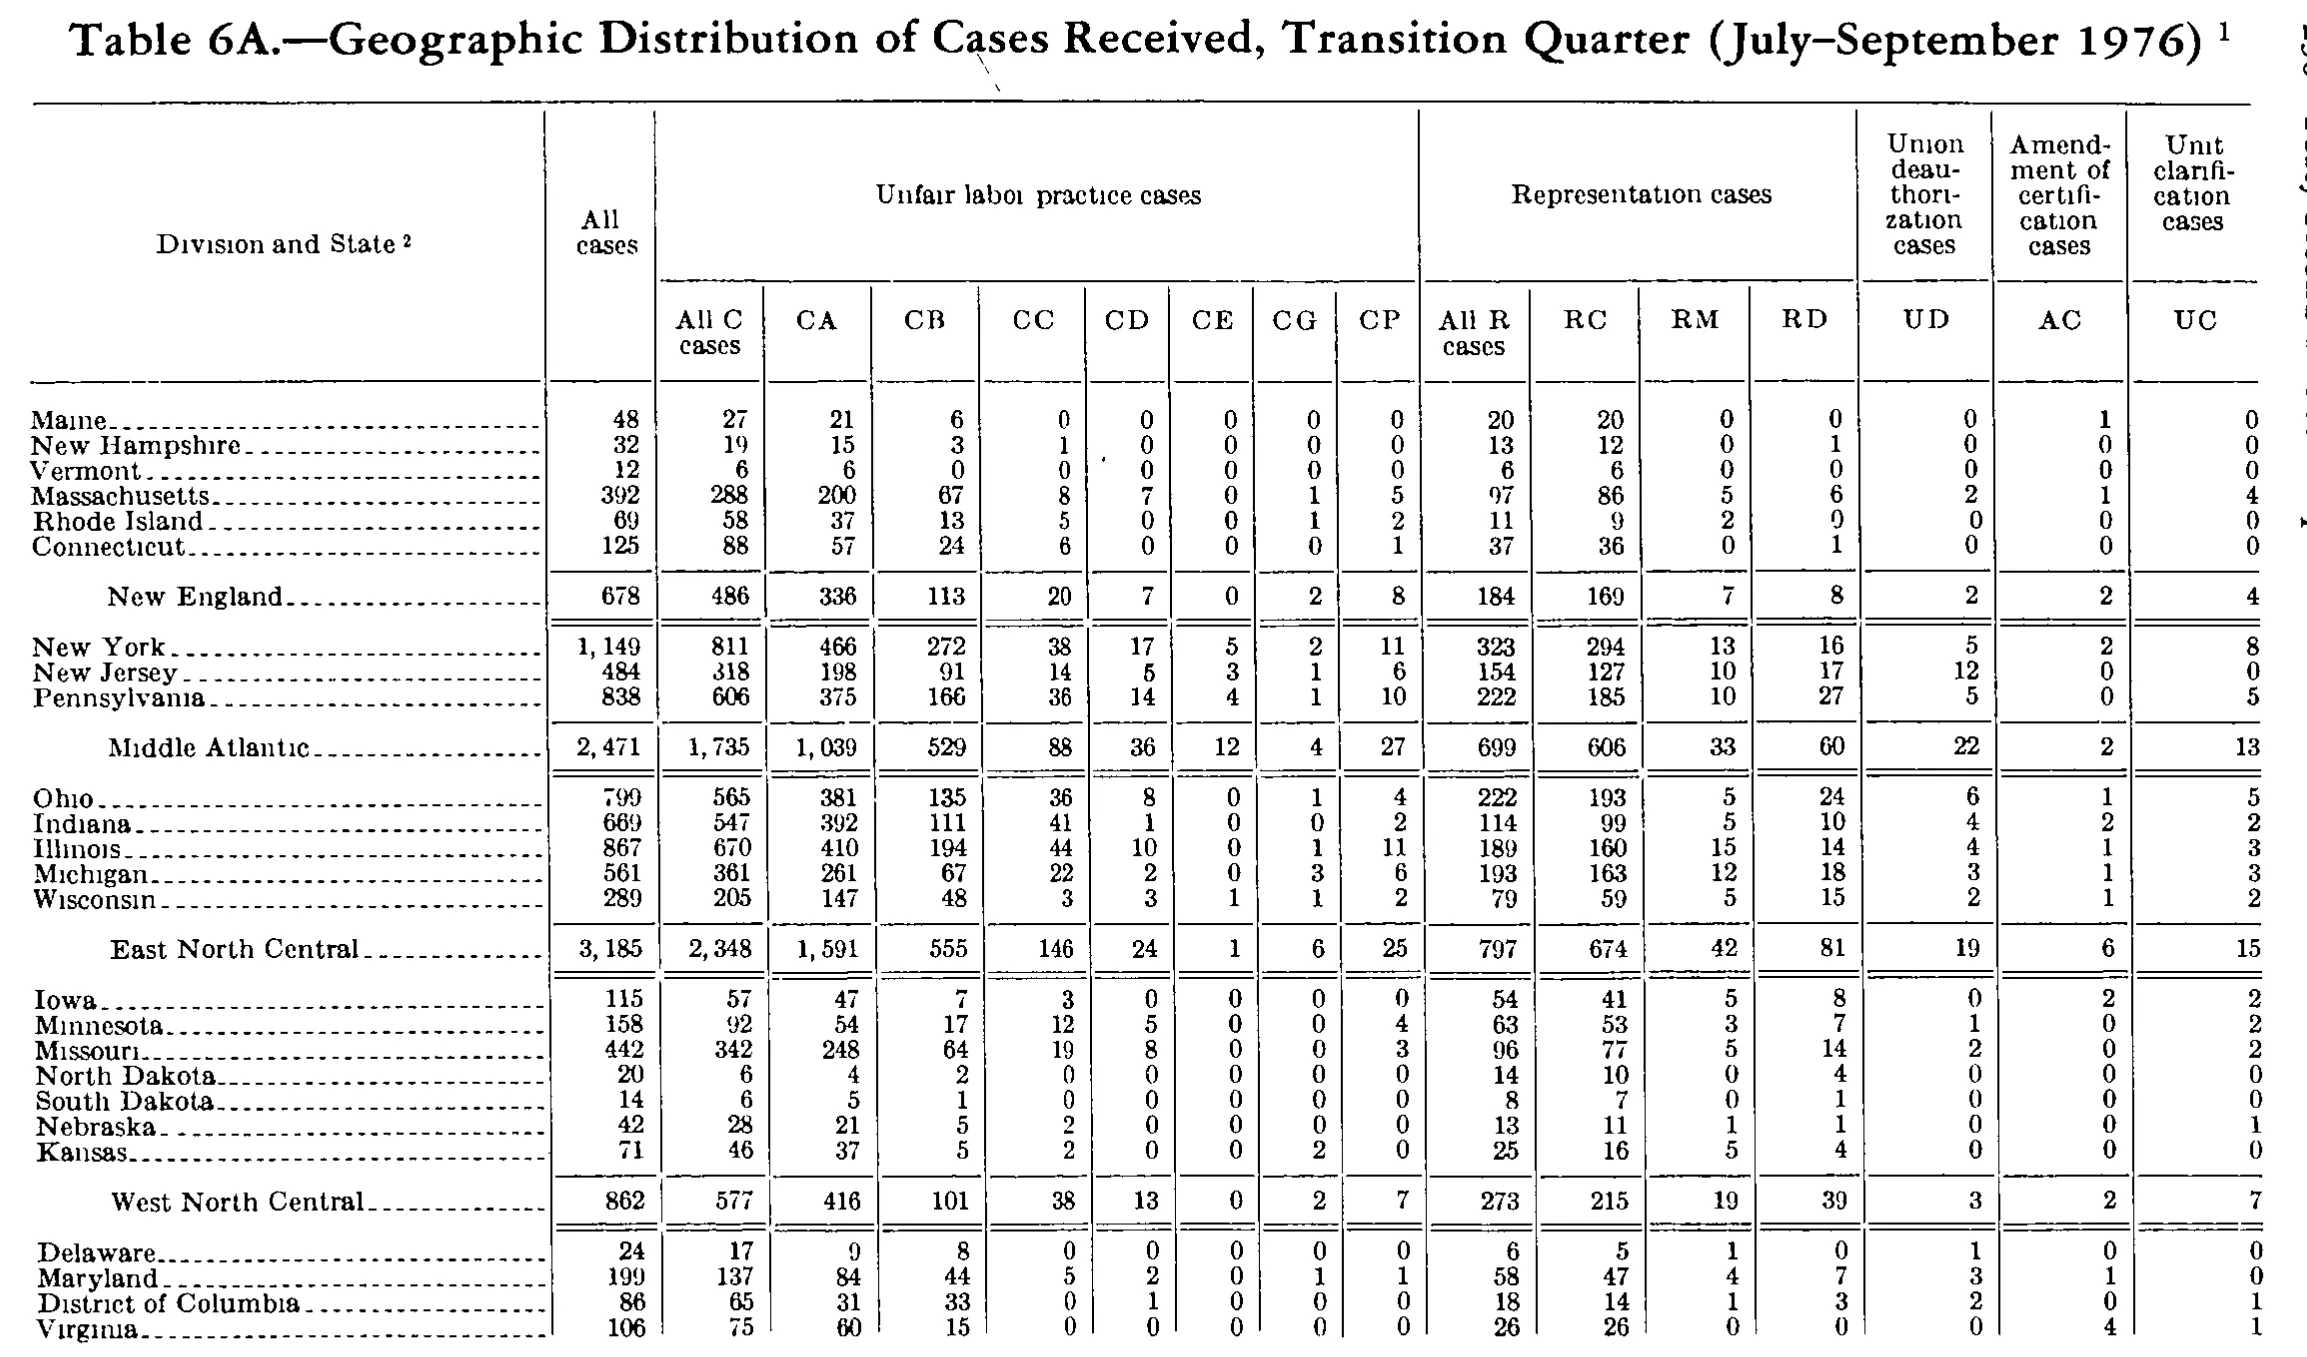
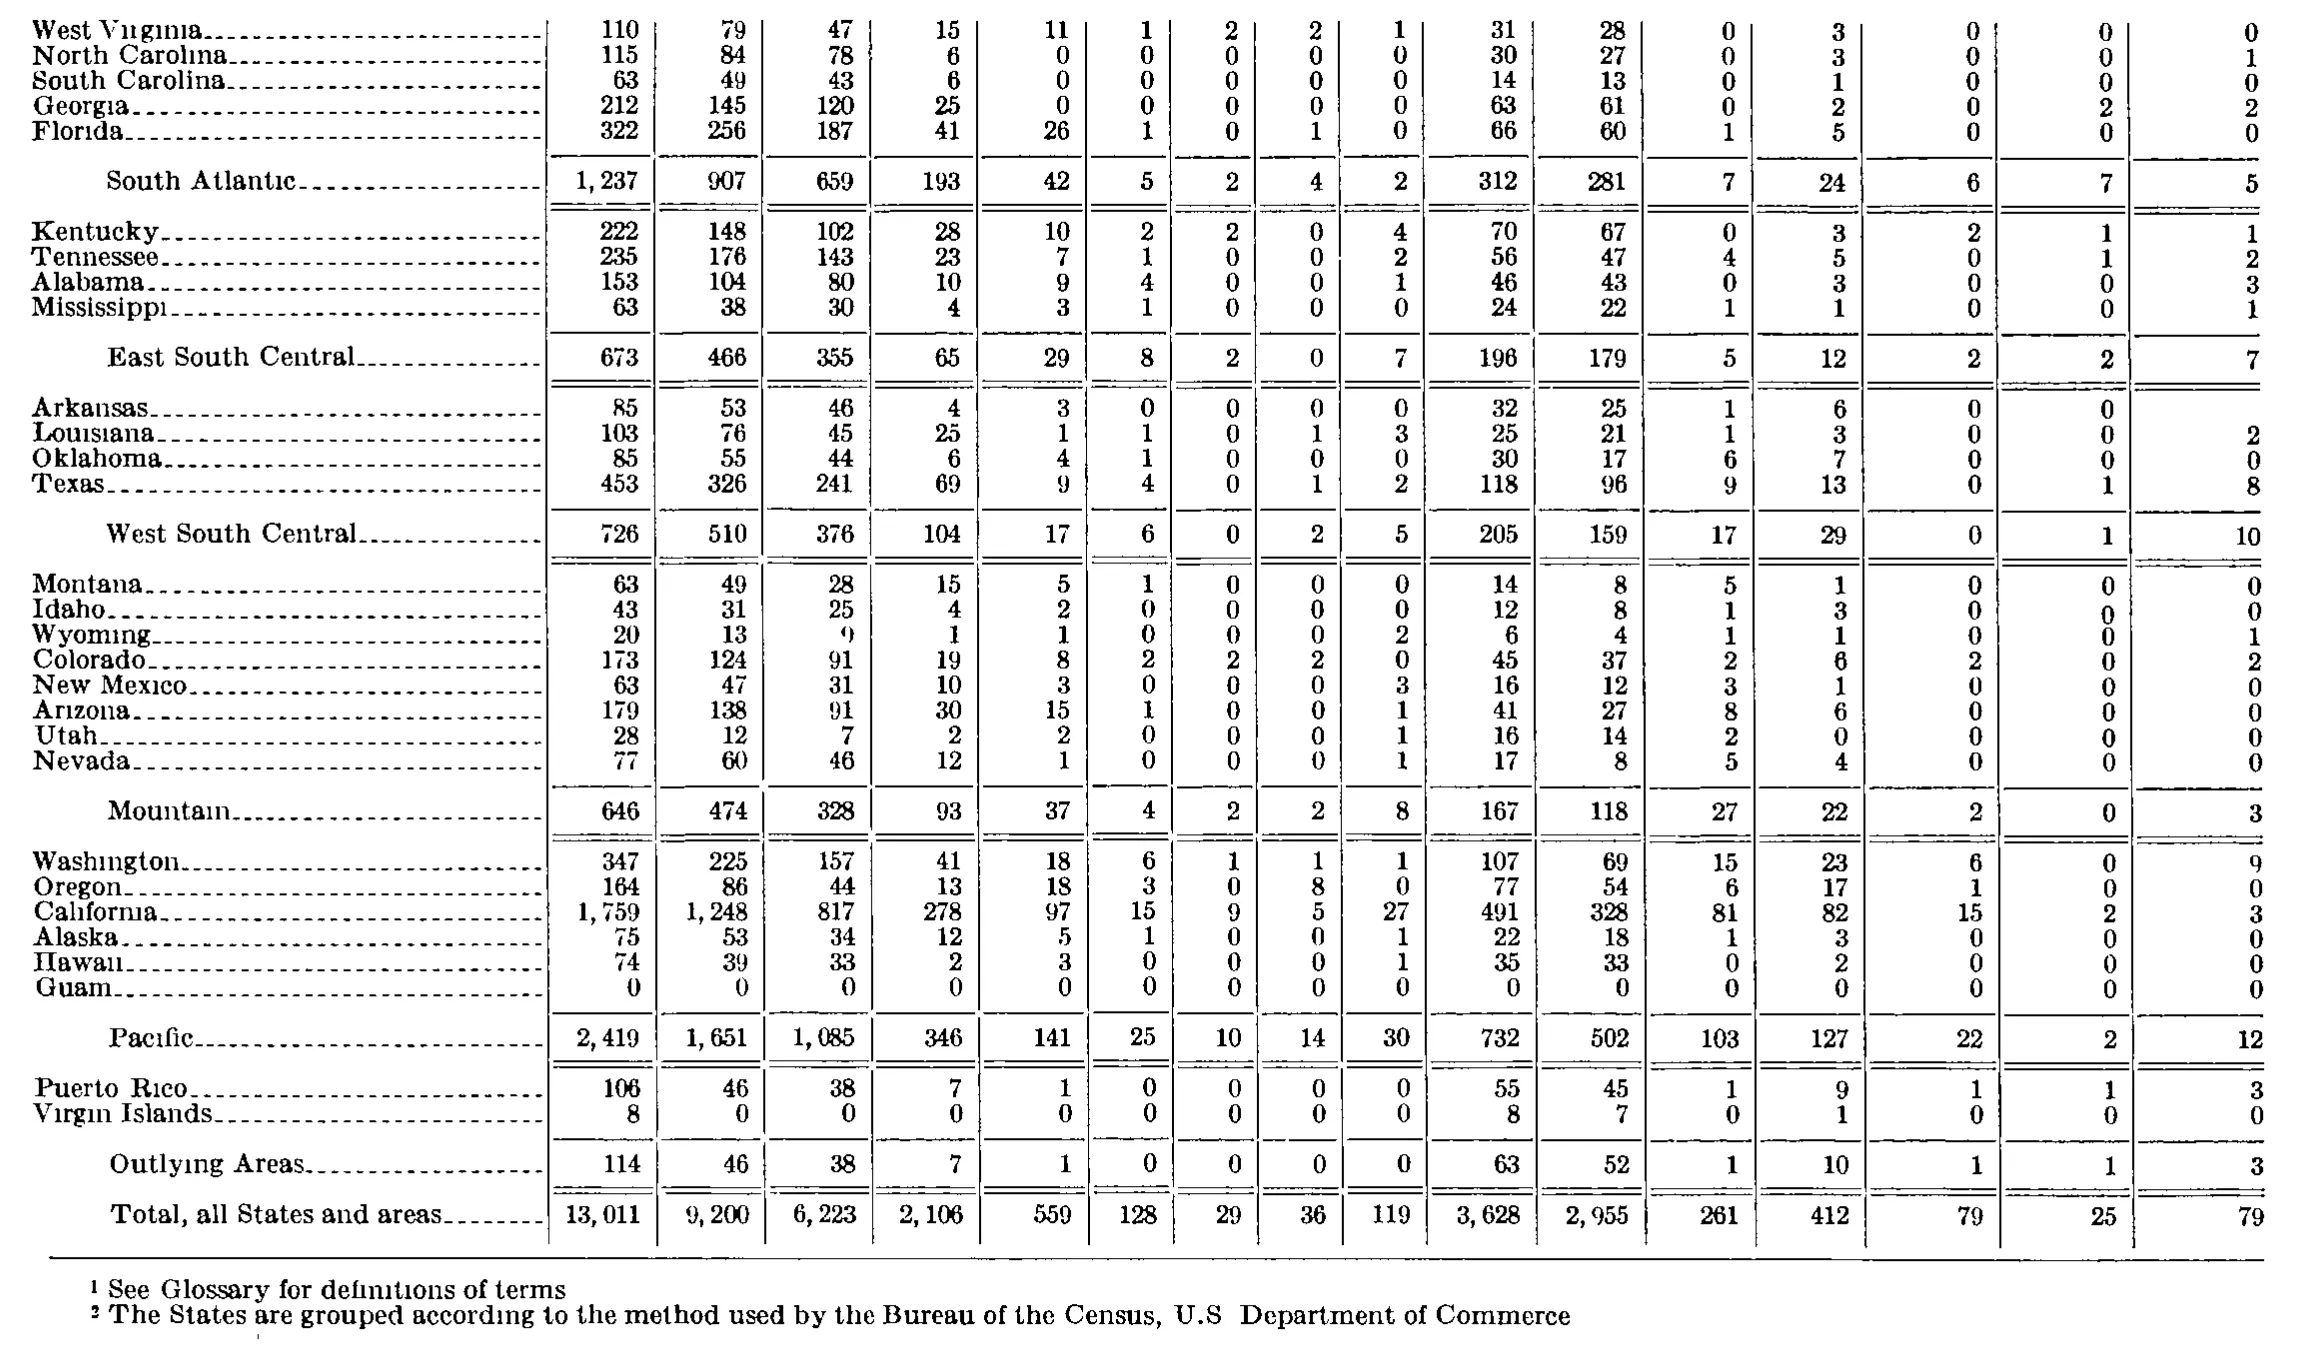
Geographic Distribution of Cases Received, Transition Quarter (July–September 1976)
Stitched from pp. 245–246.
| Division and State | All cases | Unfair labor practice cases | Representation cases | Union deauthorization cases | Amendment of certification cases | Unit clarification cases | ||||||||||
|---|---|---|---|---|---|---|---|---|---|---|---|---|---|---|---|---|
| Division and State | All cases | All C cases | CA | CB | CC | CD | CE | CG | CP | All R cases | RC | RM | RD | UD | AC | UC |
| Maine | 48 | 27 | 21 | 6 | 0 | 0 | 0 | 0 | 0 | 20 | 20 | 0 | 0 | 0 | 1 | 0 |
| New Hampshire | 32 | 19 | 15 | 3 | 1 | 0 | 0 | 0 | 0 | 13 | 12 | 0 | 1 | 0 | 0 | 0 |
| Vermont | 12 | 6 | 6 | 0 | 0 | 0 | 0 | 0 | 0 | 6 | 6 | 0 | 0 | 0 | 0 | 0 |
| Massachusetts | 392 | 288 | 200 | 67 | 8 | 7 | 0 | 1 | 5 | 97 | 86 | 5 | 6 | 2 | 1 | 4 |
| Rhode Island | 69 | 58 | 37 | 13 | 5 | 0 | 0 | 1 | 2 | 11 | 9 | 2 | 9 | 0 | 0 | 0 |
| Connecticut | 125 | 88 | 57 | 24 | 6 | 0 | 0 | 0 | 1 | 37 | 36 | 0 | 1 | 0 | 0 | 0 |
| New England | 678 | 486 | 336 | 113 | 20 | 7 | 0 | 2 | 8 | 184 | 169 | 7 | 8 | 2 | 2 | 4 |
| New York | 1,149 | 811 | 466 | 272 | 38 | 17 | 5 | 2 | 11 | 323 | 294 | 13 | 16 | 5 | 2 | 8 |
| New Jersey | 484 | 318 | 198 | 91 | 14 | 5 | 3 | 1 | 6 | 154 | 127 | 10 | 17 | 12 | 0 | 0 |
| Pennsylvania | 838 | 606 | 375 | 166 | 36 | 14 | 4 | 1 | 10 | 222 | 185 | 10 | 27 | 5 | 0 | 5 |
| Middle Atlantic | 2,471 | 1,735 | 1,039 | 529 | 88 | 36 | 12 | 4 | 27 | 699 | 606 | 33 | 60 | 22 | 2 | 13 |
| Ohio | 799 | 565 | 381 | 135 | 36 | 8 | 0 | 1 | 4 | 222 | 193 | 5 | 24 | 6 | 1 | 5 |
| Indiana | 669 | 547 | 392 | 111 | 41 | 1 | 0 | 0 | 2 | 114 | 99 | 5 | 10 | 4 | 2 | 2 |
| Illinois | 867 | 670 | 410 | 194 | 44 | 10 | 0 | 1 | 11 | 189 | 160 | 15 | 14 | 4 | 1 | 3 |
| Michigan | 561 | 361 | 261 | 67 | 22 | 2 | 0 | 3 | 6 | 193 | 163 | 12 | 18 | 3 | 1 | 3 |
| Wisconsin | 289 | 205 | 147 | 48 | 3 | 3 | 1 | 1 | 2 | 79 | 59 | 5 | 15 | 2 | 1 | 2 |
| East North Central | 3,185 | 2,348 | 1,591 | 555 | 146 | 24 | 1 | 6 | 25 | 797 | 674 | 42 | 81 | 19 | 6 | 15 |
| Iowa | 115 | 57 | 47 | 7 | 3 | 0 | 0 | 0 | 0 | 54 | 41 | 5 | 8 | 0 | 2 | 2 |
| Minnesota | 158 | 92 | 54 | 17 | 12 | 5 | 0 | 0 | 4 | 63 | 53 | 3 | 7 | 1 | 0 | 2 |
| Missouri | 442 | 342 | 248 | 64 | 19 | 8 | 0 | 0 | 3 | 96 | 77 | 5 | 14 | 2 | 0 | 2 |
| North Dakota | 20 | 6 | 4 | 2 | 0 | 0 | 0 | 0 | 0 | 14 | 10 | 0 | 4 | 0 | 0 | 0 |
| South Dakota | 14 | 6 | 5 | 1 | 0 | 0 | 0 | 0 | 0 | 8 | 7 | 0 | 1 | 0 | 0 | 0 |
| Nebraska | 42 | 28 | 21 | 5 | 2 | 0 | 0 | 0 | 0 | 13 | 11 | 1 | 1 | 0 | 0 | 1 |
| Kansas | 71 | 46 | 37 | 5 | 2 | 0 | 0 | 2 | 0 | 25 | 16 | 5 | 4 | 0 | 0 | 0 |
| West North Central | 862 | 577 | 416 | 101 | 38 | 13 | 0 | 2 | 7 | 273 | 215 | 19 | 39 | 3 | 2 | 7 |
| Delaware | 24 | 17 | 9 | 8 | 0 | 0 | 0 | 0 | 0 | 6 | 5 | 1 | 0 | 1 | 0 | 0 |
| Maryland | 199 | 137 | 84 | 44 | 5 | 2 | 0 | 1 | 1 | 58 | 47 | 4 | 7 | 3 | 1 | 0 |
| District of Columbia | 86 | 65 | 31 | 33 | 0 | 1 | 0 | 0 | 0 | 18 | 14 | 1 | 3 | 2 | 0 | 1 |
| Virginia | 106 | 75 | 60 | 15 | 0 | 0 | 0 | 0 | 0 | 26 | 26 | 0 | 0 | 0 | 4 | 1 |
| West Virginia | 110 | 79 | 47 | 15 | 11 | 1 | 2 | 2 | 1 | 31 | 28 | 0 | 3 | 0 | 0 | 0 |
| North Carolina | 115 | 84 | 78 | 6 | 0 | 0 | 2 | 0 | 0 | 30 | 27 | 0 | 3 | 0 | 0 | 1 |
| South Carolina | 63 | 49 | 43 | 6 | 0 | 0 | 0 | 0 | 0 | 14 | 13 | 0 | 1 | 0 | 0 | 0 |
| Georgia | 212 | 145 | 120 | 25 | 0 | 0 | 0 | 0 | 0 | 63 | 61 | 0 | 2 | 0 | 2 | 2 |
| Florida | 322 | 256 | 187 | 41 | 26 | 1 | 0 | 1 | 0 | 66 | 60 | 1 | 5 | 0 | 0 | 0 |
| South Atlantic | 1,237 | 907 | 659 | 193 | 42 | 5 | 2 | 4 | 2 | 312 | 281 | 7 | 24 | 6 | 7 | 5 |
| Kentucky | 222 | 148 | 102 | 28 | 10 | 2 | 2 | 0 | 4 | 70 | 67 | 0 | 3 | 2 | 1 | 1 |
| Tennessee | 235 | 176 | 143 | 23 | 7 | 1 | 0 | 0 | 2 | 56 | 47 | 4 | 5 | 0 | 1 | 2 |
| Alabama | 153 | 104 | 80 | 10 | 9 | 4 | 0 | 0 | 1 | 46 | 43 | 0 | 3 | 0 | 0 | 3 |
| Mississippi | 63 | 38 | 30 | 4 | 3 | 1 | 0 | 0 | 0 | 24 | 22 | 1 | 1 | 0 | 0 | 1 |
| East South Central | 673 | 466 | 355 | 65 | 29 | 8 | 2 | 0 | 7 | 196 | 179 | 5 | 12 | 2 | 2 | 7 |
| Arkansas | 85 | 53 | 46 | 4 | 3 | 0 | 0 | 0 | 0 | 32 | 25 | 1 | 6 | 0 | 0 | |
| Louisiana | 103 | 76 | 45 | 25 | 1 | 1 | 0 | 1 | 3 | 25 | 21 | 1 | 3 | 0 | 0 | 2 |
| Oklahoma | 85 | 55 | 44 | 6 | 4 | 1 | 0 | 0 | 0 | 30 | 17 | 6 | 7 | 0 | 0 | 0 |
| Texas | 453 | 326 | 241 | 69 | 9 | 4 | 0 | 1 | 2 | 118 | 96 | 9 | 13 | 0 | 1 | 8 |
| West South Central | 726 | 510 | 376 | 104 | 17 | 6 | 0 | 2 | 5 | 205 | 159 | 17 | 29 | 0 | 1 | 10 |
| Montana | 63 | 49 | 28 | 15 | 5 | 1 | 0 | 0 | 0 | 14 | 8 | 5 | 1 | 0 | 0 | 0 |
| Idaho | 43 | 31 | 25 | 4 | 2 | 0 | 0 | 0 | 0 | 12 | 8 | 1 | 3 | 0 | 0 | 0 |
| Wyoming | 20 | 13 | 9 | 1 | 1 | 0 | 0 | 0 | 2 | 6 | 4 | 1 | 1 | 0 | 0 | 1 |
| Colorado | 173 | 124 | 91 | 19 | 8 | 2 | 2 | 2 | 0 | 45 | 37 | 2 | 6 | 2 | 0 | 2 |
| New Mexico | 63 | 47 | 31 | 10 | 3 | 0 | 0 | 0 | 3 | 16 | 12 | 3 | 1 | 0 | 0 | 0 |
| Arizona | 179 | 138 | 91 | 30 | 15 | 1 | 0 | 0 | 1 | 41 | 27 | 8 | 6 | 0 | 0 | 0 |
| Utah | 28 | 12 | 7 | 2 | 2 | 0 | 0 | 0 | 1 | 16 | 14 | 2 | 0 | 0 | 0 | 0 |
| Nevada | 77 | 60 | 46 | 12 | 1 | 0 | 0 | 0 | 1 | 17 | 8 | 5 | 4 | 0 | 0 | 0 |
| Mountain | 646 | 474 | 328 | 93 | 37 | 4 | 2 | 2 | 8 | 167 | 118 | 27 | 22 | 2 | 0 | 3 |
| Washington | 347 | 225 | 157 | 41 | 18 | 6 | 1 | 1 | 1 | 107 | 69 | 15 | 23 | 6 | 0 | 9 |
| Oregon | 164 | 86 | 44 | 13 | 18 | 3 | 0 | 8 | 0 | 77 | 54 | 6 | 17 | 1 | 0 | 0 |
| California | 1,759 | 1,248 | 817 | 278 | 97 | 15 | 9 | 5 | 27 | 491 | 328 | 81 | 82 | 15 | 2 | 3 |
| Alaska | 75 | 53 | 34 | 12 | 5 | 1 | 0 | 0 | 1 | 22 | 18 | 1 | 3 | 0 | 0 | 0 |
| Hawaii | 74 | 39 | 33 | 2 | 3 | 0 | 0 | 0 | 1 | 35 | 33 | 0 | 2 | 0 | 0 | 0 |
| Guam | 0 | 0 | 0 | 0 | 0 | 0 | 0 | 0 | 0 | 0 | 0 | 0 | 0 | 0 | 0 | 0 |
| Pacific | 2,419 | 1,651 | 1,085 | 346 | 141 | 25 | 10 | 14 | 30 | 732 | 502 | 103 | 127 | 22 | 2 | 12 |
| Puerto Rico | 106 | 46 | 38 | 7 | 1 | 0 | 0 | 0 | 0 | 55 | 45 | 1 | 9 | 1 | 1 | 3 |
| Virgin Islands | 8 | 0 | 0 | 0 | 0 | 0 | 0 | 0 | 0 | 8 | 7 | 0 | 1 | 0 | 0 | 0 |
| Outlying Areas | 114 | 46 | 38 | 7 | 1 | 0 | 0 | 0 | 0 | 63 | 52 | 1 | 10 | 1 | 1 | 3 |
| Total, all States and areas | 13,011 | 9,200 | 6,223 | 2,106 | 559 | 128 | 29 | 36 | 119 | 3,628 | 2,955 | 261 | 412 | 79 | 25 | 79 |
- 1 See Glossary for definitions of terms
- 2 The States are grouped according to the method used by the Bureau of the Census, U.S Department of Commerce
757 of 759 figures sit in a row or column sum that works out. 4 cells break a sum: 'Rhode Island', column 11: prints 11, columns 12 to 14 add to 20; 'North Carolina', column 3: prints 84, columns 4 to 10 add to 86; 'New England', column 14: prints 8, rows 'Maine' to 'Connecticut' add to 17; 'South Atlantic', column 8: prints 2, rows 'Delaware' to 'Florida' add to 4.
Reader’s notes
p. 245. The crop ends in mid-table: "Virginia" is the last printed row and the glyph bottoms are slightly clipped by the crop edge (values still legible and internally consistent). The South Atlantic group that Delaware/Maryland/District of Columbia/Virginia belong to, all remaining divisions, the table's grand total and any footnote block printed under the table fall below the crop, so `footnotes` is empty even though the caption carries a raised 1 and the stub heading carries a raised 2. Doubtful cell: "Rhode Island", column RD. The glyph reads as 9 to me, but every other New England column reconciles exactly with its component states, and this one does not: the printed "New England" RD subtotal is 8 while 0+1+0+6+9+1 = 17. A value of 0 in that cell would make the column sum to the printed 8 exactly. I have transcribed the character as I see it (9) rather than correcting it; treat it as either a source misprint or a 0/9 confusion in the scan, and re-check it at higher magnification before use. Every other subtotal row verifies against its member states in all 16 numeric columns (New England, Middle Atlantic, East North Central, West North Central), and each state's "All cases" equals All C + All R + UD + AC + UC, so the column assignment is well anchored. Heading text repairs: the top-level headings were set hyphenated across lines and are joined here as "Union deauthorization cases", "Amendment of certification cases" and "Unit clarification cases". The scan renders "Unfair labor practice cases" with a damaged r ("laboi"); transcribed as "labor". A small stray ink speck sits between the Vermont CC and CD columns; it is not a digit and is ignored.
p. 246. This crop is a continuation page: the body begins mid-table with West Virginia and no column headings are printed, so header_rows is empty. The grid has 17 columns (stub + 16 numeric columns), counted from the column rules and confirmed by the 16 values in the "Total, all States and areas" line. Doubtful cell: the last (16th) numeric column of the "Arkansas" row appears blank in the print, where neighbouring rows carry an explicit 0; it is transcribed as "". Either reading is consistent with the printed West South Central subtotal of 10 (Louisiana 2 + Oklahoma 0 + Texas 8 = 10), so the subtotal cannot settle it. Wyoming, 3rd numeric column: the glyph is broken/inked-over and reads ambiguously; it is transcribed as 9, which is what the printed Mountain subtotal of 328 requires (28+25+9+91+31+91+7+46 = 328). Verification: every column of the East South Central, West South Central, Mountain, Pacific and Outlying Areas subtotal lines reconciles exactly with the state rows printed above it, which confirms both the values and the column each one sits in. The South Atlantic subtotal cannot be checked because its first four States (Delaware, Maryland, District of Columbia, Virginia) fall on the preceding page, outside this crop. No arithmetic was performed on or applied to any cell; all values are as printed. The footnote markers 1 and 2 are printed as raised digits under the table; the footnote texts end without periods and read "U.S" without the second period, transcribed as printed.
Source image
Source data: U.S. NLRB Annual Reports (public domain). Reconstruction by NLRB Stats Archive. Read by claude-opus-5 (effort max, prompt extract_v1) from the 300-dpi scan; stitched by page. Updated October 2026.