NLRB Stats Archive › Annual Reports › FY1976 › Proceedings Decided by Circuit Courts of Appeals on Petitions for Enforcement and/or Review of Board Orders, Fiscal Year 1976, Compared With 5-Year Cumulative Totals, Fiscal Years 1971 Through 1975
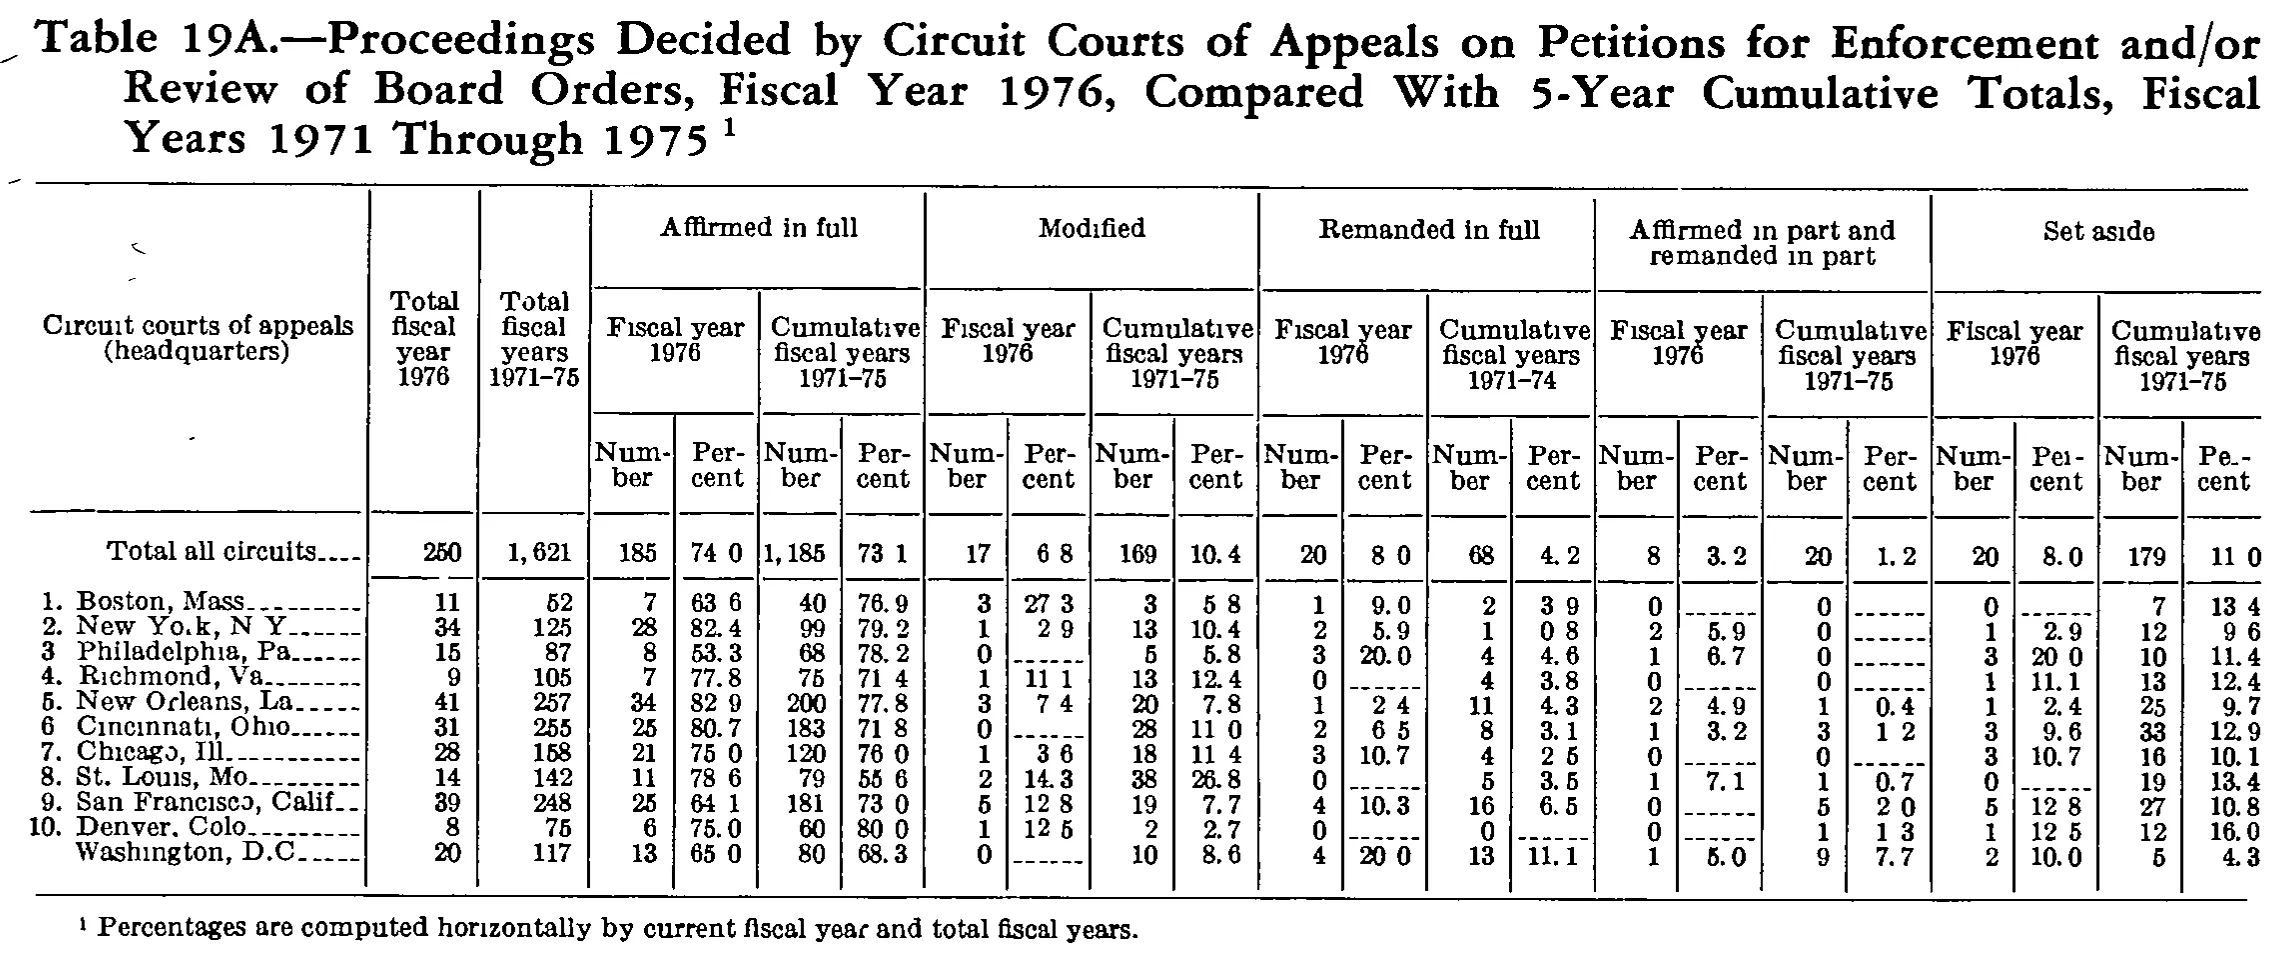
Proceedings Decided by Circuit Courts of Appeals on Petitions for Enforcement and/or Review of Board Orders, Fiscal Year 1976, Compared With 5-Year Cumulative Totals, Fiscal Years 1971 Through 1975
| Circuit courts of appeals (headquarters) | Total fiscal year 1976 | Total fiscal years 1971-75 | Affirmed in full | Modified | Remanded in full | Affirmed in part and remanded in part | Set aside | |||||||||||||||
|---|---|---|---|---|---|---|---|---|---|---|---|---|---|---|---|---|---|---|---|---|---|---|
| Circuit courts of appeals (headquarters) | Total fiscal year 1976 | Total fiscal years 1971-75 | Fiscal year 1976 | Cumulative fiscal years 1971-75 | Fiscal year 1976 | Cumulative fiscal years 1971-75 | Fiscal year 1976 | Cumulative fiscal years 1971-74 | Fiscal year 1976 | Cumulative fiscal years 1971-75 | Fiscal year 1976 | Cumulative fiscal years 1971-75 | ||||||||||
| Circuit courts of appeals (headquarters) | Total fiscal year 1976 | Total fiscal years 1971-75 | Number | Percent | Number | Percent | Number | Percent | Number | Percent | Number | Percent | Number | Percent | Number | Percent | Number | Percent | Number | Percent | Number | Percent |
| Total all circuits | 250 | 1,621 | 185 | 74.0 | 1,185 | 73.1 | 17 | 6.8 | 169 | 10.4 | 20 | 8.0 | 68 | 4.2 | 8 | 3.2 | 20 | 1.2 | 20 | 8.0 | 179 | 11.0 |
| 1. Boston, Mass. | 11 | 52 | 7 | 63.6 | 40 | 76.9 | 3 | 27.3 | 3 | 5.8 | 1 | 9.0 | 2 | 3.9 | 0 | 0 | 0 | 7 | 13.4 | |||
| 2. New York, N.Y. | 34 | 125 | 28 | 82.4 | 99 | 79.2 | 1 | 2.9 | 13 | 10.4 | 2 | 5.9 | 1 | 0.8 | 2 | 5.9 | 0 | 1 | 2.9 | 12 | 9.6 | |
| 3. Philadelphia, Pa. | 15 | 87 | 8 | 53.3 | 68 | 78.2 | 0 | 5 | 5.8 | 3 | 20.0 | 4 | 4.6 | 1 | 6.7 | 0 | 3 | 20.0 | 10 | 11.4 | ||
| 4. Richmond, Va. | 9 | 105 | 7 | 77.8 | 75 | 71.4 | 1 | 11.1 | 13 | 12.4 | 0 | 4 | 3.8 | 0 | 0 | 1 | 11.1 | 13 | 12.4 | |||
| 5. New Orleans, La. | 41 | 257 | 34 | 82.9 | 200 | 77.8 | 3 | 7.4 | 20 | 7.8 | 1 | 2.4 | 11 | 4.3 | 2 | 4.9 | 1 | 0.4 | 1 | 2.4 | 25 | 9.7 |
| 6. Cincinnati, Ohio | 31 | 255 | 25 | 80.7 | 183 | 71.8 | 0 | 28 | 11.0 | 2 | 6.5 | 8 | 3.1 | 1 | 3.2 | 3 | 1.2 | 3 | 9.6 | 33 | 12.9 | |
| 7. Chicago, Ill. | 28 | 158 | 21 | 75.0 | 120 | 76.0 | 1 | 3.6 | 18 | 11.4 | 3 | 10.7 | 4 | 2.5 | 0 | 0 | 3 | 10.7 | 16 | 10.1 | ||
| 8. St. Louis, Mo. | 14 | 142 | 11 | 78.6 | 79 | 55.6 | 2 | 14.3 | 38 | 26.8 | 0 | 5 | 3.5 | 1 | 7.1 | 1 | 0.7 | 0 | 19 | 13.4 | ||
| 9. San Francisco, Calif. | 39 | 248 | 25 | 64.1 | 181 | 73.0 | 5 | 12.8 | 19 | 7.7 | 4 | 10.3 | 16 | 6.5 | 0 | 5 | 2.0 | 5 | 12.8 | 27 | 10.8 | |
| 10. Denver, Colo. | 8 | 75 | 6 | 75.0 | 60 | 80.0 | 1 | 12.5 | 2 | 2.7 | 0 | 0 | 0 | 1 | 1.3 | 1 | 12.5 | 12 | 16.0 | |||
| Washington, D.C. | 20 | 117 | 13 | 65.0 | 80 | 68.3 | 0 | 10 | 8.6 | 4 | 20.0 | 13 | 11.1 | 1 | 5.0 | 9 | 7.7 | 2 | 10.0 | 5 | 4.3 | |
- 1 Percentages are computed horizontally by current fiscal year and total fiscal years.
125 of 125 figures sit in a row or column sum that works out.
Reader’s notes
p. 266. Suspected misprint in the headings: the cumulative sub-heading under "Remanded in full" is printed as "Cumulative fiscal years 1971-74", while the corresponding sub-heading in all four other outcome groups (and the second stub-total column) reads "1971-75". Transcribed as printed; the column's values sum to the 1,621-case 1971-75 base, so the "1971-74" is almost certainly a typographical error. Decimal points: this is a 1-bit scan in which many decimal points in the percent columns are faint or dropped (e.g. "74 0", "63 6", "11 1"). I have written them as decimal points throughout, since every such value is a one-decimal percentage and each one reproduces the corresponding Number/Total ratio exactly. Percent cells printed as a dash rule ("------") are rendered as "". These occur only where the matching Number cell is 0. One exception: the Denver, Colo. row has 0 in the "Remanded in full / Cumulative" Number column with a genuinely blank (not dashed) Percent cell beside it; it is transcribed as "". Row-label numbering: the sequence numbers for Philadelphia (3) and Cincinnati (6) have no clearly visible period in the scan, where the other circuits do; I have written periods on all of them for consistency, as the difference is almost certainly scan dropout. Trailing abbreviation periods (Mass., Pa., Va., La., Ill., Mo., Calif., Colo.) run into the leader dots and are likewise reconstructed in the standard form. The final row, Washington, D.C., carries no sequence number, as printed. Arithmetic check (no values were altered): every circuit row's five outcome Numbers sum to its stated fiscal year 1976 total and to its stated 1971-75 cumulative total, and each of the twelve numeric columns sums to the "Total all circuits" line. No internal inconsistency was found.
Source image
Source data: U.S. NLRB Annual Reports (public domain). Reconstruction by NLRB Stats Archive. Read by claude-opus-5 (effort max, prompt extract_v1) from the 300-dpi scan; stitched by page. Updated October 2026.