NLRB Stats Archive › Annual Reports › FY1976 › Distribution of Unfair Labor Practice Situations Received, by Number of Employees in Establishments, Fiscal Year 1976
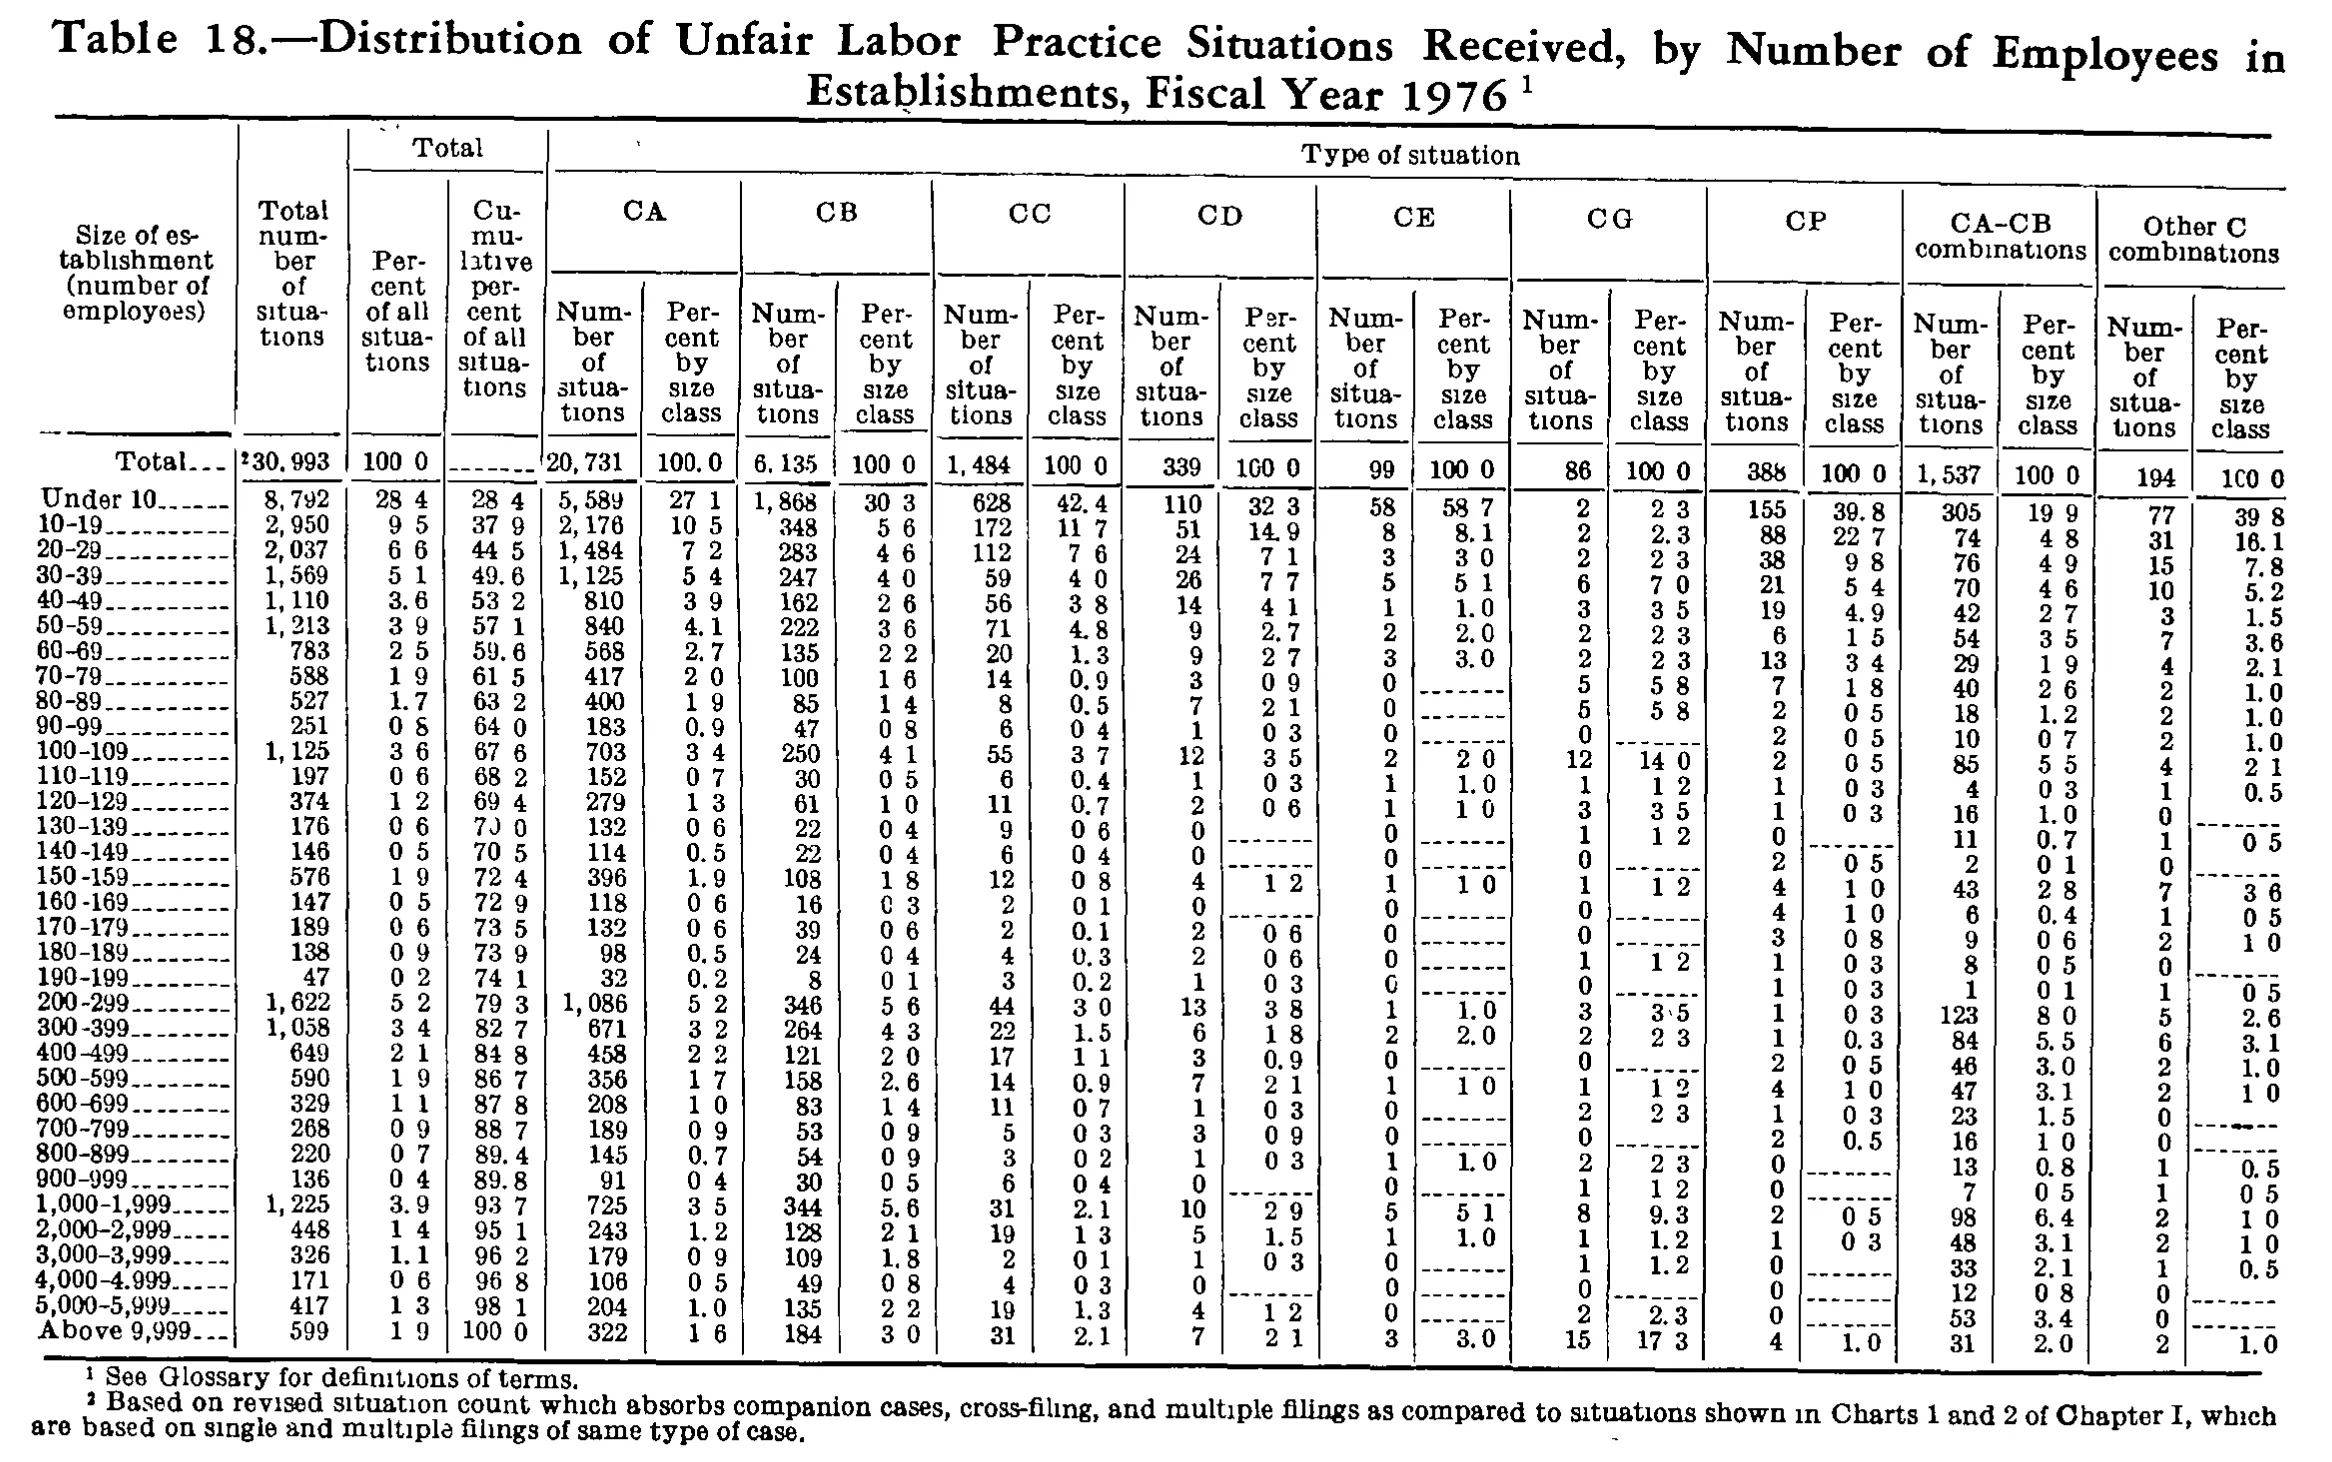
Distribution of Unfair Labor Practice Situations Received, by Number of Employees in Establishments, Fiscal Year 1976
| Size of establishment (number of employees) | Total number of situations | Total | Type of situation | ||||||||||||||||||
|---|---|---|---|---|---|---|---|---|---|---|---|---|---|---|---|---|---|---|---|---|---|
| Size of establishment (number of employees) | Total number of situations | Percent of all situations | Cumulative percent of all situations | CA | CB | CC | CD | CE | CG | CP | CA-CB combinations | Other C combinations | |||||||||
| Size of establishment (number of employees) | Total number of situations | Percent of all situations | Cumulative percent of all situations | Number of situations | Percent by size class | Number of situations | Percent by size class | Number of situations | Percent by size class | Number of situations | Percent by size class | Number of situations | Percent by size class | Number of situations | Percent by size class | Number of situations | Percent by size class | Number of situations | Percent by size class | Number of situations | Percent by size class |
| Total | 30,993 | 100.0 | 20,731 | 100.0 | 6,135 | 100.0 | 1,484 | 100.0 | 339 | 100.0 | 99 | 100.0 | 86 | 100.0 | 388 | 100.0 | 1,537 | 100.0 | 194 | 100.0 | |
| Under 10 | 8,792 | 28.4 | 28.4 | 5,589 | 27.1 | 1,868 | 30.3 | 628 | 42.4 | 110 | 32.3 | 58 | 58.7 | 2 | 2.3 | 155 | 39.8 | 305 | 19.9 | 77 | 39.8 |
| 10-19 | 2,950 | 9.5 | 37.9 | 2,176 | 10.5 | 348 | 5.6 | 172 | 11.7 | 51 | 14.9 | 8 | 8.1 | 2 | 2.3 | 88 | 22.7 | 74 | 4.8 | 31 | 16.1 |
| 20-29 | 2,037 | 6.6 | 44.5 | 1,484 | 7.2 | 283 | 4.6 | 112 | 7.6 | 24 | 7.1 | 3 | 3.0 | 2 | 2.3 | 38 | 9.8 | 76 | 4.9 | 15 | 7.8 |
| 30-39 | 1,569 | 5.1 | 49.6 | 1,125 | 5.4 | 247 | 4.0 | 59 | 4.0 | 26 | 7.7 | 5 | 5.1 | 6 | 7.0 | 21 | 5.4 | 70 | 4.6 | 10 | 5.2 |
| 40-49 | 1,110 | 3.6 | 53.2 | 810 | 3.9 | 162 | 2.6 | 56 | 3.8 | 14 | 4.1 | 1 | 1.0 | 3 | 3.5 | 19 | 4.9 | 42 | 2.7 | 3 | 1.5 |
| 50-59 | 1,213 | 3.9 | 57.1 | 840 | 4.1 | 222 | 3.6 | 71 | 4.8 | 9 | 2.7 | 2 | 2.0 | 2 | 2.3 | 6 | 1.5 | 54 | 3.5 | 7 | 3.6 |
| 60-69 | 783 | 2.5 | 59.6 | 568 | 2.7 | 135 | 2.2 | 20 | 1.3 | 9 | 2.7 | 3 | 3.0 | 2 | 2.3 | 13 | 3.4 | 29 | 1.9 | 4 | 2.1 |
| 70-79 | 588 | 1.9 | 61.5 | 417 | 2.0 | 100 | 1.6 | 14 | 0.9 | 3 | 0.9 | 0 | 5 | 5.8 | 7 | 1.8 | 40 | 2.6 | 2 | 1.0 | |
| 80-89 | 527 | 1.7 | 63.2 | 400 | 1.9 | 85 | 1.4 | 8 | 0.5 | 7 | 2.1 | 0 | 5 | 5.8 | 2 | 0.5 | 18 | 1.2 | 2 | 1.0 | |
| 90-99 | 251 | 0.8 | 64.0 | 183 | 0.9 | 47 | 0.8 | 6 | 0.4 | 1 | 0.3 | 0 | 0 | 2 | 0.5 | 10 | 0.7 | 2 | 1.0 | ||
| 100-109 | 1,125 | 3.6 | 67.6 | 703 | 3.4 | 250 | 4.1 | 55 | 3.7 | 12 | 3.5 | 2 | 2.0 | 12 | 14.0 | 2 | 0.5 | 85 | 5.5 | 4 | 2.1 |
| 110-119 | 197 | 0.6 | 68.2 | 152 | 0.7 | 30 | 0.5 | 6 | 0.4 | 1 | 0.3 | 1 | 1.0 | 1 | 1.2 | 1 | 0.3 | 4 | 0.3 | 1 | 0.5 |
| 120-129 | 374 | 1.2 | 69.4 | 279 | 1.3 | 61 | 1.0 | 11 | 0.7 | 2 | 0.6 | 1 | 1.0 | 3 | 3.5 | 1 | 0.3 | 16 | 1.0 | 0 | |
| 130-139 | 176 | 0.6 | 70.0 | 132 | 0.6 | 22 | 0.4 | 9 | 0.6 | 0 | 0 | 1 | 1.2 | 0 | 11 | 0.7 | 1 | 0.5 | |||
| 140-149 | 146 | 0.5 | 70.5 | 114 | 0.5 | 22 | 0.4 | 6 | 0.4 | 0 | 0 | 0 | 2 | 0.5 | 2 | 0.1 | 0 | ||||
| 150-159 | 576 | 1.9 | 72.4 | 396 | 1.9 | 108 | 1.8 | 12 | 0.8 | 4 | 1.2 | 1 | 1.0 | 1 | 1.2 | 4 | 1.0 | 43 | 2.8 | 7 | 3.6 |
| 160-169 | 147 | 0.5 | 72.9 | 118 | 0.6 | 16 | 0.3 | 2 | 0.1 | 0 | 0 | 0 | 4 | 1.0 | 6 | 0.4 | 1 | 0.5 | |||
| 170-179 | 189 | 0.6 | 73.5 | 132 | 0.6 | 39 | 0.6 | 2 | 0.1 | 2 | 0.6 | 0 | 0 | 3 | 0.8 | 9 | 0.6 | 2 | 1.0 | ||
| 180-189 | 138 | 0.9 | 73.9 | 98 | 0.5 | 24 | 0.4 | 4 | 0.3 | 2 | 0.6 | 0 | 1 | 1.2 | 1 | 0.3 | 8 | 0.5 | 0 | ||
| 190-199 | 47 | 0.2 | 74.1 | 32 | 0.2 | 8 | 0.1 | 3 | 0.2 | 1 | 0.3 | 0 | 0 | 1 | 0.3 | 1 | 0.1 | 1 | 0.5 | ||
| 200-299 | 1,622 | 5.2 | 79.3 | 1,086 | 5.2 | 346 | 5.6 | 44 | 3.0 | 13 | 3.8 | 1 | 1.0 | 3 | 3.5 | 1 | 0.3 | 123 | 8.0 | 5 | 2.6 |
| 300-399 | 1,058 | 3.4 | 82.7 | 671 | 3.2 | 264 | 4.3 | 22 | 1.5 | 6 | 1.8 | 2 | 2.0 | 2 | 2.3 | 1 | 0.3 | 84 | 5.5 | 6 | 3.1 |
| 400-499 | 649 | 2.1 | 84.8 | 458 | 2.2 | 121 | 2.0 | 17 | 1.1 | 3 | 0.9 | 0 | 0 | 2 | 0.5 | 46 | 3.0 | 2 | 1.0 | ||
| 500-599 | 590 | 1.9 | 86.7 | 356 | 1.7 | 158 | 2.6 | 14 | 0.9 | 7 | 2.1 | 1 | 1.0 | 1 | 1.2 | 4 | 1.0 | 47 | 3.1 | 2 | 1.0 |
| 600-699 | 329 | 1.1 | 87.8 | 208 | 1.0 | 83 | 1.4 | 11 | 0.7 | 1 | 0.3 | 0 | 2 | 2.3 | 1 | 0.3 | 23 | 1.5 | 0 | ||
| 700-799 | 268 | 0.9 | 88.7 | 189 | 0.9 | 53 | 0.9 | 5 | 0.3 | 3 | 0.9 | 0 | 0 | 2 | 0.5 | 16 | 1.0 | 0 | |||
| 800-899 | 220 | 0.7 | 89.4 | 145 | 0.7 | 54 | 0.9 | 3 | 0.2 | 1 | 0.3 | 1 | 1.0 | 2 | 2.3 | 0 | 13 | 0.8 | 1 | 0.5 | |
| 900-999 | 136 | 0.4 | 89.8 | 91 | 0.4 | 30 | 0.5 | 6 | 0.4 | 0 | 0 | 1 | 1.2 | 0 | 7 | 0.5 | 1 | 0.5 | |||
| 1,000-1,999 | 1,225 | 3.9 | 93.7 | 725 | 3.5 | 344 | 5.6 | 31 | 2.1 | 10 | 2.9 | 5 | 5.1 | 8 | 9.3 | 2 | 0.5 | 98 | 6.4 | 2 | 1.0 |
| 2,000-2,999 | 448 | 1.4 | 95.1 | 243 | 1.2 | 128 | 2.1 | 19 | 1.3 | 5 | 1.5 | 1 | 1.0 | 1 | 1.2 | 1 | 0.3 | 48 | 3.1 | 2 | 1.0 |
| 3,000-3,999 | 326 | 1.1 | 96.2 | 179 | 0.9 | 109 | 1.8 | 2 | 0.1 | 1 | 0.3 | 0 | 1 | 1.2 | 0 | 33 | 2.1 | 1 | 0.5 | ||
| 4,000-4,999 | 171 | 0.6 | 96.8 | 106 | 0.5 | 49 | 0.8 | 4 | 0.3 | 0 | 0 | 0 | 0 | 12 | 0.8 | 0 | |||||
| 5,000-5,999 | 417 | 1.3 | 98.1 | 204 | 1.0 | 135 | 2.2 | 19 | 1.3 | 4 | 1.2 | 0 | 2 | 2.3 | 0 | 53 | 3.4 | 0 | |||
| Above 9,999 | 599 | 1.9 | 100.0 | 322 | 1.6 | 184 | 3.0 | 31 | 2.1 | 7 | 2.1 | 3 | 3.0 | 15 | 17.3 | 4 | 1.0 | 31 | 2.0 | 2 | 1.0 |
- 1 See Glossary for definitions of terms.
- 2 Based on revised situation count which absorbs companion cases, cross-filing, and multiple filings as compared to situations shown in Charts 1 and 2 of Chapter I, which are based on single and multiple filings of same type of case.
308 of 308 figures sit in a row or column sum that works out.
Reader’s notes
p. 264. 22 columns: stub, "Total number of situations", two columns under the "Total" spanner, and nine two-column "Type of situation" panels (CA, CB, CC, CD, CE, CG, CP, CA-CB combinations, Other C combinations). Verification: every one of the 34 body rows sums across the nine type columns to its printed total-situations figure, and the total column plus all nine type-number columns sum exactly to their printed column totals (30,993; 20,731; 6,135; 1,484; 339; 99; 86; 388; 1,537; 194). That confirms the row/column alignment throughout, which matters here because the rightmost columns (notably "Other C combinations — Percent by size class" and, in the last two rows, the CP and Other C percents) are printed with a slight downward baseline drift relative to the rest of each line. Decimal points: the scan drops most decimal points, so many cells appear as e.g. "28 4", "100 0", "7) 0". These are decimals in the original typesetting and are transcribed as "28.4", "100.0", "70.0". No value was otherwise altered. Doubtful cells: - CG "Number of situations", row 5,000-5,999: the glyph is unclear at this resolution and looks like "0", but the printed percent beside it is 2.3, the row sums to 417 only with 2, and the column sums to the printed 86 only with 2. Transcribed as "2". - "Percent of all situations", row 180-189: printed "0.9", but 138/30,993 = 0.4 and the cumulative column runs 73.5 -> 73.9, which implies 0.4. Transcribed as printed; likely a misprint in the source. - Row label "5,000-5,999": reads that way on the page, but it leaves no class covering 6,000-9,999 even though every column cross-foots exactly to its printed total (so no row is missing from the crop). Possibly a misprint for "5,000-9,999". - The leading "2" on the total-situations grand total is the raised footnote marker, recorded as "30,993^2". The caption also carries a raised "1", but the caption is excluded. - Several printed percents differ by 0.1 from the recomputed value, mostly in the first rows of a column (e.g. CA "Under 10" 27.1 vs 27.0; CB "Under 10" 30.3 vs 30.4; CP "Under 10" 39.8 vs 40.0). All transcribed as printed. - Cells holding a dash rule and cells left blank are both rendered "". A few 0-count rows show a blank rather than a dash (e.g. CE and CG at 90-99), with no difference in the output.
Source image
Source data: U.S. NLRB Annual Reports (public domain). Reconstruction by NLRB Stats Archive. Read by claude-opus-5 (effort max, prompt extract_v1) from the 300-dpi scan; stitched by page. Updated October 2026.