NLRB Stats Archive › Annual Reports › FY1976 › Size of Units in Representation Election Cases Closed, Fiscal Year 1976
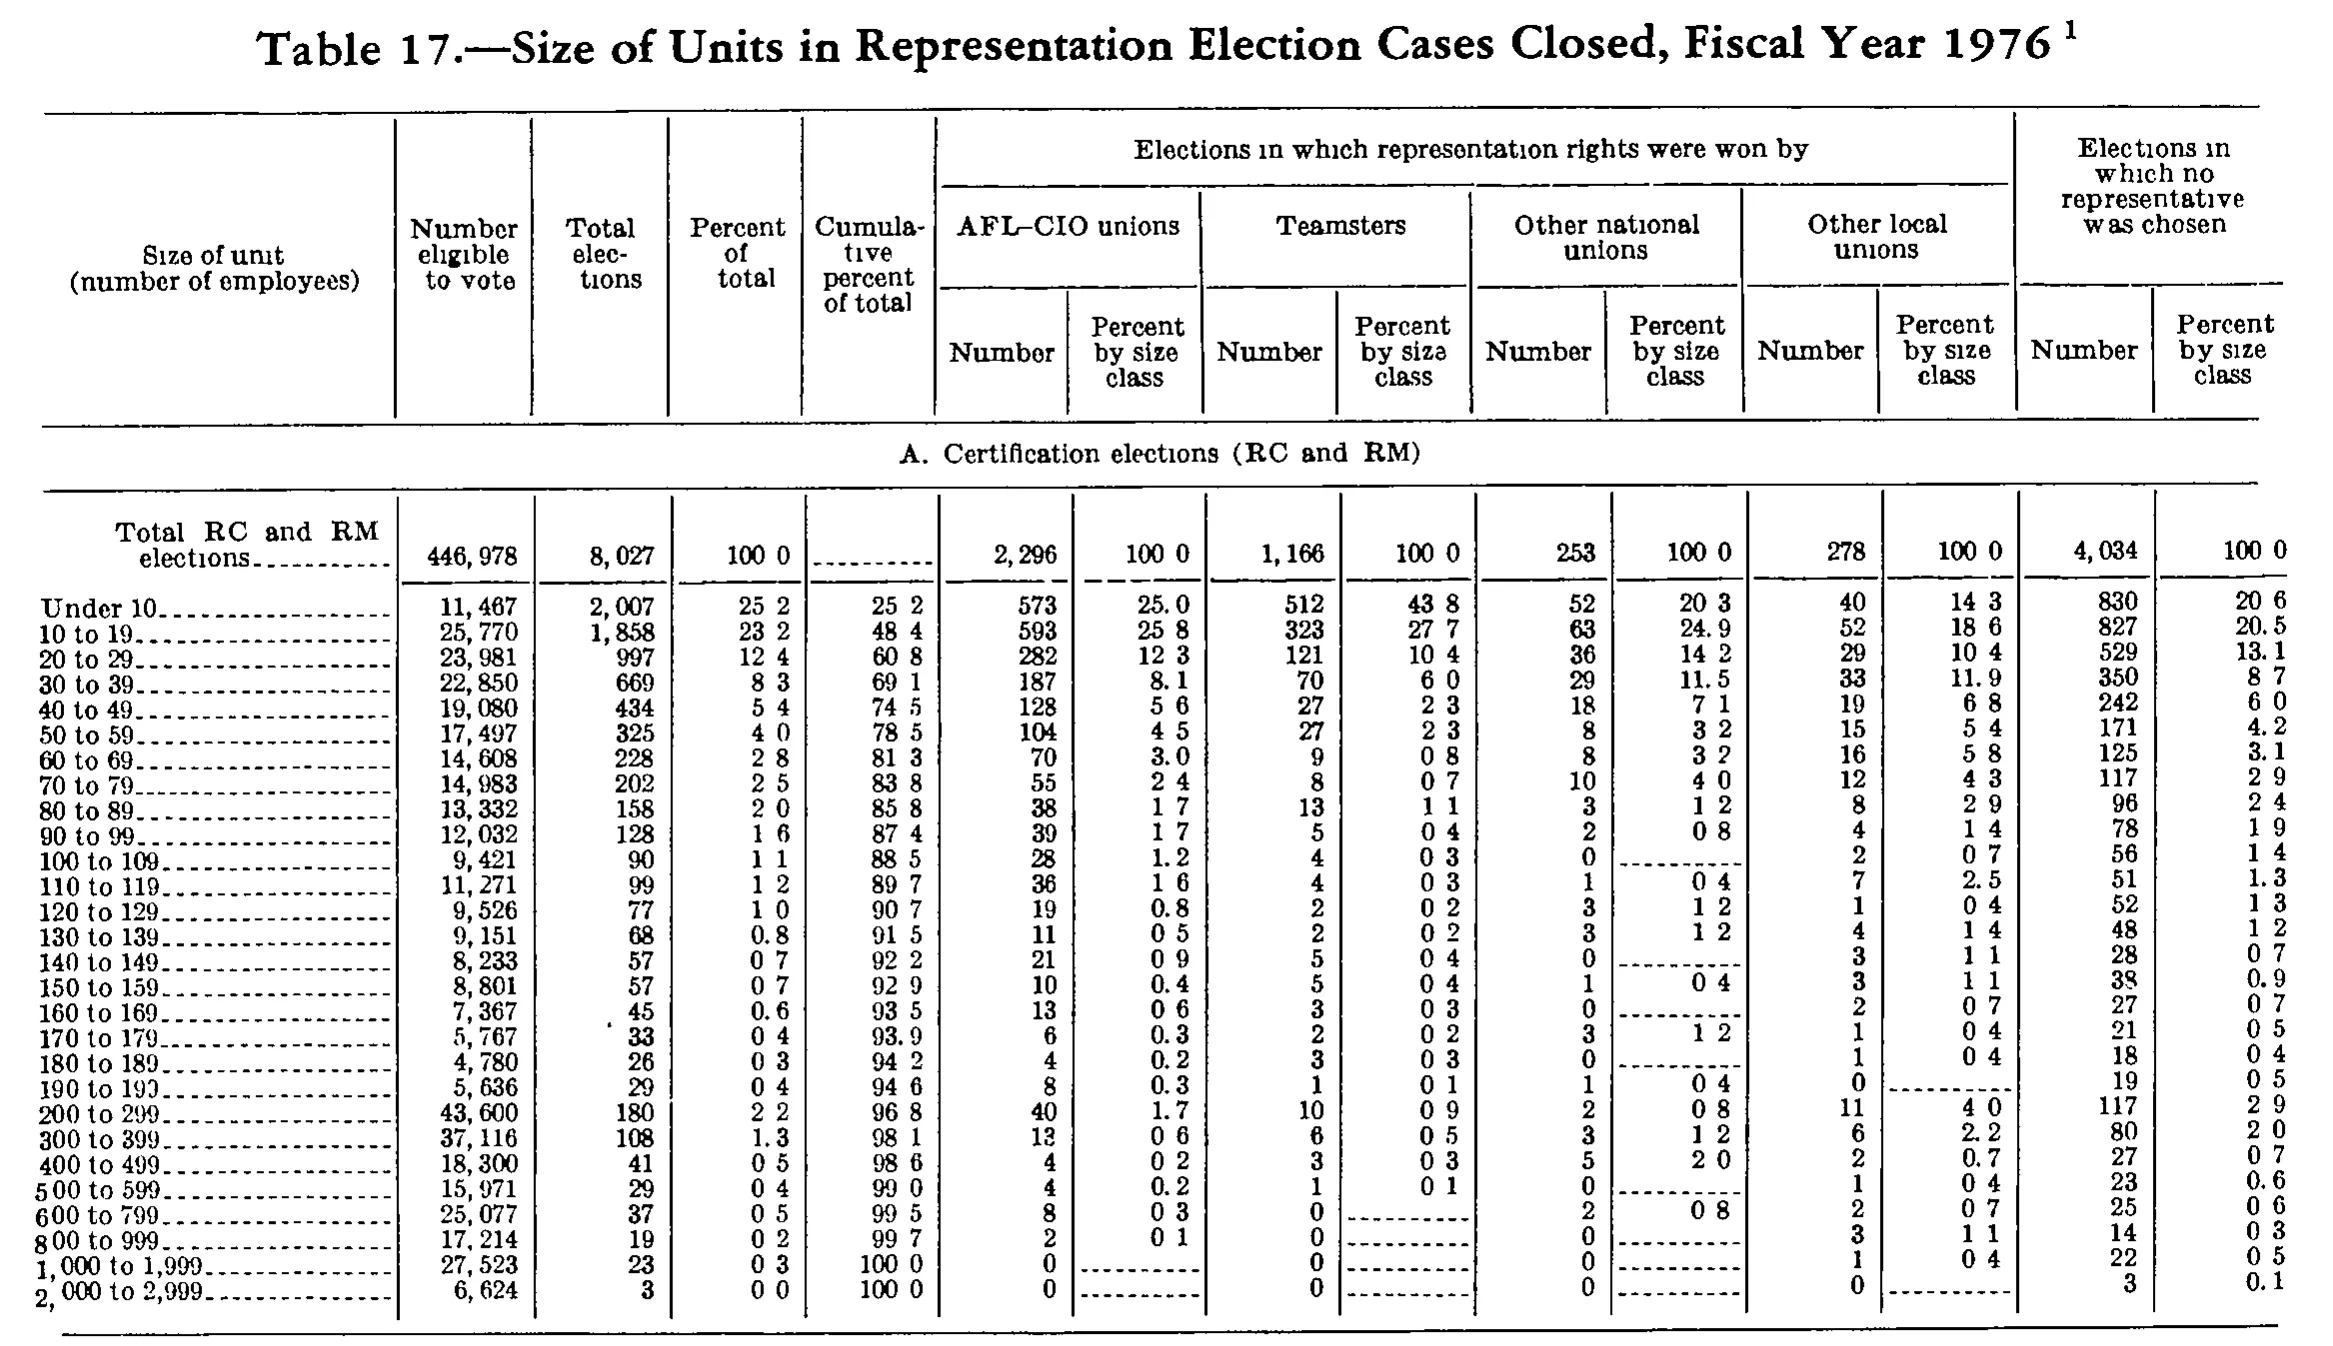
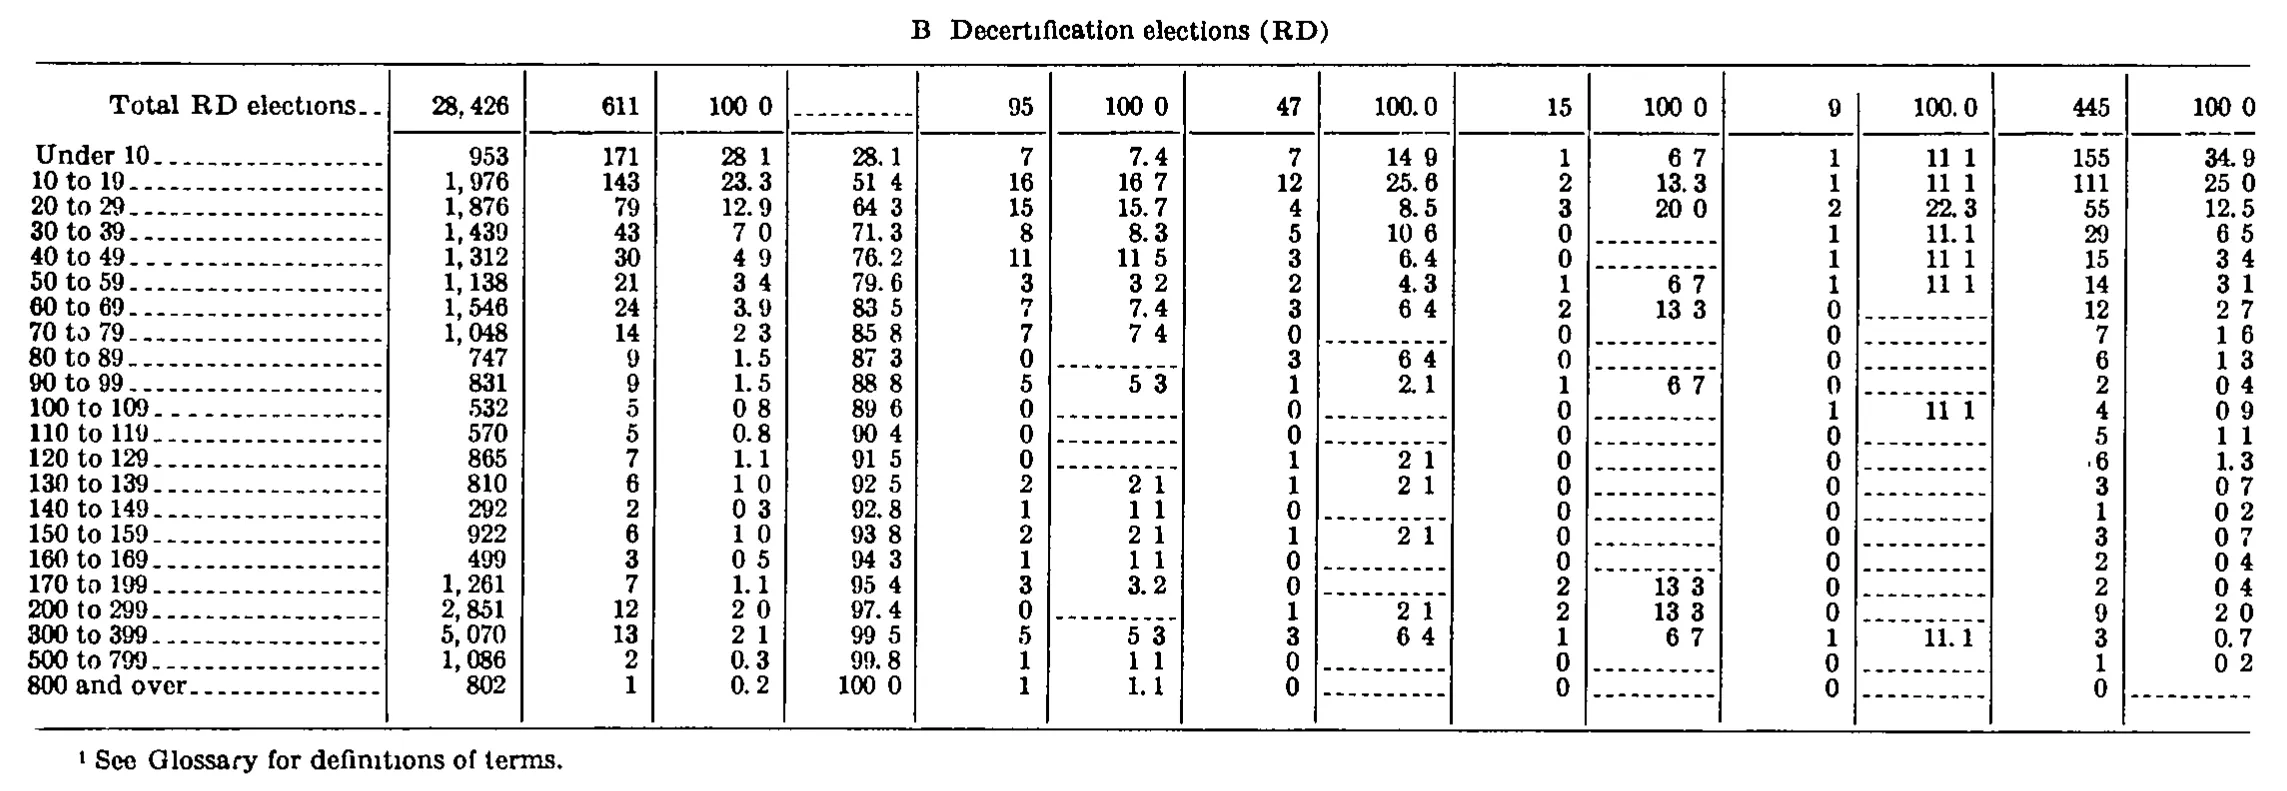
Size of Units in Representation Election Cases Closed, Fiscal Year 1976
Stitched from pp. 262–263.
| Size of unit (number of employees) | Number eligible to vote | Total elections | Percent of total | Cumulative percent of total | Elections in which representation rights were won by | Elections in which no representative was chosen | ||||||||
|---|---|---|---|---|---|---|---|---|---|---|---|---|---|---|
| Size of unit (number of employees) | Number eligible to vote | Total elections | Percent of total | Cumulative percent of total | AFL-CIO unions | Teamsters | Other national unions | Other local unions | Elections in which no representative was chosen | |||||
| Size of unit (number of employees) | Number eligible to vote | Total elections | Percent of total | Cumulative percent of total | Number | Percent by size class | Number | Percent by size class | Number | Percent by size class | Number | Percent by size class | Number | Percent by size class |
| A. Certification elections (RC and RM) | ||||||||||||||
| Total RC and RM elections | 446,978 | 8,027 | 100.0 | 2,296 | 100.0 | 1,166 | 100.0 | 253 | 100.0 | 278 | 100.0 | 4,034 | 100.0 | |
| Under 10 | 11,467 | 2,007 | 25.2 | 25.2 | 573 | 25.0 | 512 | 43.8 | 52 | 20.3 | 40 | 14.3 | 830 | 20.6 |
| 10 to 19 | 25,770 | 1,858 | 23.2 | 48.4 | 593 | 25.8 | 323 | 27.7 | 63 | 24.9 | 52 | 18.6 | 827 | 20.5 |
| 20 to 29 | 23,981 | 997 | 12.4 | 60.8 | 282 | 12.3 | 121 | 10.4 | 36 | 14.2 | 29 | 10.4 | 529 | 13.1 |
| 30 to 39 | 22,850 | 669 | 8.3 | 69.1 | 187 | 8.1 | 70 | 6.0 | 29 | 11.5 | 33 | 11.9 | 350 | 8.7 |
| 40 to 49 | 19,080 | 434 | 5.4 | 74.5 | 128 | 5.6 | 27 | 2.3 | 18 | 7.1 | 19 | 6.8 | 242 | 6.0 |
| 50 to 59 | 17,497 | 325 | 4.0 | 78.5 | 104 | 4.5 | 27 | 2.3 | 8 | 3.2 | 15 | 5.4 | 171 | 4.2 |
| 60 to 69 | 14,608 | 228 | 2.8 | 81.3 | 70 | 3.0 | 9 | 0.8 | 8 | 3.2 | 16 | 5.8 | 125 | 3.1 |
| 70 to 79 | 14,983 | 202 | 2.5 | 83.8 | 55 | 2.4 | 8 | 0.7 | 10 | 4.0 | 12 | 4.3 | 117 | 2.9 |
| 80 to 89 | 13,332 | 158 | 2.0 | 85.8 | 38 | 1.7 | 13 | 1.1 | 3 | 1.2 | 8 | 2.9 | 96 | 2.4 |
| 90 to 99 | 12,032 | 128 | 1.6 | 87.4 | 39 | 1.7 | 5 | 0.4 | 2 | 0.8 | 4 | 1.4 | 78 | 1.9 |
| 100 to 109 | 9,421 | 90 | 1.1 | 88.5 | 28 | 1.2 | 4 | 0.3 | 0 | 2 | 0.7 | 56 | 1.4 | |
| 110 to 119 | 11,271 | 99 | 1.2 | 89.7 | 36 | 1.6 | 4 | 0.3 | 1 | 0.4 | 7 | 2.5 | 51 | 1.3 |
| 120 to 129 | 9,526 | 77 | 1.0 | 90.7 | 19 | 0.8 | 2 | 0.2 | 3 | 1.2 | 1 | 0.4 | 52 | 1.3 |
| 130 to 139 | 9,151 | 68 | 0.8 | 91.5 | 11 | 0.5 | 2 | 0.2 | 3 | 1.2 | 4 | 1.4 | 48 | 1.2 |
| 140 to 149 | 8,233 | 57 | 0.7 | 92.2 | 21 | 0.9 | 5 | 0.4 | 0 | 3 | 1.1 | 28 | 0.7 | |
| 150 to 159 | 8,801 | 57 | 0.7 | 92.9 | 10 | 0.4 | 5 | 0.4 | 1 | 0.4 | 3 | 1.1 | 38 | 0.9 |
| 160 to 169 | 7,367 | 45 | 0.6 | 93.5 | 13 | 0.6 | 3 | 0.3 | 0 | 2 | 0.7 | 27 | 0.7 | |
| 170 to 179 | 5,767 | 33 | 0.4 | 93.9 | 6 | 0.3 | 2 | 0.2 | 3 | 1.2 | 1 | 0.4 | 21 | 0.5 |
| 180 to 189 | 4,780 | 26 | 0.3 | 94.2 | 4 | 0.2 | 3 | 0.3 | 0 | 1 | 0.4 | 18 | 0.4 | |
| 190 to 199 | 5,636 | 29 | 0.4 | 94.6 | 8 | 0.3 | 1 | 0.1 | 1 | 0.4 | 0 | 19 | 0.5 | |
| 200 to 299 | 43,600 | 180 | 2.2 | 96.8 | 40 | 1.7 | 10 | 0.9 | 2 | 0.8 | 11 | 4.0 | 117 | 2.9 |
| 300 to 399 | 37,116 | 108 | 1.3 | 98.1 | 13 | 0.6 | 6 | 0.5 | 3 | 1.2 | 6 | 2.2 | 80 | 2.0 |
| 400 to 499 | 18,300 | 41 | 0.5 | 98.6 | 4 | 0.2 | 3 | 0.3 | 5 | 2.0 | 2 | 0.7 | 27 | 0.7 |
| 500 to 599 | 15,971 | 29 | 0.4 | 99.0 | 4 | 0.2 | 1 | 0.1 | 0 | 1 | 0.4 | 23 | 0.6 | |
| 600 to 799 | 25,077 | 37 | 0.5 | 99.5 | 8 | 0.3 | 0 | 2 | 0.8 | 2 | 0.7 | 25 | 0.6 | |
| 800 to 999 | 17,214 | 19 | 0.2 | 99.7 | 2 | 0.1 | 0 | 0 | 3 | 1.1 | 14 | 0.3 | ||
| 1,000 to 1,999 | 27,523 | 23 | 0.3 | 100.0 | 0 | 0 | 0 | 1 | 0.4 | 22 | 0.5 | |||
| 2,000 to 2,999 | 6,624 | 3 | 0.0 | 100.0 | 0 | 0 | 0 | 0 | 3 | 0.1 | ||||
| B. Decertification elections (RD) | ||||||||||||||
| Total RD elections | 28,426 | 611 | 100.0 | 95 | 100.0 | 47 | 100.0 | 15 | 100.0 | 9 | 100.0 | 445 | 100.0 | |
| Under 10 | 953 | 171 | 28.1 | 28.1 | 7 | 7.4 | 7 | 14.9 | 1 | 6.7 | 1 | 11.1 | 155 | 34.9 |
| 10 to 19 | 1,976 | 143 | 23.3 | 51.4 | 16 | 16.7 | 12 | 25.6 | 2 | 13.3 | 1 | 11.1 | 111 | 25.0 |
| 20 to 29 | 1,876 | 79 | 12.9 | 64.3 | 15 | 15.7 | 4 | 8.5 | 3 | 20.0 | 2 | 22.3 | 55 | 12.5 |
| 30 to 39 | 1,439 | 43 | 7.0 | 71.3 | 8 | 8.3 | 5 | 10.6 | 0 | 1 | 11.1 | 29 | 6.5 | |
| 40 to 49 | 1,312 | 30 | 4.9 | 76.2 | 11 | 11.5 | 3 | 6.4 | 0 | 1 | 11.1 | 15 | 3.4 | |
| 50 to 59 | 1,138 | 21 | 3.4 | 79.6 | 3 | 3.2 | 2 | 4.3 | 1 | 6.7 | 1 | 11.1 | 14 | 3.1 |
| 60 to 69 | 1,546 | 24 | 3.9 | 83.5 | 7 | 7.4 | 3 | 6.4 | 2 | 13.3 | 0 | 12 | 2.7 | |
| 70 to 79 | 1,048 | 14 | 2.3 | 85.8 | 7 | 7.4 | 0 | 0 | 0 | 7 | 1.6 | |||
| 80 to 89 | 747 | 9 | 1.5 | 87.3 | 0 | 3 | 6.4 | 0 | 0 | 6 | 1.3 | |||
| 90 to 99 | 831 | 9 | 1.5 | 88.8 | 5 | 5.3 | 1 | 2.1 | 1 | 6.7 | 0 | 2 | 0.4 | |
| 100 to 109 | 532 | 5 | 0.8 | 89.6 | 0 | 0 | 0 | 1 | 11.1 | 4 | 0.9 | |||
| 110 to 119 | 570 | 5 | 0.8 | 90.4 | 0 | 0 | 0 | 0 | 5 | 1.1 | ||||
| 120 to 129 | 865 | 7 | 1.1 | 91.5 | 0 | 1 | 2.1 | 0 | 0 | 6 | 1.3 | |||
| 130 to 139 | 810 | 6 | 1.0 | 92.5 | 2 | 2.1 | 1 | 2.1 | 0 | 0 | 3 | 0.7 | ||
| 140 to 149 | 292 | 2 | 0.3 | 92.8 | 1 | 1.1 | 0 | 0 | 0 | 1 | 0.2 | |||
| 150 to 159 | 922 | 6 | 1.0 | 93.8 | 2 | 2.1 | 1 | 2.1 | 0 | 0 | 3 | 0.7 | ||
| 160 to 169 | 499 | 3 | 0.5 | 94.3 | 1 | 1.1 | 0 | 0 | 0 | 2 | 0.4 | |||
| 170 to 199 | 1,261 | 7 | 1.1 | 95.4 | 3 | 3.2 | 0 | 2 | 13.3 | 0 | 2 | 0.4 | ||
| 200 to 299 | 2,851 | 12 | 2.0 | 97.4 | 0 | 1 | 2.1 | 2 | 13.3 | 0 | 9 | 2.0 | ||
| 300 to 399 | 5,070 | 13 | 2.1 | 99.5 | 5 | 5.3 | 3 | 6.4 | 1 | 6.7 | 1 | 11.1 | 3 | 0.7 |
| 500 to 799 | 1,086 | 2 | 0.3 | 99.8 | 1 | 1.1 | 0 | 0 | 0 | 1 | 0.2 | |||
| 800 and over | 802 | 1 | 0.2 | 100.0 | 1 | 1.1 | 0 | 0 | 0 | 0 | ||||
- 1 See Glossary for definitions of terms.
306 of 307 figures sit in a row or column sum that works out. 2 cells break a sum: '10 to 19', column 3: prints 143, the subtotals in columns 6 to 14 add to 142; 'Total RD elections', column 3: prints 611, rows 'Under 10' to '800 and over' add to 612.
Reader’s notes
p. 262. Crop scope: the image shows only panel "A. Certification elections (RC and RM)" of Table 17; the caption carries a footnote marker 1, but no footnote text appears on this crop (it presumably sits under the continuation of the table). The caption itself is omitted per instructions. Decimal points: this is a 1-bit scan in which the light period of many decimal fractions did not survive, so cells such as "100.0", "25.2" and "43.8" render visually as "100 0", "25 2", "43 8". I have written the decimal points, because every one of these columns is a one-decimal percentage and the values reconcile only on that reading (see below). No digits were altered. Verification performed (nothing was computed into a cell, this is only a check of the reading): the "Number eligible to vote" column sums to exactly 446,978; "Total elections" to 8,027; AFL-CIO Number to 2,296; Teamsters Number to 1,166; Other national Number to 253; Other local Number to 278; no-representative Number to 4,034 — each matching its printed total. Each "Percent by size class" column also sums to exactly 100.0, and the "Cumulative percent of total" column reproduces the running sum of "Percent of total" exactly. Apparent misprint in the source (transcribed as printed, not corrected): for "Under 10", "Percent of total" is printed 25.2 and cumulative 25.2, but 2,007 of 8,027 is 25.0 percent. The printed 25.2 is what makes the "Percent of total" column total 100.0 and the whole cumulative column consistent, so the 0.2 discrepancy is in the original. Two other printed percentages differ by 0.1 from the computed value in the same way: Teamsters "Under 10" 43.8 (512/1,166 = 43.9) and Other local "10 to 19" 18.6 (52/278 = 18.7); both are as printed and both are what make those columns total 100.0. Dash rules: the "Cumulative percent of total" cell of the "Total RC and RM elections" row, and every "Percent by size class" cell whose Number is 0, are printed as a dash rule and are given as "". Minor ink artifacts: a stray leader dot sits just left of the "45" in the "Total elections" cell of row "160 to 169", and the "38" in the no-representative Number cell of row "150 to 159" is slightly blotted; both readings are confirmed by the column sums above. The row label "2,000 to 2,999" is very slightly clipped at the bottom edge of the crop but is legible.
p. 263. Continuation panel: no column headings are printed on this crop, so header_rows is empty. The grid has 15 columns: stub + 14 value columns, counted from the vertical rules. Column 1 is a count that sums exactly to the printed total 28,426 (employees); column 2 is a count of elections with its percent (col 3) and a cumulative percent (col 4); columns 5-14 are five further count/percent pairs. Column headings that would name these columns are on the preceding page. "B. Decertification elections (RD)" is printed centred above the table's top rule, not in the stub; it is transcribed as a section line with no values. The period after "B" is not clearly inked (it reads as a wide gap), as is the period in "100 0". Decimal points: throughout this scan the periods in decimals are frequently broken and print as a gap ("28 1", "100 0", "6 7"); they are transcribed as decimal points, matching the rows where the period is well inked ("28.1", "12.9", "100.0"). Doubtful cell: row "10 to 19", column 2 reads 143 on both readings and is transcribed as printed, but the 22 size rows then sum to 612 against the printed total of 611. A value of 142 would reconcile both the total and the rounding pattern of column 3 (whose printed entries sum to exactly 100.0, with 28.1 and 23.3 each rounded up by 0.1 to close the sum). Treat this cell as uncertain between 143 and 142; every other count column sums exactly to its printed total (95, 47, 15, 9, 445, 28,426). No "400 to 499" row is printed: the stub jumps from "300 to 399" to "500 to 799". Nothing is cut off by the crop - column 1 sums exactly to the printed 28,426 over the 22 rows shown. Row "120 to 129", column 13: a stray ink speck sits just left of the 6; it is not a footnote marker (the column sums to the printed 445 with 6), so the cell is transcribed as 6. Dash rules ("--------") in place of a value are transcribed as empty cells; printed zeros are kept as 0. Percent columns 6, 8 and 14 contain small rounding inconsistencies as printed (e.g. 16/95 printed as 16.7, 15/95 as 15.7, 12/47 as 25.6, 155/445 as 34.9); each percent column's printed entries nevertheless sum to exactly 100.0, so these are the publisher's adjustments and are transcribed unchanged.
Source image
Source data: U.S. NLRB Annual Reports (public domain). Reconstruction by NLRB Stats Archive. Read by claude-opus-5 (effort max, prompt extract_v1) from the 300-dpi scan; stitched by page. Updated October 2026.