NLRB Stats Archive › Annual Reports › FY1976 › Industrial distribution of representation elections held in cases closed
Industrial distribution of representation elections held in cases closed
| Industrial group | Total elections | Total elections won | AFL-CIO unions | Teamsters | Other national unions | Other local unions | No representative chosen | Number of employees eligible to vote | Total valid votes cast | Total votes for unions | AFL-CIO unions | Teamsters | Other national unions | Other local unions | Votes for no union | Eligible employees in units choosing representation |
|---|---|---|---|---|---|---|---|---|---|---|---|---|---|---|---|---|
| Mining (total) | 90 | 43 | 15 | 5 | 18 | 5 | 47 | 4,189 | 3,756 | 2,165 | 679 | 199 | 787 | 650 | 1,591 | 1,326 |
| Transportation, communication, and other utilities | 1,022 | 517 | 238 | 225 | 19 | 35 | 505 | 31,090 | 27,386 | 14,454 | 7,910 | 5,002 | 787 | 788 | 12,932 | 14,750 |
| Services (total) | 1,584 | 876 | 575 | 128 | 21 | 152 | 708 | 102,337 | 82,386 | 41,599 | 27,859 | 4,696 | 577 | 9,052 | 42,974 | 55,884 |
| Total, all industrial groups | 8,084 | 3,861 | 2,165 | 1,167 | 263 | 266 | 4,223 | 475,404 | 418,247 | 191,901 | 121,956 | 29,360 | 11,990 | 28,595 | 219,033 | 173,385 |
| Industry detail rows (Metal mining, Coal mining, Crude petroleum, Mining of nonmetallic, Construction, Wholesale, Retail, Finance, Hotels, Personal services, Auto repair, Health, Educational, Membership, Misc) |
Source image
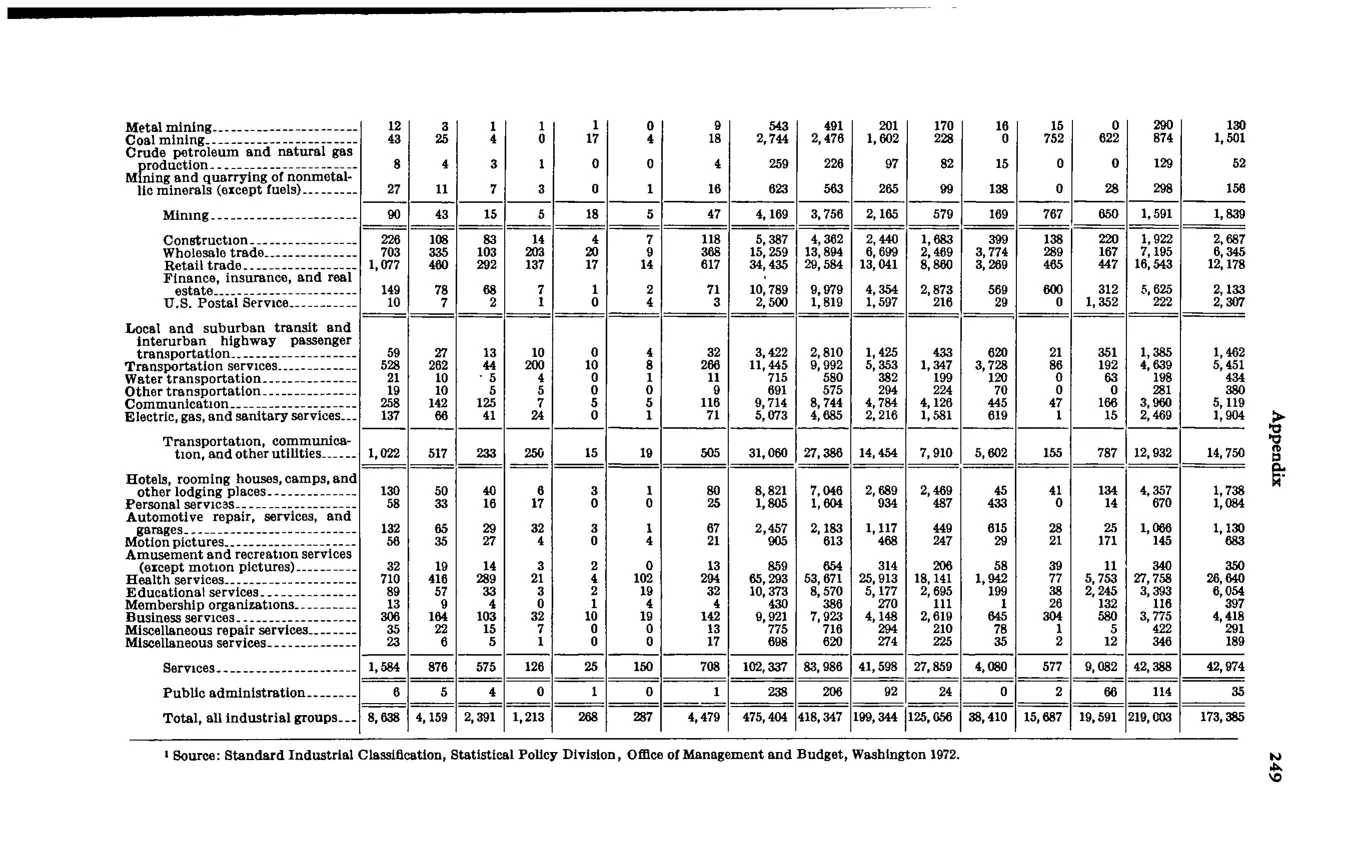
Source data: U.S. NLRB Annual Reports (public domain). Reconstruction by NLRB Stats Archive. Updated June 2026.