NLRB Stats Archive › Annual Reports › FY1976 › Disposition of objections in representation cases closed
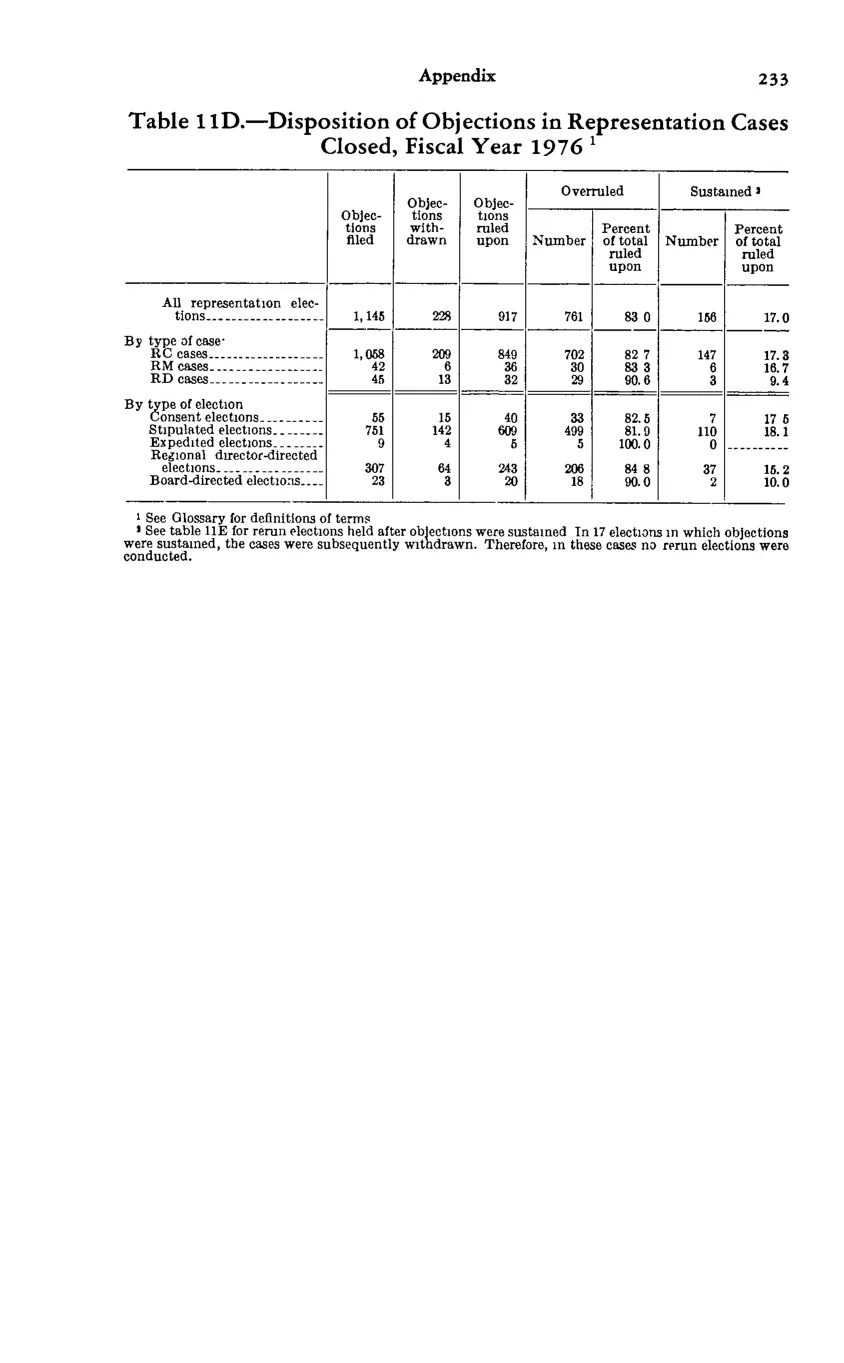
Disposition of objections in representation cases closed
| Item | Objections filed | Objections withdrawn | Objections ruled upon | Overruled | Overruled | Sustained | Sustained |
|---|---|---|---|---|---|---|---|
| Item | Objections filed | Objections withdrawn | Objections ruled upon | Number | Percent of total ruled upon | Number | Percent of total ruled upon |
| All representation elections | 1,145 | 228 | 917 | 761 | 83 | 156 | 17 |
| By type of case: RC cases | 1,058 | 209 | 849 | 702 | 82.7 | 147 | 17.3 |
| RM cases | 42 | 6 | 36 | 30 | 83.3 | 6 | 16.7 |
| RD cases | 45 | 13 | 32 | 29 | 90.6 | 3 | 9.4 |
| By type of election: Consent elections | 55 | 15 | 40 | 33 | 82.5 | 7 | 17.5 |
| Stipulated elections | 751 | 142 | 609 | 499 | 81.9 | 110 | 18.1 |
| Expedited elections | 9 | 4 | 5 | 5 | 100 | 0 | |
| Regional director-directed elections | 307 | 64 | 243 | 206 | 84.8 | 37 | 15.2 |
| Board-directed elections | 23 | 3 | 20 | 18 | 90 | 2 | 10 |
Source image
Source data: U.S. NLRB Annual Reports (public domain). Reconstruction by NLRB Stats Archive. Updated June 2026.