NLRB Stats Archive › Annual Reports › FY1976 › Objections filed in representation cases closed
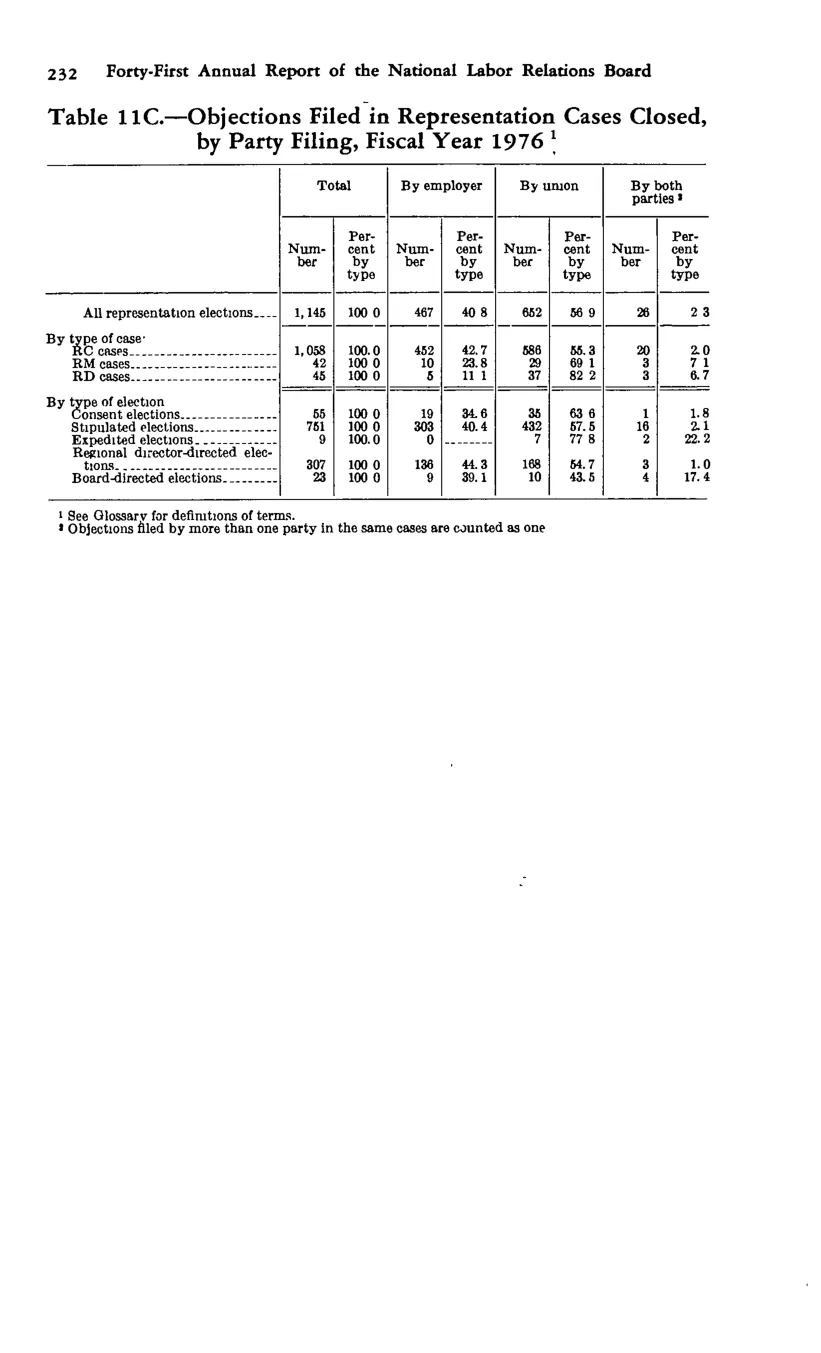
Objections filed in representation cases closed
| Item | Total | Total | By employer | By employer | By union | By union | By both parties | By both parties |
|---|---|---|---|---|---|---|---|---|
| Item | Number | Percent by type | Number | Percent by type | Number | Percent by type | Number | Percent by type |
| All representation elections | 1,145 | 100 | 467 | 40.8 | 652 | 56.9 | 26 | 2.3 |
| By type of case: RC cases | 1,058 | 100 | 452 | 42.7 | 586 | 55.3 | 20 | 2 |
| RM cases | 42 | 100 | 10 | 23.8 | 29 | 69.1 | 3 | 7.1 |
| RD cases | 45 | 100 | 5 | 11.1 | 37 | 82.2 | 3 | 6.7 |
| By type of election: Consent elections | 55 | 100 | 19 | 34.6 | 35 | 63.6 | 1 | 1.8 |
| Stipulated elections | 751 | 100 | 303 | 40.4 | 432 | 57.5 | 16 | 2.1 |
| Expedited elections | 9 | 100 | 0 | 7 | 77.8 | 2 | 22.2 | |
| Regional director-directed elections | 307 | 100 | 136 | 44.3 | 168 | 54.7 | 3 | 1 |
| Board-directed elections | 23 | 100 | 9 | 39.1 | 10 | 43.5 | 4 | 17.4 |
Source image
Source data: U.S. NLRB Annual Reports (public domain). Reconstruction by NLRB Stats Archive. Updated June 2026.