NLRB Stats Archive › Annual Reports › FY1976 › Analysis of Methods of Disposition of Representation and Union Deauthorization Cases Closed, Fiscal Year 1976
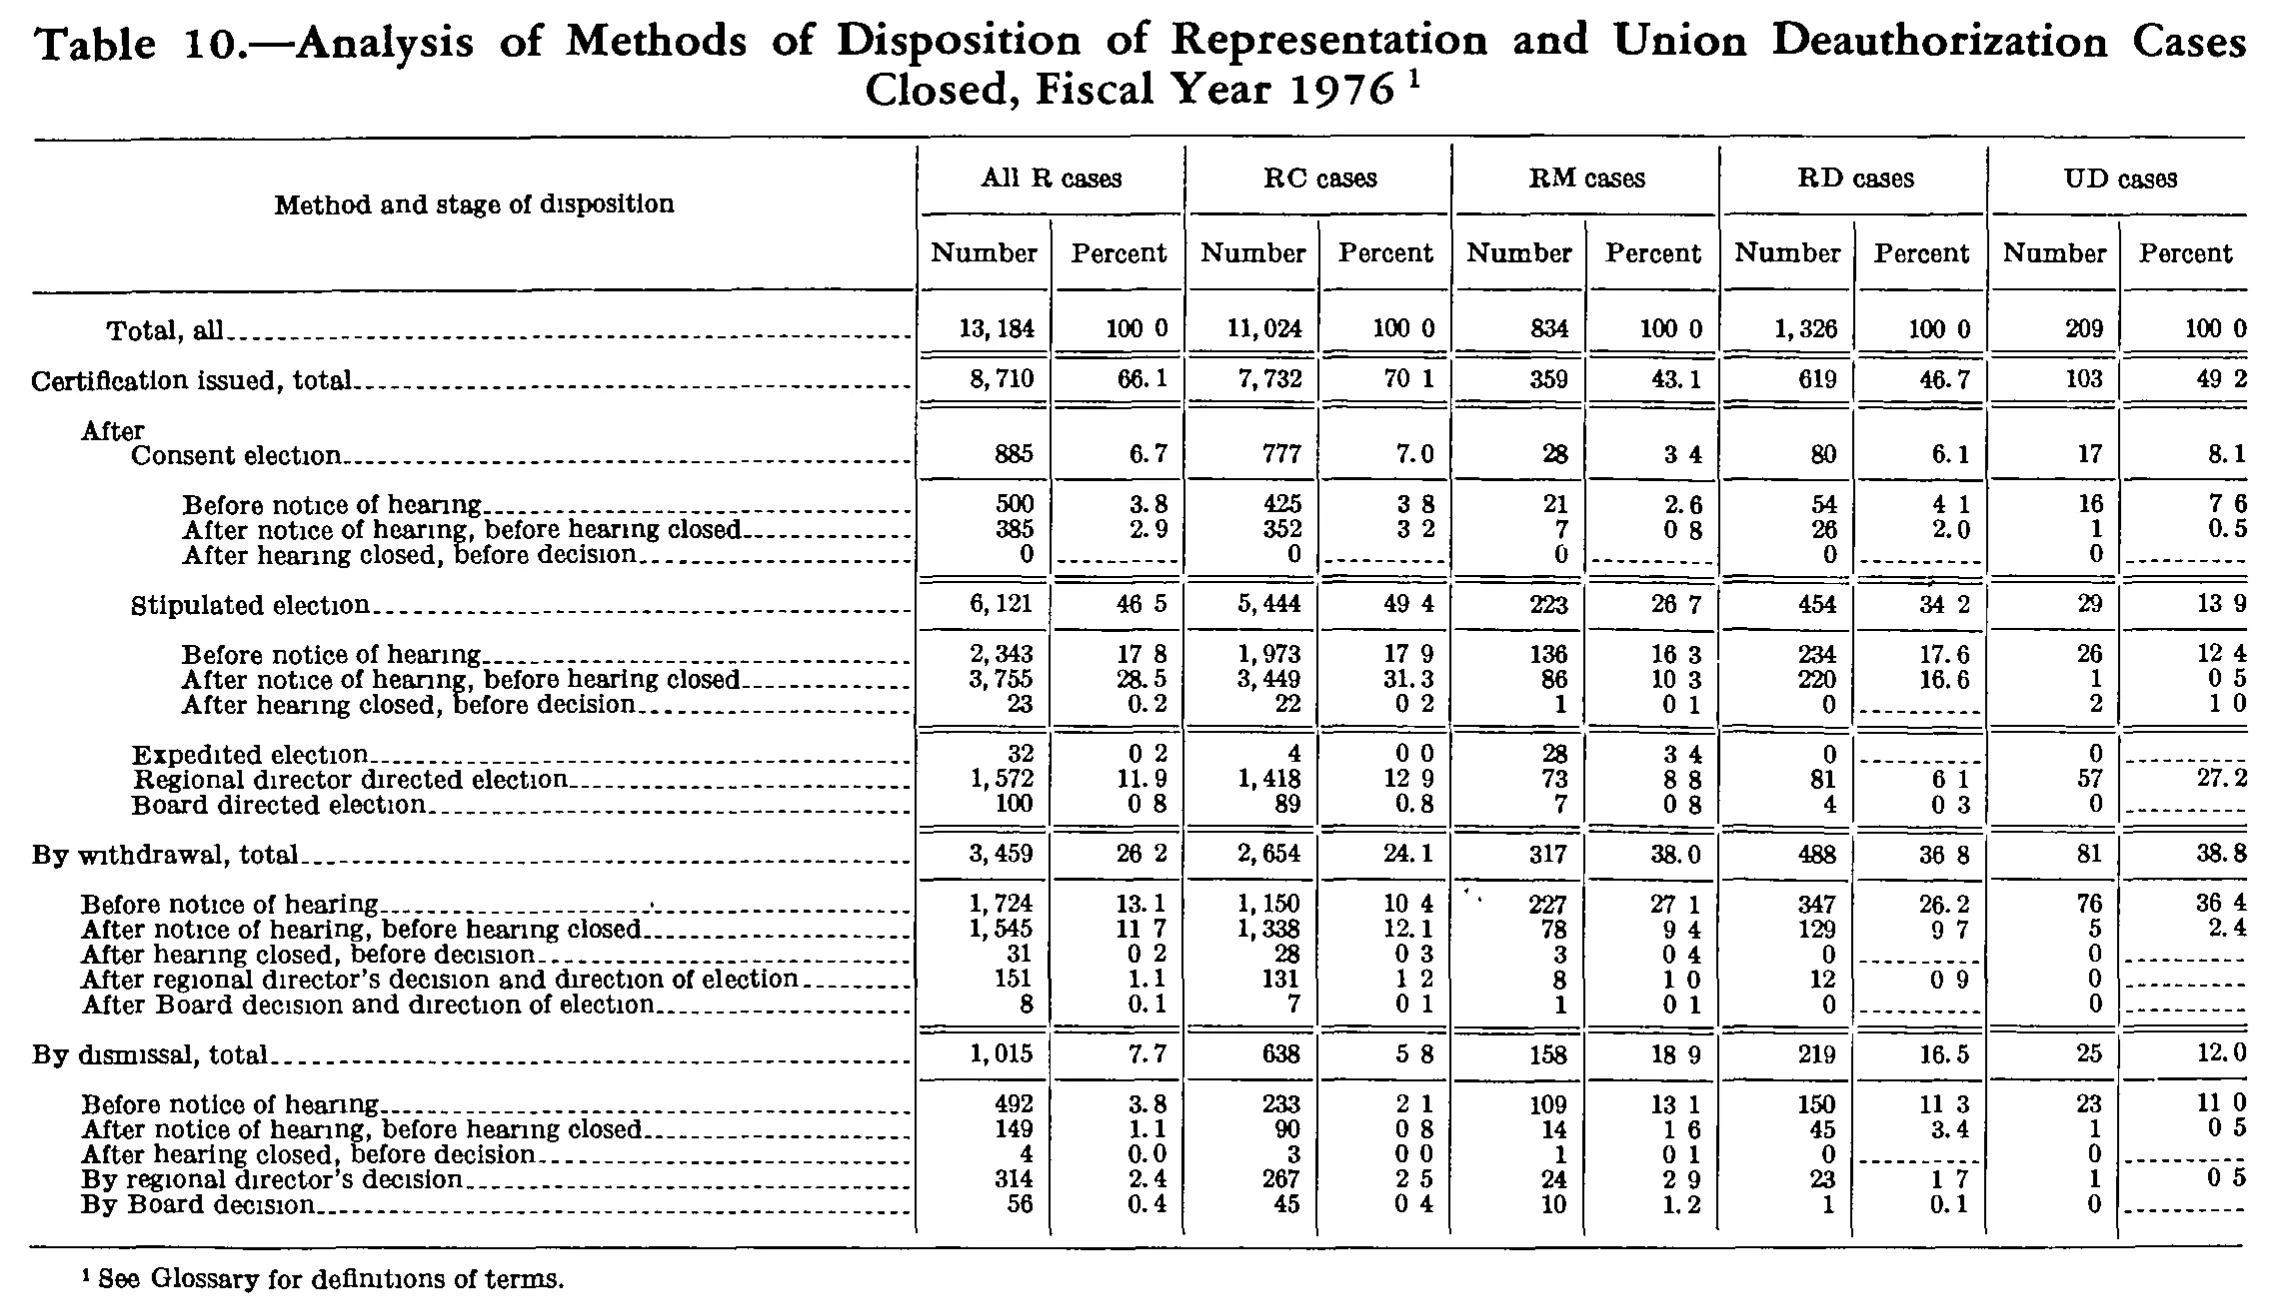
Analysis of Methods of Disposition of Representation and Union Deauthorization Cases Closed, Fiscal Year 1976
| Method and stage of disposition | All R cases | RC cases | RM cases | RD cases | UD cases | |||||
|---|---|---|---|---|---|---|---|---|---|---|
| Method and stage of disposition | Number | Percent | Number | Percent | Number | Percent | Number | Percent | Number | Percent |
| Total, all | 13,184 | 100.0 | 11,024 | 100.0 | 834 | 100.0 | 1,326 | 100.0 | 209 | 100.0 |
| Certification issued, total | 8,710 | 66.1 | 7,732 | 70.1 | 359 | 43.1 | 619 | 46.7 | 103 | 49.2 |
| After | ||||||||||
| Consent election | 885 | 6.7 | 777 | 7.0 | 28 | 3.4 | 80 | 6.1 | 17 | 8.1 |
| Before notice of hearing | 500 | 3.8 | 425 | 3.8 | 21 | 2.6 | 54 | 4.1 | 16 | 7.6 |
| After notice of hearing, before hearing closed | 385 | 2.9 | 352 | 3.2 | 7 | 0.8 | 26 | 2.0 | 1 | 0.5 |
| After hearing closed, before decision | 0 | 0 | 0 | 0 | 0 | |||||
| Stipulated election | 6,121 | 46.5 | 5,444 | 49.4 | 223 | 26.7 | 454 | 34.2 | 29 | 13.9 |
| Before notice of hearing | 2,343 | 17.8 | 1,973 | 17.9 | 136 | 16.3 | 234 | 17.6 | 26 | 12.4 |
| After notice of hearing, before hearing closed | 3,755 | 28.5 | 3,449 | 31.3 | 86 | 10.3 | 220 | 16.6 | 1 | 0.5 |
| After hearing closed, before decision | 23 | 0.2 | 22 | 0.2 | 1 | 0.1 | 0 | 2 | 1.0 | |
| Expedited election | 32 | 0.2 | 4 | 0.0 | 28 | 3.4 | 0 | 0 | ||
| Regional director directed election | 1,572 | 11.9 | 1,418 | 12.9 | 73 | 8.8 | 81 | 6.1 | 57 | 27.2 |
| Board directed election | 100 | 0.8 | 89 | 0.8 | 7 | 0.8 | 4 | 0.3 | 0 | |
| By withdrawal, total | 3,459 | 26.2 | 2,654 | 24.1 | 317 | 38.0 | 488 | 36.8 | 81 | 38.8 |
| Before notice of hearing | 1,724 | 13.1 | 1,150 | 10.4 | 227 | 27.1 | 347 | 26.2 | 76 | 36.4 |
| After notice of hearing, before hearing closed | 1,545 | 11.7 | 1,338 | 12.1 | 78 | 9.4 | 129 | 9.7 | 5 | 2.4 |
| After hearing closed, before decision | 31 | 0.2 | 28 | 0.3 | 3 | 0.4 | 0 | 0 | ||
| After regional director's decision and direction of election | 151 | 1.1 | 131 | 1.2 | 8 | 1.0 | 12 | 0.9 | 0 | |
| After Board decision and direction of election | 8 | 0.1 | 7 | 0.1 | 1 | 0.1 | 0 | 0 | ||
| By dismissal, total | 1,015 | 7.7 | 638 | 5.8 | 158 | 18.9 | 219 | 16.5 | 25 | 12.0 |
| Before notice of hearing | 492 | 3.8 | 233 | 2.1 | 109 | 13.1 | 150 | 11.3 | 23 | 11.0 |
| After notice of hearing, before hearing closed | 149 | 1.1 | 90 | 0.8 | 14 | 1.6 | 45 | 3.4 | 1 | 0.5 |
| After hearing closed, before decision | 4 | 0.0 | 3 | 0.0 | 1 | 0.1 | 0 | 0 | ||
| By regional director's decision | 314 | 2.4 | 267 | 2.5 | 24 | 2.9 | 23 | 1.7 | 1 | 0.5 |
| By Board decision | 56 | 0.4 | 45 | 0.4 | 10 | 1.2 | 1 | 0.1 | 0 | |
- 1 See Glossary for definitions of terms.
108 of 108 figures sit in a row or column sum that works out.
Reader’s notes
p. 239. Decimal points: this is a 1-bit scan in which many periods in the Percent columns have dropped out or are separated by a space, so the page literally shows forms like \"100 0\", \"70 1\", \"43. 1\" and \"3 4\". Every Percent cell in this table is printed to one decimal place, so I have written them with a single decimal point (e.g. \"100.0\", \"70.1\", \"43.1\", \"3.4\"); no digits were changed. All percent columns and all number columns reconcile internally (sub-items sum to their subtotals, and the three major sections sum to \"Total, all\"; RC + RM + RD = All R cases), which confirms the digit readings and the column placement.\n\n\"After\" is a printed section line carrying only a label; \"Consent election\", \"Stipulated election\", \"Expedited election\", \"Regional director directed election\" and \"Board directed election\" are indented under it.\n\nCells shown as a dash rule (\"------\") in the Percent columns — the rows where the corresponding Number is 0 — are transcribed as empty strings.\n\nThe caption carries footnote marker 1, which is excluded along with the caption per instructions; the footnote text itself is retained.
Source image
Source data: U.S. NLRB Annual Reports (public domain). Reconstruction by NLRB Stats Archive. Read by claude-opus-5 (effort max, prompt extract_v1) from the 300-dpi scan; stitched by page. Updated October 2026.