NLRB Stats Archive › Annual Reports › FY1976 › Disposition by Stage of Unfair Labor Practice Cases Closed, Fiscal Year 1976
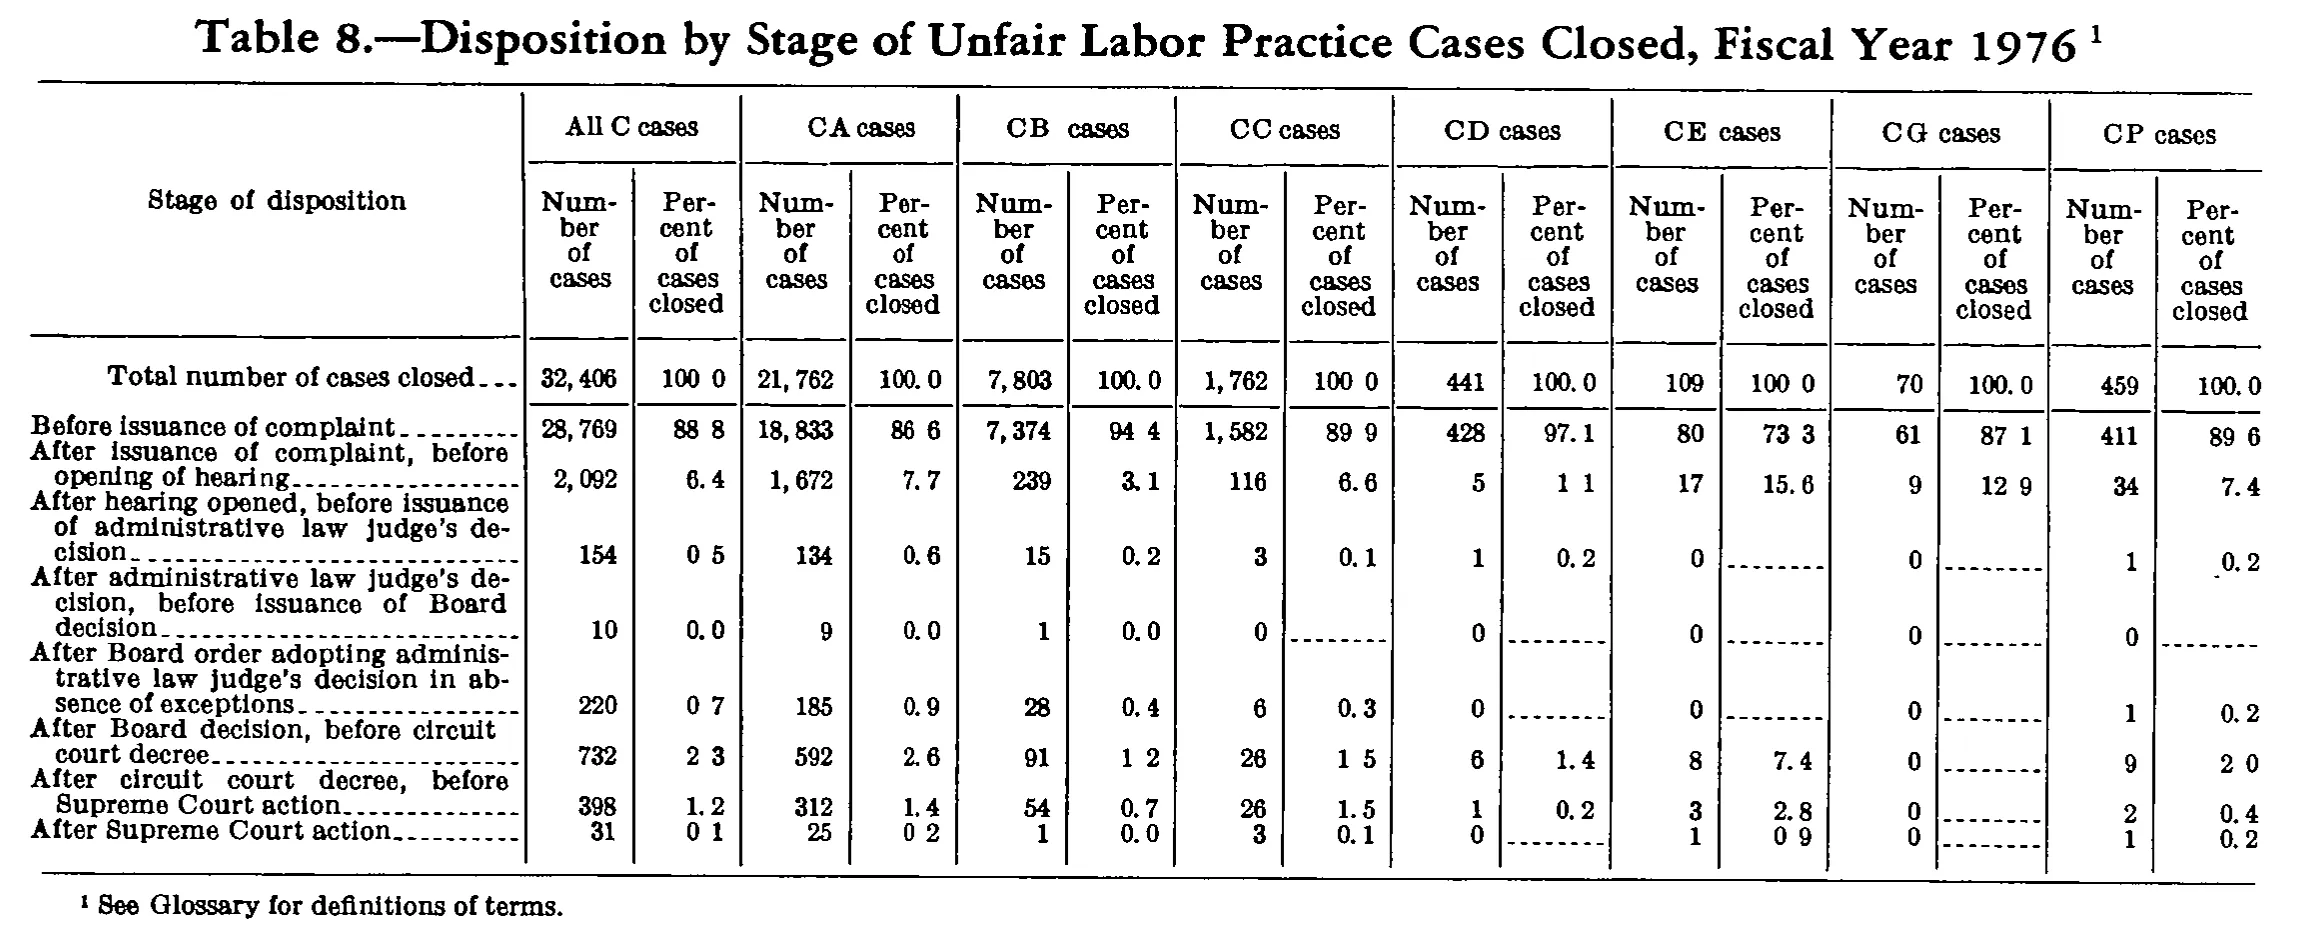
Disposition by Stage of Unfair Labor Practice Cases Closed, Fiscal Year 1976
| Stage of disposition | All C cases | CA cases | CB cases | CC cases | CD cases | CE cases | CG cases | CP cases | ||||||||
|---|---|---|---|---|---|---|---|---|---|---|---|---|---|---|---|---|
| Stage of disposition | Number of cases | Percent of cases closed | Number of cases | Percent of cases closed | Number of cases | Percent of cases closed | Number of cases | Percent of cases closed | Number of cases | Percent of cases closed | Number of cases | Percent of cases closed | Number of cases | Percent of cases closed | Number of cases | Percent of cases closed |
| Total number of cases closed | 32,406 | 100.0 | 21,762 | 100.0 | 7,803 | 100.0 | 1,762 | 100.0 | 441 | 100.0 | 109 | 100.0 | 70 | 100.0 | 459 | 100.0 |
| Before issuance of complaint | 28,769 | 88.8 | 18,833 | 86.6 | 7,374 | 94.4 | 1,582 | 89.9 | 428 | 97.1 | 80 | 73.3 | 61 | 87.1 | 411 | 89.6 |
| After issuance of complaint, before opening of hearing | 2,092 | 6.4 | 1,672 | 7.7 | 239 | 3.1 | 116 | 6.6 | 5 | 1.1 | 17 | 15.6 | 9 | 12.9 | 34 | 7.4 |
| After hearing opened, before issuance of administrative law judge's decision | 154 | 0.5 | 134 | 0.6 | 15 | 0.2 | 3 | 0.1 | 1 | 0.2 | 0 | 0 | 1 | 0.2 | ||
| After administrative law judge's decision, before issuance of Board decision | 10 | 0.0 | 9 | 0.0 | 1 | 0.0 | 0 | 0 | 0 | 0 | 0 | |||||
| After Board order adopting administrative law judge's decision in absence of exceptions | 220 | 0.7 | 185 | 0.9 | 28 | 0.4 | 6 | 0.3 | 0 | 0 | 0 | 1 | 0.2 | |||
| After Board decision, before circuit court decree | 732 | 2.3 | 592 | 2.6 | 91 | 1.2 | 26 | 1.5 | 6 | 1.4 | 8 | 7.4 | 0 | 9 | 2.0 | |
| After circuit court decree, before Supreme Court action | 398 | 1.2 | 312 | 1.4 | 54 | 0.7 | 26 | 1.5 | 1 | 0.2 | 3 | 2.8 | 0 | 2 | 0.4 | |
| After Supreme Court action | 31 | 0.1 | 25 | 0.2 | 1 | 0.0 | 3 | 0.1 | 0 | 1 | 0.9 | 0 | 1 | 0.2 | ||
- 1 See Glossary for definitions of terms.
58 of 58 figures sit in a row or column sum that works out.
Reader’s notes
p. 237. The table is printed as eight side-by-side case-type panels (All C, CA, CB, CC, CD, CE, CG, CP), each with a "Number of cases" and a "Percent of cases closed" column, sharing one stub; that gives 17 columns, all kept side by side here because the panels share the same row labels (this is a single panel set, not stacked panels). Decimal points: in this scan the period in many percent values has dropped out, so cells print as "100 0", "88 8", "86 6", "94 4", "89 9", "73 3", "87 1", "89 6", "1 1", "12 9", "0 5", "0 7", "2 3", "1 2", "1 5", "2 0", "0 1", "0 2", "0 9". Every percent column on this page is typeset to one decimal place, and the gap sits exactly where the decimal point belongs, so these are transcribed with the point restored (100.0, 88.8, etc.). No digits were altered. Verification: each of the eight "Number of cases" columns sums exactly to its printed total (32,406; 21,762; 7,803; 1,762; 441; 109; 70; 459), and each percent column sums to 100.0 as transcribed. No misprints detected. Empty percent cells are printed as dash rules (------), transcribed as "" per instructions; the matching number cell in those positions is a printed 0. In the "After administrative law judge's decision, before issuance of Board decision" row the CP percent cell is faint at the right edge of the crop but reads as a dash rule or blank either way, so it is "". The caption carries footnote marker 1 (Fiscal Year 1976^1), which is the reference for the single printed footnote; the caption itself is omitted per instructions.
Source image
Source data: U.S. NLRB Annual Reports (public domain). Reconstruction by NLRB Stats Archive. Read by claude-opus-5 (effort max, prompt extract_v1) from the 300-dpi scan; stitched by page. Updated October 2026.