NLRB Stats Archive › Annual Reports › FY1976 › Geographic Distribution of Cases Received, Fiscal Year 1976
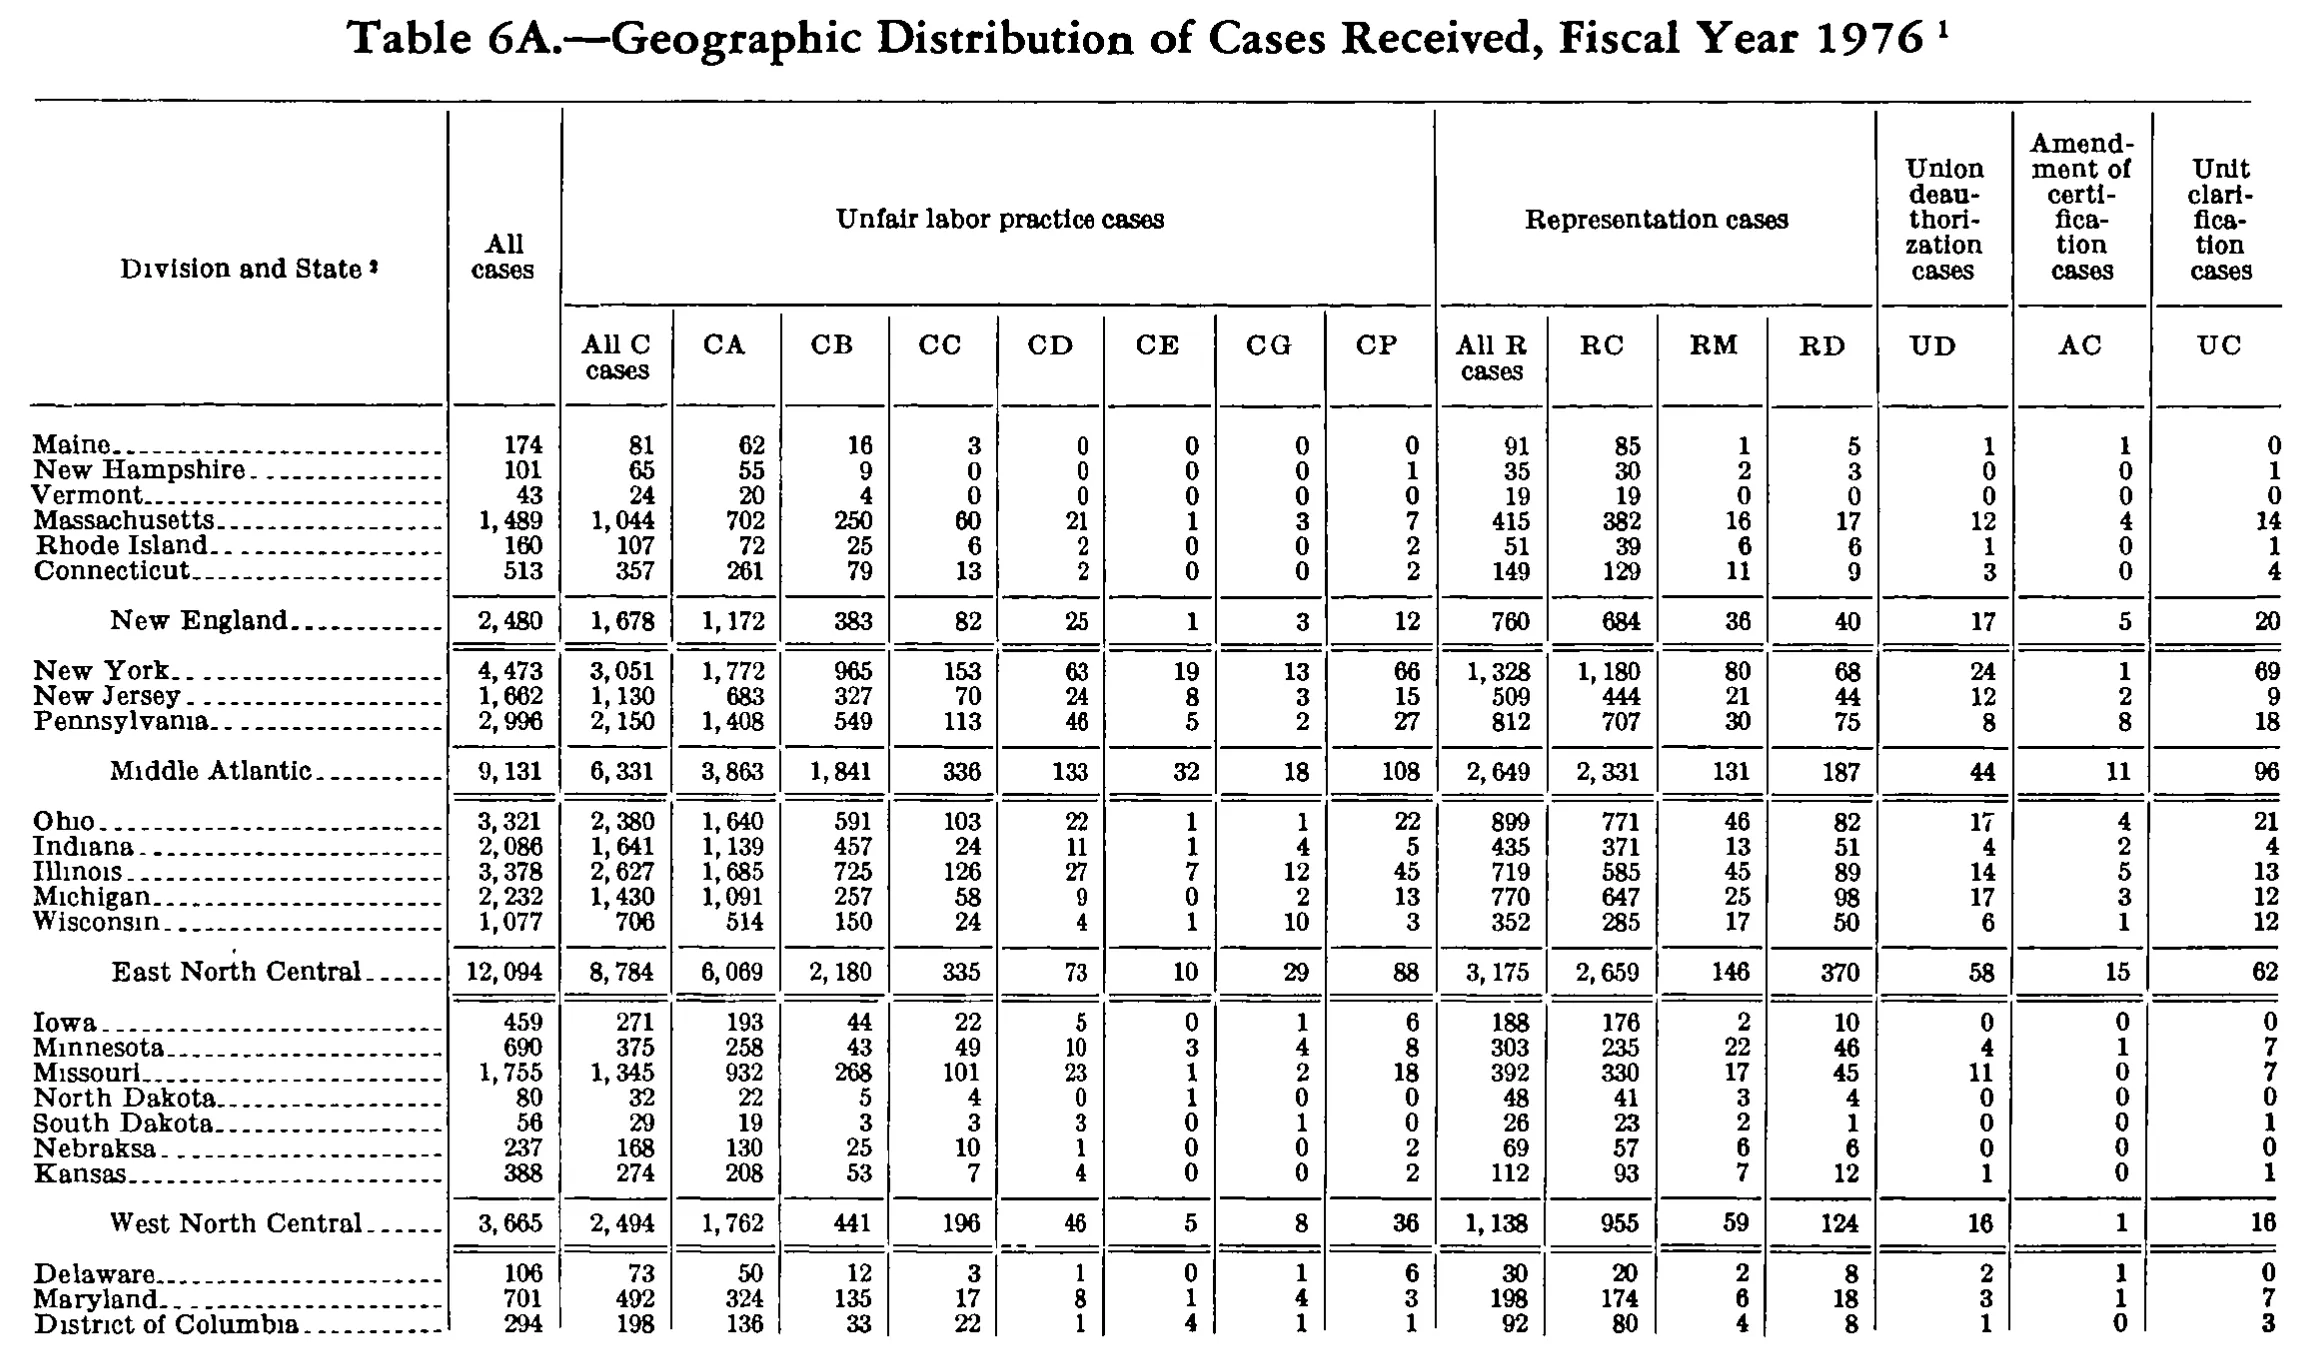
Geographic Distribution of Cases Received, Fiscal Year 1976
Stitched from pp. 230–231.
| Division and State | All cases | Unfair labor practice cases | Representation cases | Union deauthorization cases | Amendment of certification cases | Unit clarification cases | ||||||||||
|---|---|---|---|---|---|---|---|---|---|---|---|---|---|---|---|---|
| Division and State | All cases | All C cases | CA | CB | CC | CD | CE | CG | CP | All R cases | RC | RM | RD | UD | AC | UC |
| Maine | 174 | 81 | 62 | 16 | 3 | 0 | 0 | 0 | 0 | 91 | 85 | 1 | 5 | 1 | 1 | 0 |
| New Hampshire | 101 | 65 | 55 | 9 | 0 | 0 | 0 | 0 | 1 | 35 | 30 | 2 | 3 | 0 | 0 | 1 |
| Vermont | 43 | 24 | 20 | 4 | 0 | 0 | 0 | 0 | 0 | 19 | 19 | 0 | 0 | 0 | 0 | 0 |
| Massachusetts | 1,489 | 1,044 | 702 | 250 | 60 | 21 | 1 | 3 | 7 | 415 | 382 | 16 | 17 | 12 | 4 | 14 |
| Rhode Island | 160 | 107 | 72 | 25 | 6 | 2 | 0 | 0 | 2 | 51 | 39 | 6 | 6 | 1 | 0 | 1 |
| Connecticut | 513 | 357 | 261 | 79 | 13 | 2 | 0 | 0 | 2 | 149 | 129 | 11 | 9 | 3 | 0 | 4 |
| New England | 2,480 | 1,678 | 1,172 | 383 | 82 | 25 | 1 | 3 | 12 | 760 | 684 | 36 | 40 | 17 | 5 | 20 |
| New York | 4,473 | 3,051 | 1,772 | 965 | 153 | 63 | 19 | 13 | 66 | 1,328 | 1,180 | 80 | 68 | 24 | 1 | 69 |
| New Jersey | 1,662 | 1,130 | 683 | 327 | 70 | 24 | 8 | 3 | 15 | 509 | 444 | 21 | 44 | 12 | 2 | 9 |
| Pennsylvania | 2,996 | 2,150 | 1,408 | 549 | 113 | 46 | 5 | 2 | 27 | 812 | 707 | 30 | 75 | 8 | 8 | 18 |
| Middle Atlantic | 9,131 | 6,331 | 3,863 | 1,841 | 336 | 133 | 32 | 18 | 108 | 2,649 | 2,331 | 131 | 187 | 44 | 11 | 96 |
| Ohio | 3,321 | 2,380 | 1,640 | 591 | 103 | 22 | 1 | 1 | 22 | 899 | 771 | 46 | 82 | 17 | 4 | 21 |
| Indiana | 2,086 | 1,641 | 1,139 | 457 | 24 | 11 | 1 | 4 | 5 | 435 | 371 | 13 | 51 | 4 | 2 | 4 |
| Illinois | 3,378 | 2,627 | 1,685 | 725 | 126 | 27 | 7 | 12 | 45 | 719 | 585 | 45 | 89 | 14 | 5 | 13 |
| Michigan | 2,232 | 1,430 | 1,091 | 257 | 58 | 9 | 0 | 2 | 13 | 770 | 647 | 25 | 98 | 17 | 3 | 12 |
| Wisconsin | 1,077 | 706 | 514 | 150 | 24 | 4 | 1 | 10 | 3 | 352 | 285 | 17 | 50 | 6 | 1 | 12 |
| East North Central | 12,094 | 8,784 | 6,069 | 2,180 | 335 | 73 | 10 | 29 | 88 | 3,175 | 2,659 | 146 | 370 | 58 | 15 | 62 |
| Iowa | 459 | 271 | 193 | 44 | 22 | 5 | 0 | 1 | 6 | 188 | 176 | 2 | 10 | 0 | 0 | 0 |
| Minnesota | 690 | 375 | 258 | 43 | 49 | 10 | 3 | 4 | 8 | 303 | 235 | 22 | 46 | 4 | 1 | 7 |
| Missouri | 1,755 | 1,345 | 932 | 268 | 101 | 23 | 1 | 2 | 18 | 392 | 330 | 17 | 45 | 11 | 0 | 7 |
| North Dakota | 80 | 32 | 22 | 5 | 4 | 0 | 1 | 0 | 0 | 48 | 41 | 3 | 4 | 0 | 0 | 0 |
| South Dakota | 56 | 29 | 19 | 3 | 3 | 3 | 0 | 1 | 0 | 26 | 23 | 2 | 1 | 0 | 0 | 1 |
| Nebraksa | 237 | 168 | 130 | 25 | 10 | 1 | 0 | 0 | 2 | 69 | 57 | 6 | 6 | 0 | 0 | 0 |
| Kansas | 388 | 274 | 208 | 53 | 7 | 4 | 0 | 0 | 2 | 112 | 93 | 7 | 12 | 1 | 0 | 1 |
| West North Central | 3,665 | 2,494 | 1,762 | 441 | 196 | 46 | 5 | 8 | 36 | 1,138 | 955 | 59 | 124 | 16 | 1 | 16 |
| Delaware | 106 | 73 | 50 | 12 | 3 | 1 | 0 | 1 | 6 | 30 | 20 | 2 | 8 | 2 | 1 | 0 |
| Maryland | 701 | 492 | 324 | 135 | 17 | 8 | 1 | 4 | 3 | 198 | 174 | 6 | 18 | 3 | 1 | 7 |
| District of Columbia | 294 | 198 | 136 | 33 | 22 | 1 | 4 | 1 | 1 | 92 | 80 | 4 | 8 | 1 | 0 | 3 |
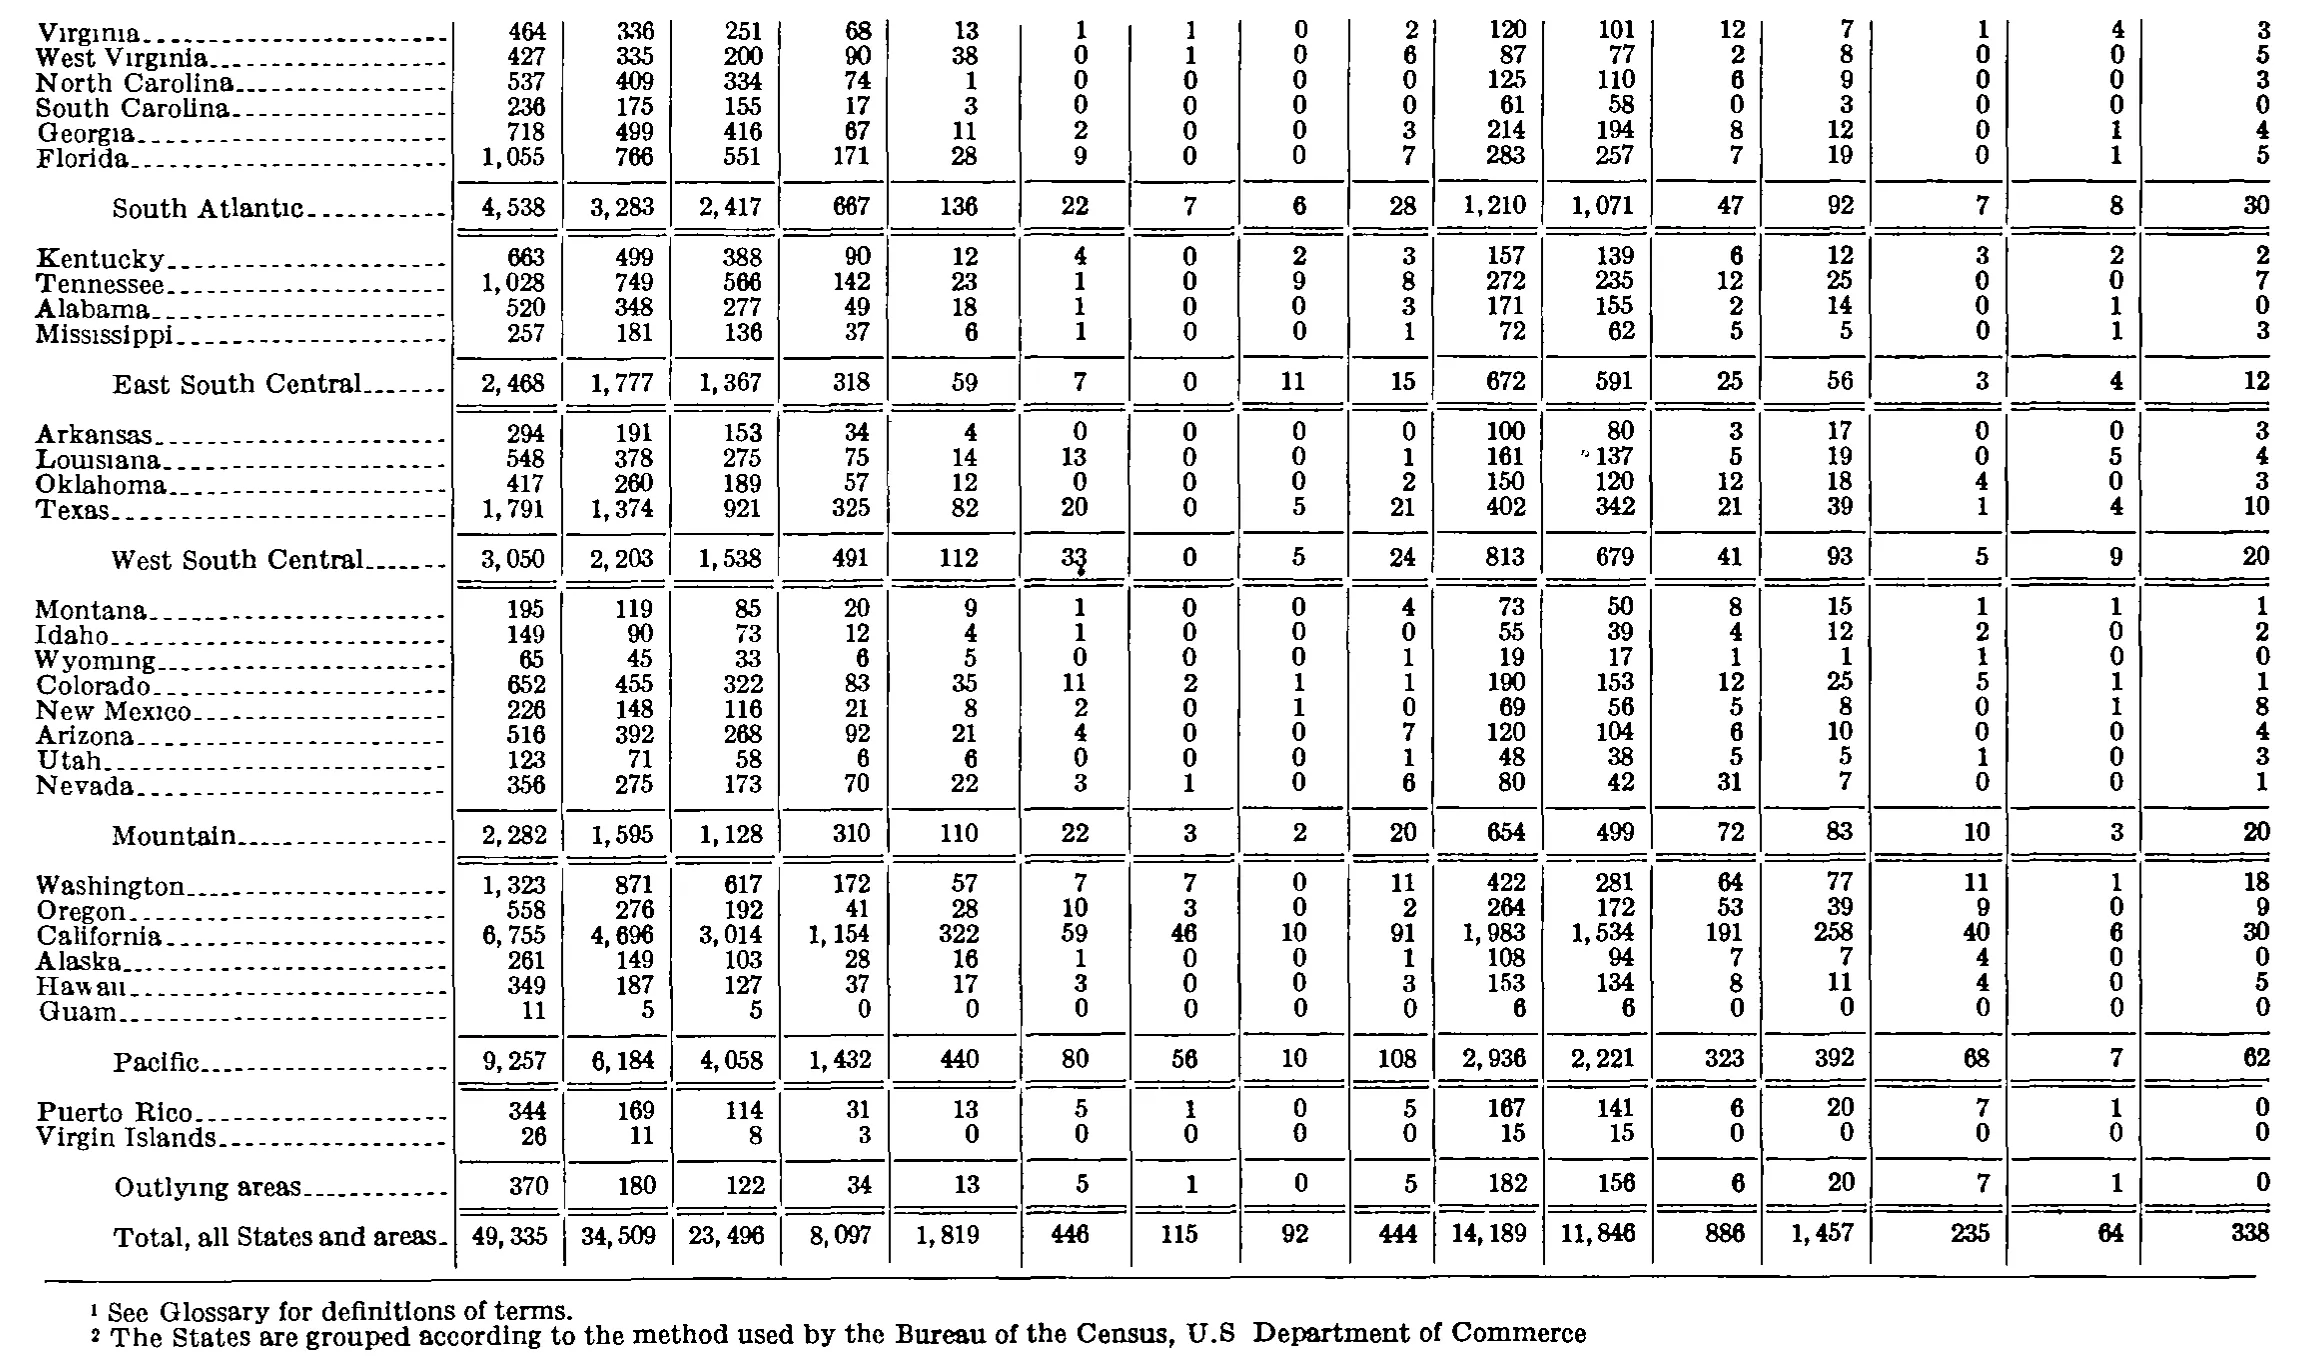
| Virginia | 464 | 336 | 251 | 68 | 13 | 1 | 1 | 0 | 2 | 120 | 101 | 12 | 7 | 1 | 4 | 3 |
| West Virginia | 427 | 335 | 200 | 90 | 38 | 0 | 1 | 0 | 6 | 87 | 77 | 2 | 8 | 0 | 0 | 5 |
| North Carolina | 537 | 409 | 334 | 74 | 1 | 0 | 0 | 0 | 0 | 125 | 110 | 6 | 9 | 0 | 0 | 3 |
| South Carolina | 236 | 175 | 155 | 17 | 3 | 0 | 0 | 0 | 0 | 61 | 58 | 0 | 3 | 0 | 0 | 0 |
| Georgia | 718 | 499 | 416 | 67 | 11 | 2 | 0 | 0 | 3 | 214 | 194 | 8 | 12 | 0 | 1 | 4 |
| Florida | 1,055 | 766 | 551 | 171 | 28 | 9 | 0 | 0 | 7 | 283 | 257 | 7 | 19 | 0 | 1 | 5 |
| South Atlantic | 4,538 | 3,283 | 2,417 | 667 | 136 | 22 | 7 | 6 | 28 | 1,210 | 1,071 | 47 | 92 | 7 | 8 | 30 |
| Kentucky | 663 | 499 | 388 | 90 | 12 | 4 | 0 | 2 | 3 | 157 | 139 | 6 | 12 | 3 | 2 | 2 |
| Tennessee | 1,028 | 749 | 566 | 142 | 23 | 1 | 0 | 9 | 8 | 272 | 235 | 12 | 25 | 0 | 0 | 7 |
| Alabama | 520 | 348 | 277 | 49 | 18 | 1 | 0 | 0 | 3 | 171 | 155 | 2 | 14 | 0 | 1 | 0 |
| Mississippi | 257 | 181 | 136 | 37 | 6 | 1 | 0 | 0 | 1 | 72 | 62 | 5 | 5 | 0 | 1 | 3 |
| East South Central | 2,468 | 1,777 | 1,367 | 318 | 59 | 7 | 0 | 11 | 15 | 672 | 591 | 25 | 56 | 3 | 4 | 12 |
| Arkansas | 294 | 191 | 153 | 34 | 4 | 0 | 0 | 0 | 0 | 100 | 80 | 3 | 17 | 0 | 0 | 3 |
| Louisiana | 548 | 378 | 275 | 75 | 14 | 13 | 0 | 0 | 1 | 161 | 137 | 5 | 19 | 0 | 5 | 4 |
| Oklahoma | 417 | 260 | 189 | 57 | 12 | 0 | 0 | 0 | 2 | 150 | 120 | 12 | 18 | 4 | 0 | 3 |
| Texas | 1,791 | 1,374 | 921 | 325 | 82 | 20 | 0 | 5 | 21 | 402 | 342 | 21 | 39 | 1 | 4 | 10 |
| West South Central | 3,050 | 2,203 | 1,538 | 491 | 112 | 33 | 0 | 5 | 24 | 813 | 679 | 41 | 93 | 5 | 9 | 20 |
| Montana | 195 | 119 | 85 | 20 | 9 | 1 | 0 | 0 | 4 | 73 | 50 | 8 | 15 | 1 | 1 | 1 |
| Idaho | 149 | 90 | 73 | 12 | 4 | 1 | 0 | 0 | 0 | 55 | 39 | 4 | 12 | 2 | 0 | 2 |
| Wyoming | 65 | 45 | 33 | 6 | 5 | 0 | 0 | 0 | 1 | 19 | 17 | 1 | 1 | 1 | 0 | 0 |
| Colorado | 652 | 455 | 322 | 83 | 35 | 11 | 2 | 1 | 1 | 190 | 153 | 12 | 25 | 5 | 1 | 1 |
| New Mexico | 226 | 148 | 116 | 21 | 8 | 2 | 0 | 1 | 0 | 69 | 56 | 5 | 8 | 0 | 1 | 8 |
| Arizona | 516 | 392 | 268 | 92 | 21 | 4 | 0 | 0 | 7 | 120 | 104 | 6 | 10 | 0 | 0 | 4 |
| Utah | 123 | 71 | 58 | 6 | 6 | 0 | 0 | 0 | 1 | 48 | 38 | 5 | 5 | 1 | 0 | 3 |
| Nevada | 356 | 275 | 173 | 70 | 22 | 3 | 1 | 0 | 6 | 80 | 42 | 31 | 7 | 0 | 0 | 1 |
| Mountain | 2,282 | 1,595 | 1,128 | 310 | 110 | 22 | 3 | 2 | 20 | 654 | 499 | 72 | 83 | 10 | 3 | 20 |
| Washington | 1,323 | 871 | 617 | 172 | 57 | 7 | 7 | 0 | 11 | 422 | 281 | 64 | 77 | 11 | 1 | 18 |
| Oregon | 558 | 276 | 192 | 41 | 28 | 10 | 3 | 0 | 2 | 264 | 172 | 53 | 39 | 9 | 0 | 9 |
| California | 6,755 | 4,696 | 3,014 | 1,154 | 322 | 59 | 46 | 10 | 91 | 1,983 | 1,534 | 191 | 258 | 40 | 6 | 30 |
| Alaska | 261 | 149 | 103 | 28 | 16 | 1 | 0 | 0 | 1 | 108 | 94 | 7 | 7 | 4 | 0 | 0 |
| Hawaii | 349 | 187 | 127 | 37 | 17 | 3 | 0 | 0 | 3 | 153 | 134 | 8 | 11 | 4 | 0 | 5 |
| Guam | 11 | 5 | 5 | 0 | 0 | 0 | 0 | 0 | 0 | 6 | 6 | 0 | 0 | 0 | 0 | 0 |
| Pacific | 9,257 | 6,184 | 4,058 | 1,432 | 440 | 80 | 56 | 10 | 108 | 2,936 | 2,221 | 323 | 392 | 68 | 7 | 62 |
| Puerto Rico | 344 | 169 | 114 | 31 | 13 | 5 | 1 | 0 | 5 | 167 | 141 | 6 | 20 | 7 | 1 | 0 |
| Virgin Islands | 26 | 11 | 8 | 3 | 0 | 0 | 0 | 0 | 0 | 15 | 15 | 0 | 0 | 0 | 0 | 0 |
| Outlying areas | 370 | 180 | 122 | 34 | 13 | 5 | 1 | 0 | 5 | 182 | 156 | 6 | 20 | 7 | 1 | 0 |
| Total, all States and areas | 49,335 | 34,509 | 23,496 | 8,097 | 1,819 | 446 | 115 | 92 | 444 | 14,189 | 11,846 | 886 | 1,457 | 235 | 64 | 338 |
- 1 See Glossary for definitions of terms.
- 2 The States are grouped according to the method used by the Bureau of the Census, U.S Department of Commerce
874 of 874 figures sit in a row or column sum that works out.
Reader’s notes
p. 230. The crop ends in the middle of the South Atlantic division: the last three printed rows (Delaware, Maryland, District of Columbia) are followed by the page break, so the remaining states, the division subtotal, the rest of the table and any footnotes printed beneath it are not on this image. No footnote texts appear on the crop, so `footnotes` is empty. Stub heading: the raised footnote marker after "Division and State" is a small digit that is partly broken in the scan; it is most likely a 2 (transcribed as ^2), but it could be a 3. The caption's own marker (Fiscal Year 1976 ^1) is omitted with the caption. "Nebraksa" is transcribed exactly as printed; it is an apparent typesetting misprint for "Nebraska". Every row and every division subtotal cross-checks arithmetically (C components sum to All C, R components to All R, and All C + All R + UD + AC + UC = All cases; state rows sum to each division line), so column alignment and digits are well supported.
p. 231. This crop is a continuation page: no column headings are printed on it, so header_rows is empty. The grid has 17 columns (stub + 16 numeric). The table is also continued from the previous page at the top: the first visible row is Virginia, so the "South Atlantic" subtotal row covers states (Delaware, Maryland, District of Columbia) that are not on this crop and therefore does not sum to the six South Atlantic rows shown here. Likewise the "Total, all States and areas" row covers the whole table, not just this page. Every other subtotal row shown (East South Central, West South Central, Mountain, Pacific, Outlying areas) was checked and reconciles exactly with its member rows in all 16 numeric columns. Louisiana, column 11 (value 137): a small stray mark sits immediately to the left of the digits in the scan. It is not a footnote marker — the West South Central subtotal for that column (679 = 80+137+120+342) confirms the value is plain 137 — so it is transcribed without a marker. Several row labels show dotless "i" glyphs in the scan (rendering as "Virginia"/"Mississippi"/"Louisiana"/"Wyoming"/"Hawaii" with broken dots); these are scan artifacts and the standard spellings are given. Footnote 2 as printed shows a faint/absent period after the "S" in "U.S." and no terminal period at the end of the sentence; it is transcribed as it appears on the image.
Source image
Source data: U.S. NLRB Annual Reports (public domain). Reconstruction by NLRB Stats Archive. Read by claude-opus-5 (effort max, prompt extract_v1) from the 300-dpi scan; stitched by page. Updated October 2026.