NLRB Stats Archive › Annual Reports › FY1976 › Unfair labor practice cases received, closed, and pending
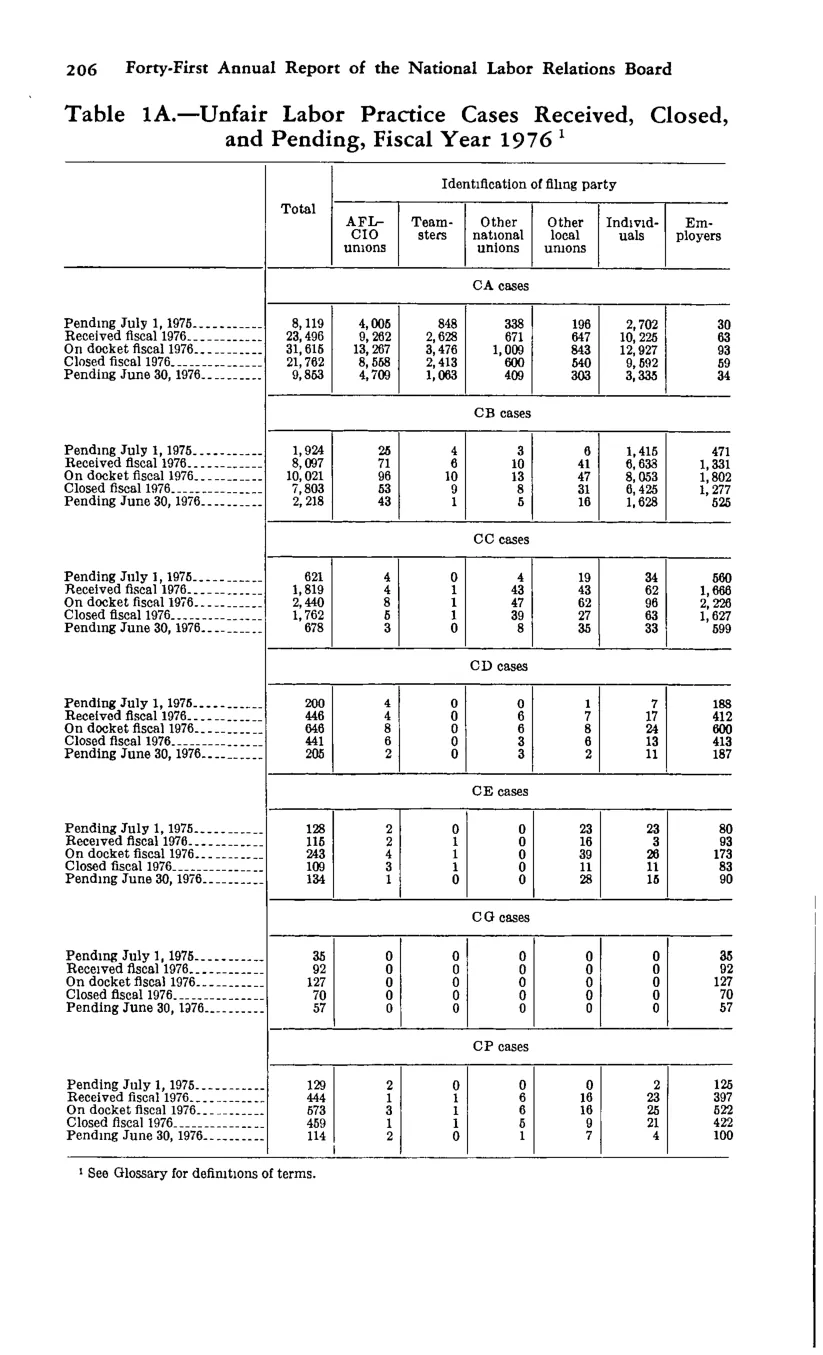
Unfair labor practice cases received, closed, and pending
| Total | Identification of filing party | Identification of filing party | Identification of filing party | Identification of filing party | Identification of filing party | Identification of filing party | |
|---|---|---|---|---|---|---|---|
| Total | AFL-CIO unions | Teamsters | Other national unions | Other local unions | Individuals | Employers | |
| CA cases — Pending July 1, 1975 | 8,119 | 4,005 | 848 | 338 | 196 | 2,702 | 30 |
| CA cases — Received fiscal 1976 | 23,496 | 9,262 | 2,628 | 671 | 647 | 10,225 | 63 |
| CA cases — On docket fiscal 1976 | 31,615 | 13,267 | 3,476 | 1,009 | 843 | 12,927 | 93 |
| CA cases — Closed fiscal 1976 | 21,762 | 8,558 | 2,413 | 600 | 540 | 9,592 | 59 |
| CA cases — Pending June 30, 1976 | 9,853 | 4,709 | 1,063 | 409 | 303 | 3,335 | 34 |
| CB cases — Pending July 1, 1975 | 1,924 | 25 | 4 | 3 | 6 | 1,415 | 471 |
| CB cases — Received fiscal 1976 | 8,097 | 71 | 6 | 10 | 41 | 6,638 | 1,331 |
| CB cases — On docket fiscal 1976 | 10,021 | 96 | 10 | 13 | 47 | 8,053 | 1,802 |
| CB cases — Closed fiscal 1976 | 7,803 | 53 | 9 | 8 | 31 | 6,425 | 1,277 |
| CB cases — Pending June 30, 1976 | 2,218 | 43 | 1 | 5 | 16 | 1,628 | 525 |
| CC cases — Pending July 1, 1975 | 621 | 4 | 4 | 19 | 34 | 560 | |
| CC cases — Received fiscal 1976 | 1,819 | 4 | 4 | 43 | 43 | 29 | 1,696 |
| CC cases — On docket fiscal 1976 | 2,440 | 8 | 4 | 47 | 62 | 63 | 2,256 |
| CC cases — Closed fiscal 1976 | 1,762 | 4 | 1 | 27 | 35 | 68 | 1,627 |
| CC cases — Pending June 30, 1976 | 678 | 4 | 3 | 20 | 27 | 35 | 589 |
| CD cases — Pending July 1, 1975 | 200 | 4 | 1 | 7 | 188 | ||
| CD cases — Received fiscal 1976 | 446 | 4 | 6 | 7 | 17 | 412 | |
| CD cases — On docket fiscal 1976 | 646 | 8 | 6 | 8 | 24 | 600 | |
| CD cases — Closed fiscal 1976 | 441 | 6 | 4 | 5 | 13 | 413 | |
| CD cases — Pending June 30, 1976 | 205 | 2 | 2 | 3 | 11 | 187 | |
| CE cases — Pending July 1, 1975 | 128 | 2 | 23 | 23 | 80 | ||
| CE cases — Received fiscal 1976 | 116 | 2 | 1 | 16 | 3 | 93 | |
| CE cases — On docket fiscal 1976 | 243 | 4 | 1 | 39 | 26 | 173 | |
| CE cases — Closed fiscal 1976 | 143 | 1 | 28 | 11 | 83 | ||
| CE cases — Pending June 30, 1976 | 109 | 3 | 1 | 11 | 5 | 90 | |
| CG cases — Pending July 1, 1975 | 35 | 35 | |||||
| CG cases — Received fiscal 1976 | 92 | 92 | |||||
| CG cases — On docket fiscal 1976 | 127 | 127 | |||||
| CG cases — Closed fiscal 1976 | 70 | 70 | |||||
| CG cases — Pending June 30, 1976 | 57 | 57 | |||||
| CP cases — Pending July 1, 1975 | 129 | 2 | 2 | 125 | |||
| CP cases — Received fiscal 1976 | 444 | 1 | 12 | 21 | 13 | 397 | |
| CP cases — On docket fiscal 1976 | 573 | 3 | 12 | 21 | 15 | 522 | |
| CP cases — Closed fiscal 1976 | 459 | 1 | 9 | 12 | 10 | 427 | |
| CP cases — Pending June 30, 1976 | 114 | 2 | 3 | 9 | 5 | 95 |
Source image
Source data: U.S. NLRB Annual Reports (public domain). Reconstruction by NLRB Stats Archive. Updated June 2026.