NLRB Stats Archive › Annual Reports › FY1975 › Proceedings Decided by Circuit Courts of Appeals on Petitions for Enforcement and/or Review of Board Orders, Fiscal Year 1975, Compared With 5-Year Cumulative Totals, Fiscal Years 1970 through 1974
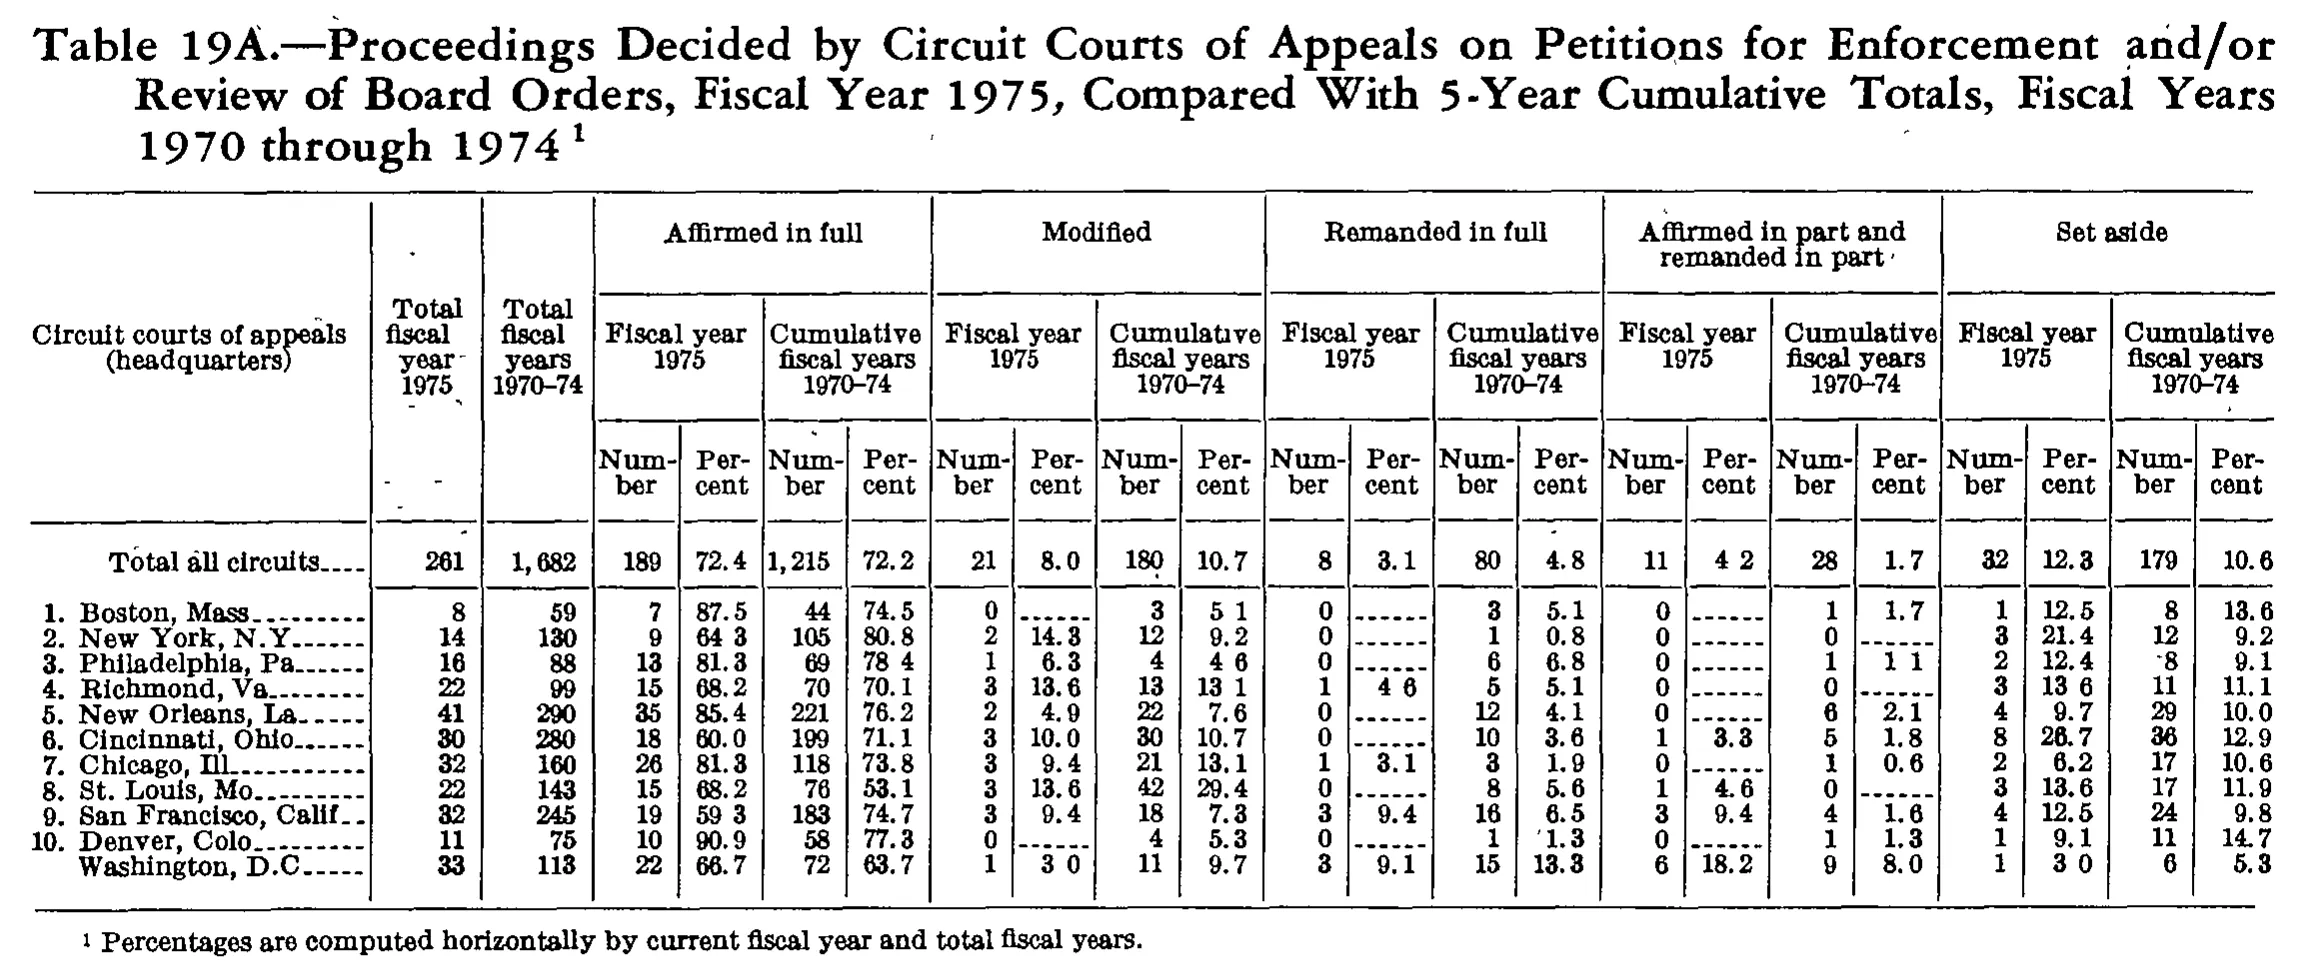
Proceedings Decided by Circuit Courts of Appeals on Petitions for Enforcement and/or Review of Board Orders, Fiscal Year 1975, Compared With 5-Year Cumulative Totals, Fiscal Years 1970 through 1974
| Circuit courts of appeals (headquarters) | Total fiscal year 1975 | Total fiscal years 1970-74 | Affirmed in full | Modified | Remanded in full | Affirmed in part and remanded in part | Set aside | |||||||||||||||
|---|---|---|---|---|---|---|---|---|---|---|---|---|---|---|---|---|---|---|---|---|---|---|
| Circuit courts of appeals (headquarters) | Total fiscal year 1975 | Total fiscal years 1970-74 | Fiscal year 1975 | Cumulative fiscal years 1970-74 | Fiscal year 1975 | Cumulative fiscal years 1970-74 | Fiscal year 1975 | Cumulative fiscal years 1970-74 | Fiscal year 1975 | Cumulative fiscal years 1970-74 | Fiscal year 1975 | Cumulative fiscal years 1970-74 | ||||||||||
| Circuit courts of appeals (headquarters) | Total fiscal year 1975 | Total fiscal years 1970-74 | Number | Percent | Number | Percent | Number | Percent | Number | Percent | Number | Percent | Number | Percent | Number | Percent | Number | Percent | Number | Percent | Number | Percent |
| Total all circuits | 261 | 1,682 | 189 | 72.4 | 1,215 | 72.2 | 21 | 8.0 | 180 | 10.7 | 8 | 3.1 | 80 | 4.8 | 11 | 4.2 | 28 | 1.7 | 32 | 12.3 | 179 | 10.6 |
| 1. Boston, Mass. | 8 | 59 | 7 | 87.5 | 44 | 74.5 | 0 | 3 | 5.1 | 0 | 3 | 5.1 | 0 | 1 | 1.7 | 1 | 12.5 | 8 | 13.6 | |||
| 2. New York, N.Y. | 14 | 130 | 9 | 64.3 | 105 | 80.8 | 2 | 14.3 | 12 | 9.2 | 0 | 1 | 0.8 | 0 | 0 | 3 | 21.4 | 12 | 9.2 | |||
| 3. Philadelphia, Pa. | 16 | 88 | 13 | 81.3 | 69 | 78.4 | 1 | 6.3 | 4 | 4.6 | 0 | 6 | 6.8 | 0 | 1 | 1.1 | 2 | 12.4 | 8 | 9.1 | ||
| 4. Richmond, Va. | 22 | 99 | 15 | 68.2 | 70 | 70.1 | 3 | 13.6 | 13 | 13.1 | 1 | 4.6 | 5 | 5.1 | 0 | 0 | 3 | 13.6 | 11 | 11.1 | ||
| 5. New Orleans, La. | 41 | 290 | 35 | 85.4 | 221 | 76.2 | 2 | 4.9 | 22 | 7.6 | 0 | 12 | 4.1 | 0 | 6 | 2.1 | 4 | 9.7 | 29 | 10.0 | ||
| 6. Cincinnati, Ohio | 30 | 280 | 18 | 60.0 | 199 | 71.1 | 3 | 10.0 | 30 | 10.7 | 0 | 10 | 3.6 | 1 | 3.3 | 5 | 1.8 | 8 | 26.7 | 36 | 12.9 | |
| 7. Chicago, Ill. | 32 | 160 | 26 | 81.3 | 118 | 73.8 | 3 | 9.4 | 21 | 13.1 | 1 | 3.1 | 3 | 1.9 | 0 | 1 | 0.6 | 2 | 6.2 | 17 | 10.6 | |
| 8. St. Louis, Mo. | 22 | 143 | 15 | 68.2 | 76 | 53.1 | 3 | 13.6 | 42 | 29.4 | 0 | 8 | 5.6 | 1 | 4.6 | 0 | 3 | 13.6 | 17 | 11.9 | ||
| 9. San Francisco, Calif. | 32 | 245 | 19 | 59.3 | 183 | 74.7 | 3 | 9.4 | 18 | 7.3 | 3 | 9.4 | 16 | 6.5 | 3 | 9.4 | 4 | 1.6 | 4 | 12.5 | 24 | 9.8 |
| 10. Denver, Colo. | 11 | 75 | 10 | 90.9 | 58 | 77.3 | 0 | 4 | 5.3 | 0 | 1 | 1.3 | 0 | 1 | 1.3 | 1 | 9.1 | 11 | 14.7 | |||
| Washington, D.C. | 33 | 113 | 22 | 66.7 | 72 | 63.7 | 1 | 3.0 | 11 | 9.7 | 3 | 9.1 | 15 | 13.3 | 6 | 18.2 | 9 | 8.0 | 1 | 3.0 | 6 | 5.3 |
- 1 Percentages are computed horizontally by current fiscal year and total fiscal years.
125 of 125 figures sit in a row or column sum that works out.
Reader’s notes
p. 263. 23 columns: stub, two "Total" columns, then five outcome blocks (Affirmed in full; Modified; Remanded in full; Affirmed in part and remanded in part; Set aside), each with Number/Percent for fiscal year 1975 and for cumulative fiscal years 1970-74. The last stub entry, "Washington, D.C.", is printed without a sequence number (rows 1-10 are numbered); transcribed as printed. Every "Percent" cell holding a dash rule ("------") is rendered as "". All count columns were checked against the printed "Total all circuits" row and all 23 columns sum exactly, so the integers are solid. Faded decimal points: in this scan many percent values print with the decimal point dropped out, showing as a gap (e.g. "64 3", "5 1", "4 2", "78 4", "13 1", "59 3", "3 0", "1 1", "13 6", "4 6"). Since every value in these columns carries one decimal place, these have been written with the decimal point restored (64.3, 5.1, 4.2, etc.). Doubtful digits (the scan is coarse and 1/7, 4/5, 5/6, 6/8 are hard to separate). Each is transcribed as best read; where the row's own arithmetic implies a different digit, that is given for the reader to check: - "4. Richmond, Va.", Affirmed in full / Cumulative 1970-74 / Percent: read as 70.1; 70 of 99 would be 70.7. - "3. Philadelphia, Pa.", Set aside / Fiscal year 1975 / Percent: read as 12.4; 2 of 16 would be 12.5. - "3. Philadelphia, Pa.", Modified / Cumulative 1970-74 / Percent: read as 4.6; 4 of 88 would be 4.5. - "4. Richmond, Va.", Remanded in full / Fiscal year 1975 / Percent: read as 4.6; 1 of 22 would be 4.5. - "8. St. Louis, Mo.", Affirmed in part and remanded in part / Fiscal year 1975 / Percent: read as 4.6; 1 of 22 would be 4.5. - "6. Cincinnati, Ohio", Set aside / Fiscal year 1975 / Percent: the middle digit could be 6 or 8; read as 26.7, which matches 8 of 30. - "3. Philadelphia, Pa.", Set aside / Cumulative 1970-74 / Number: a stray ink mark precedes the digit; the value is 8 (confirmed by the column total of 179). Minor rounding inconsistencies in the printed percentages (transcribed as printed, not corrected): 44 of 59 printed as 74.5 (rounds to 74.6); 4 of 41 printed as 9.7 (rounds to 9.8); 2 of 32 printed as 6.2 and 19 of 32 printed as 59.3 (both truncated rather than rounded), while 13 of 16 and 26 of 32 are printed as 81.3 (rounded up). The caption ("Table 19A.—Proceedings Decided by Circuit Courts of Appeals ... Fiscal Years 1970 through 1974 1") carries footnote marker 1 and is excluded as instructed. No part of the table appears cut off by the crop.
Source image
Source data: U.S. NLRB Annual Reports (public domain). Reconstruction by NLRB Stats Archive. Read by claude-opus-5 (effort max, prompt extract_v1) from the 300-dpi scan; stitched by page. Updated October 2026.