NLRB Stats Archive › Annual Reports › FY1975 › Distribution of Unfair Labor Practice Situations Received, by Number of Employees in Establishments, Fiscal Year 1975
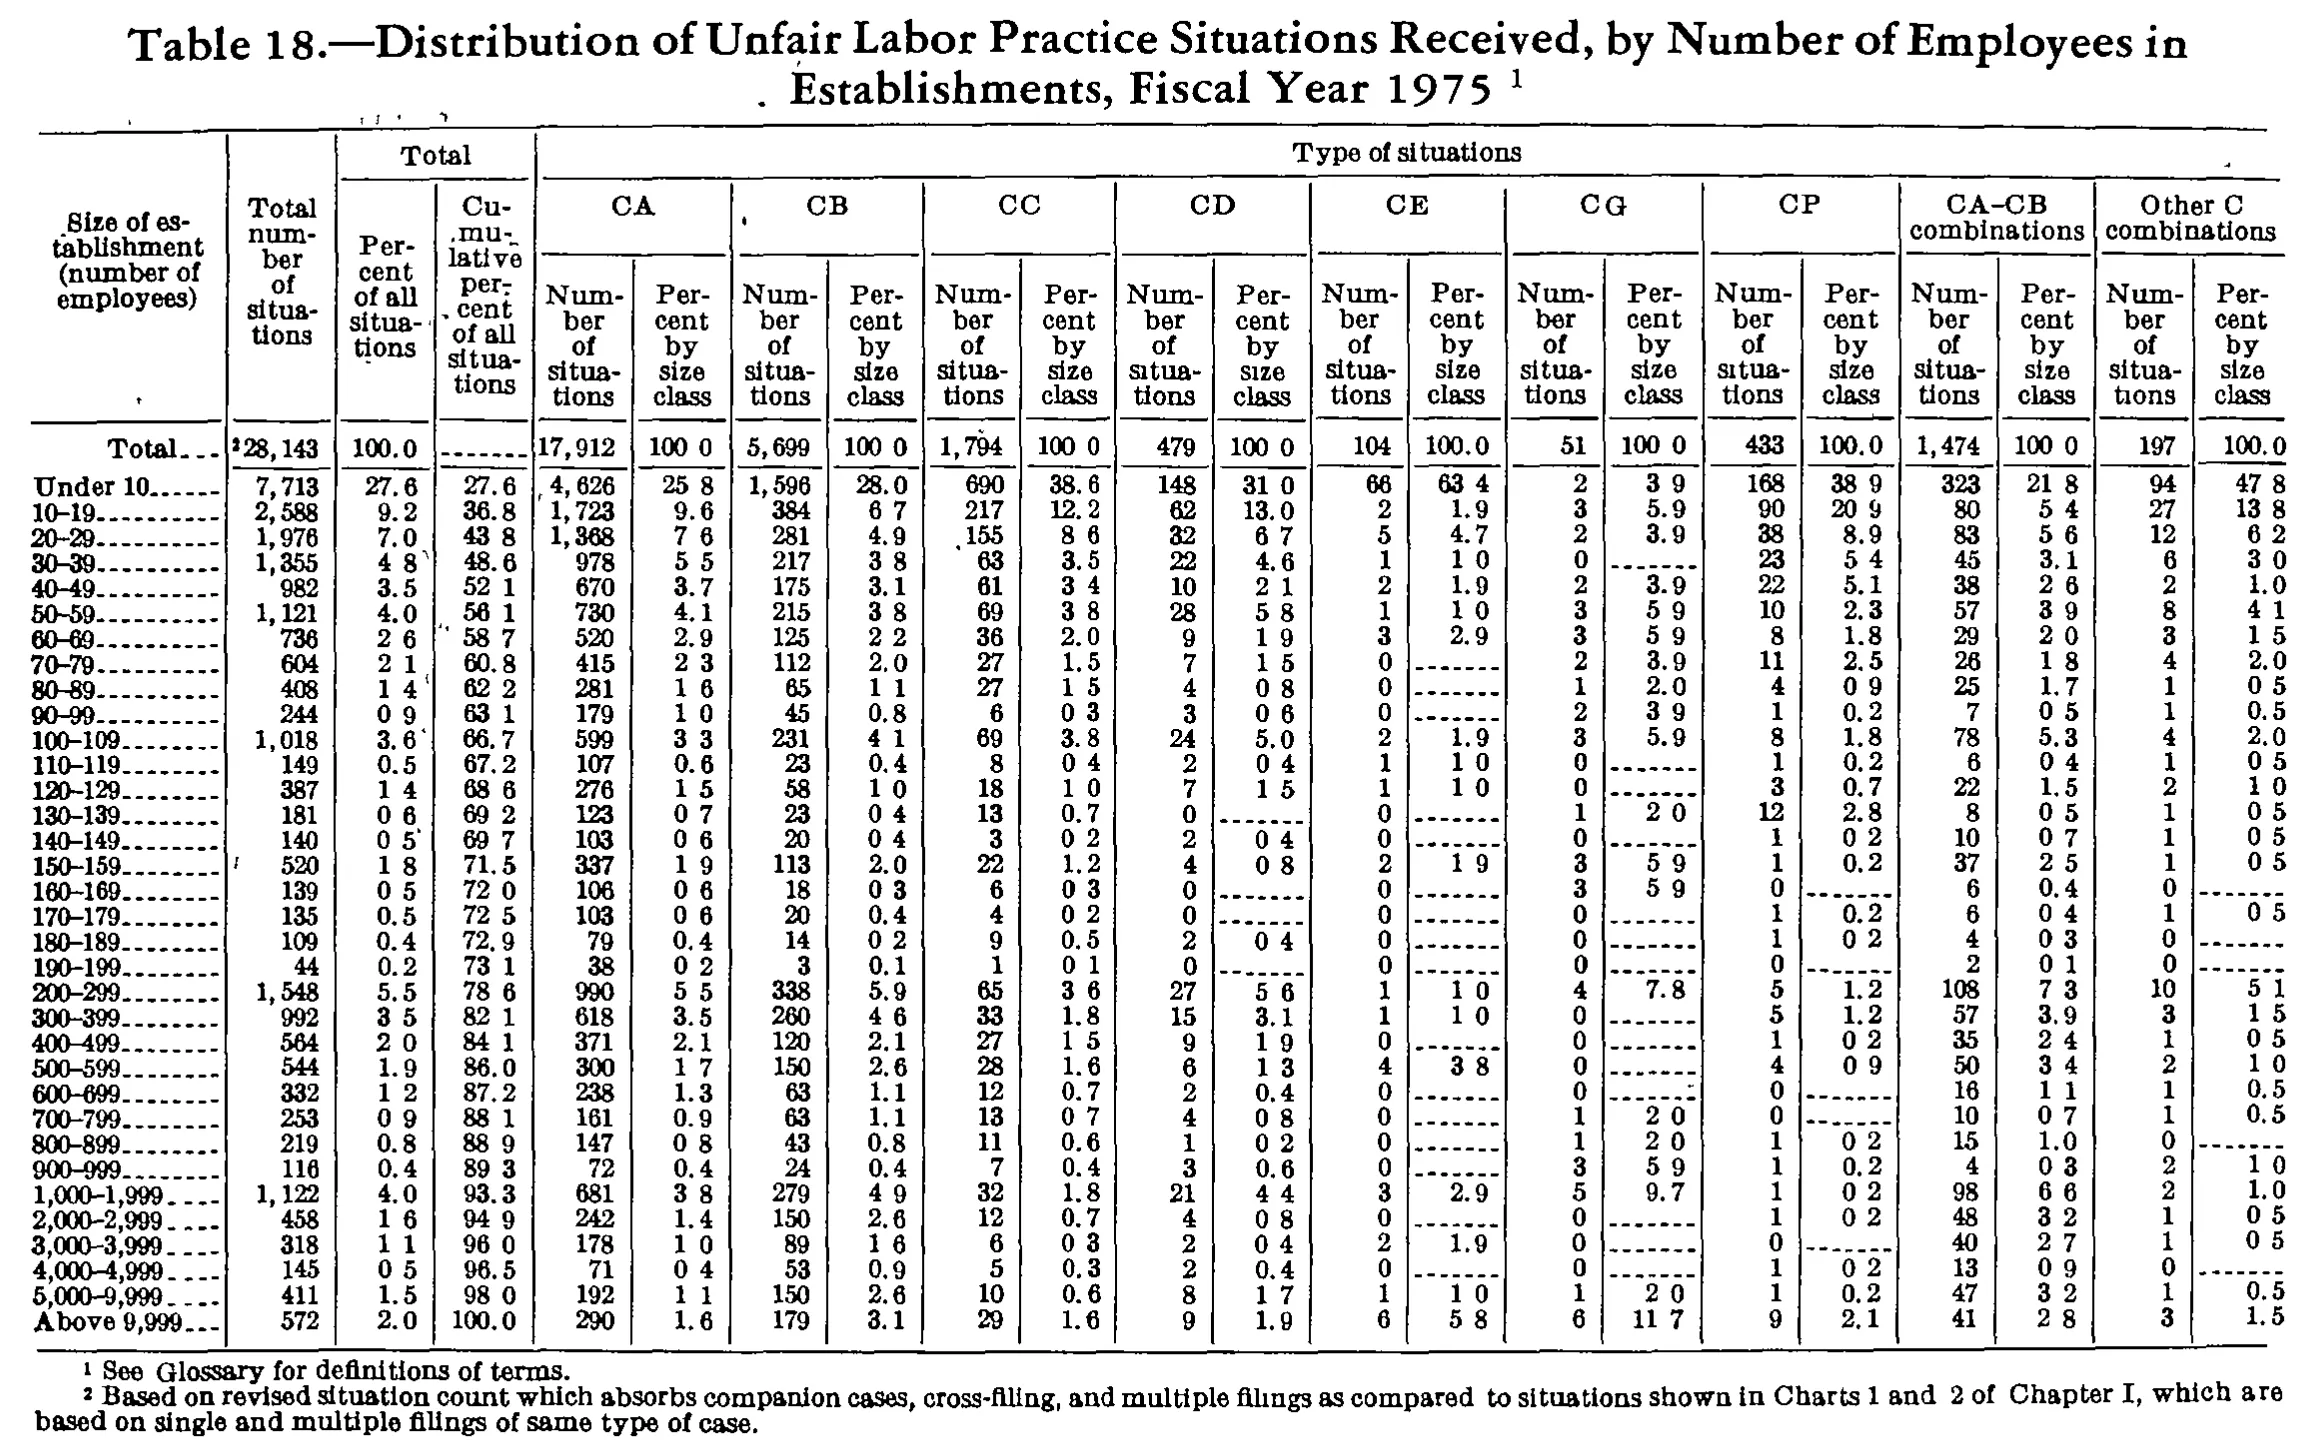
Distribution of Unfair Labor Practice Situations Received, by Number of Employees in Establishments, Fiscal Year 1975
| Size of establishment (number of employees) | Total number of situations | Total | Type of situations | ||||||||||||||||||
|---|---|---|---|---|---|---|---|---|---|---|---|---|---|---|---|---|---|---|---|---|---|
| Size of establishment (number of employees) | Total number of situations | Percent of all situations | Cumulative percent of all situations | CA | CB | CC | CD | CE | CG | CP | CA-CB combinations | Other C combinations | |||||||||
| Size of establishment (number of employees) | Total number of situations | Percent of all situations | Cumulative percent of all situations | Number of situations | Percent by size class | Number of situations | Percent by size class | Number of situations | Percent by size class | Number of situations | Percent by size class | Number of situations | Percent by size class | Number of situations | Percent by size class | Number of situations | Percent by size class | Number of situations | Percent by size class | Number of situations | Percent by size class |
| Total | 28,143 | 100.0 | 17,912 | 100.0 | 5,699 | 100.0 | 1,794 | 100.0 | 479 | 100.0 | 104 | 100.0 | 51 | 100.0 | 433 | 100.0 | 1,474 | 100.0 | 197 | 100.0 | |
| Under 10 | 7,713 | 27.6 | 27.6 | 4,626 | 25.8 | 1,596 | 28.0 | 690 | 38.6 | 148 | 31.0 | 66 | 63.4 | 2 | 3.9 | 168 | 38.9 | 323 | 21.8 | 94 | 47.8 |
| 10-19 | 2,588 | 9.2 | 36.8 | 1,723 | 9.6 | 384 | 6.7 | 217 | 12.2 | 62 | 13.0 | 2 | 1.9 | 3 | 5.9 | 90 | 20.9 | 80 | 5.4 | 27 | 13.8 |
| 20-29 | 1,976 | 7.0 | 43.8 | 1,368 | 7.6 | 281 | 4.9 | 155 | 8.6 | 32 | 6.7 | 5 | 4.7 | 2 | 3.9 | 38 | 8.9 | 83 | 5.6 | 12 | 6.2 |
| 30-39 | 1,355 | 4.8 | 48.6 | 978 | 5.5 | 217 | 3.8 | 63 | 3.5 | 22 | 4.6 | 1 | 1.0 | 0 | 23 | 5.4 | 45 | 3.1 | 6 | 3.0 | |
| 40-49 | 982 | 3.5 | 52.1 | 670 | 3.7 | 175 | 3.1 | 61 | 3.4 | 10 | 2.1 | 2 | 1.9 | 2 | 3.9 | 22 | 5.1 | 38 | 2.6 | 2 | 1.0 |
| 50-59 | 1,121 | 4.0 | 56.1 | 730 | 4.1 | 215 | 3.8 | 69 | 3.8 | 28 | 5.8 | 1 | 1.0 | 3 | 5.9 | 10 | 2.3 | 57 | 3.9 | 8 | 4.1 |
| 60-69 | 736 | 2.6 | 58.7 | 520 | 2.9 | 125 | 2.2 | 36 | 2.0 | 9 | 1.9 | 3 | 2.9 | 3 | 5.9 | 8 | 1.8 | 29 | 2.0 | 3 | 1.5 |
| 70-79 | 604 | 2.1 | 60.8 | 415 | 2.3 | 112 | 2.0 | 27 | 1.5 | 7 | 1.5 | 0 | 2 | 3.9 | 11 | 2.5 | 26 | 1.8 | 4 | 2.0 | |
| 80-89 | 408 | 1.4 | 62.2 | 281 | 1.6 | 65 | 1.1 | 27 | 1.5 | 4 | 0.8 | 0 | 1 | 2.0 | 4 | 0.9 | 25 | 1.7 | 1 | 0.5 | |
| 90-99 | 244 | 0.9 | 63.1 | 179 | 1.0 | 45 | 0.8 | 6 | 0.3 | 3 | 0.6 | 0 | 2 | 3.9 | 1 | 0.2 | 7 | 0.5 | 1 | 0.5 | |
| 100-109 | 1,018 | 3.6 | 66.7 | 599 | 3.3 | 231 | 4.1 | 69 | 3.8 | 24 | 5.0 | 2 | 1.9 | 3 | 5.9 | 8 | 1.8 | 78 | 5.3 | 4 | 2.0 |
| 110-119 | 149 | 0.5 | 67.2 | 107 | 0.6 | 23 | 0.4 | 8 | 0.4 | 2 | 0.4 | 1 | 1.0 | 0 | 1 | 0.2 | 6 | 0.4 | 1 | 0.5 | |
| 120-129 | 387 | 1.4 | 68.6 | 276 | 1.5 | 58 | 1.0 | 18 | 1.0 | 7 | 1.5 | 1 | 1.0 | 0 | 3 | 0.7 | 22 | 1.5 | 2 | 1.0 | |
| 130-139 | 181 | 0.6 | 69.2 | 123 | 0.7 | 23 | 0.4 | 13 | 0.7 | 0 | 0 | 1 | 2.0 | 12 | 2.8 | 8 | 0.5 | 1 | 0.5 | ||
| 140-149 | 140 | 0.5 | 69.7 | 103 | 0.6 | 20 | 0.4 | 3 | 0.2 | 2 | 0.4 | 0 | 0 | 1 | 0.2 | 10 | 0.7 | 1 | 0.5 | ||
| 150-159 | 520 | 1.8 | 71.5 | 337 | 1.9 | 113 | 2.0 | 22 | 1.2 | 4 | 0.8 | 2 | 1.9 | 3 | 5.9 | 1 | 0.2 | 37 | 2.5 | 1 | 0.5 |
| 160-169 | 139 | 0.5 | 72.0 | 106 | 0.6 | 18 | 0.3 | 6 | 0.3 | 0 | 0 | 3 | 5.9 | 0 | 6 | 0.4 | 0 | ||||
| 170-179 | 135 | 0.5 | 72.5 | 103 | 0.6 | 20 | 0.4 | 4 | 0.2 | 0 | 0 | 0 | 1 | 0.2 | 6 | 0.4 | 1 | 0.5 | |||
| 180-189 | 109 | 0.4 | 72.9 | 79 | 0.4 | 14 | 0.2 | 9 | 0.5 | 2 | 0.4 | 0 | 0 | 1 | 0.2 | 4 | 0.3 | 0 | |||
| 190-199 | 44 | 0.2 | 73.1 | 38 | 0.2 | 3 | 0.1 | 1 | 0.1 | 0 | 0 | 0 | 0 | 2 | 0.1 | 0 | |||||
| 200-299 | 1,548 | 5.5 | 78.6 | 990 | 5.5 | 338 | 5.9 | 65 | 3.6 | 27 | 5.6 | 1 | 1.0 | 4 | 7.8 | 5 | 1.2 | 108 | 7.3 | 10 | 5.1 |
| 300-399 | 992 | 3.5 | 82.1 | 618 | 3.5 | 260 | 4.6 | 33 | 1.8 | 15 | 3.1 | 1 | 1.0 | 0 | 5 | 1.2 | 57 | 3.9 | 3 | 1.5 | |
| 400-499 | 564 | 2.0 | 84.1 | 371 | 2.1 | 120 | 2.1 | 27 | 1.5 | 9 | 1.9 | 0 | 0 | 1 | 0.2 | 35 | 2.4 | 1 | 0.5 | ||
| 500-599 | 544 | 1.9 | 86.0 | 300 | 1.7 | 150 | 2.6 | 28 | 1.6 | 6 | 1.3 | 4 | 3.8 | 0 | 4 | 0.9 | 50 | 3.4 | 2 | 1.0 | |
| 600-699 | 332 | 1.2 | 87.2 | 238 | 1.3 | 63 | 1.1 | 12 | 0.7 | 2 | 0.4 | 0 | 0 | 0 | 16 | 1.1 | 1 | 0.5 | |||
| 700-799 | 253 | 0.9 | 88.1 | 161 | 0.9 | 63 | 1.1 | 13 | 0.7 | 4 | 0.8 | 0 | 1 | 2.0 | 0 | 10 | 0.7 | 1 | 0.5 | ||
| 800-899 | 219 | 0.8 | 88.9 | 147 | 0.8 | 43 | 0.8 | 11 | 0.6 | 1 | 0.2 | 0 | 1 | 2.0 | 1 | 0.2 | 15 | 1.0 | 0 | ||
| 900-999 | 116 | 0.4 | 89.3 | 72 | 0.4 | 24 | 0.4 | 7 | 0.4 | 3 | 0.6 | 0 | 3 | 5.9 | 1 | 0.2 | 4 | 0.3 | 2 | 1.0 | |
| 1,000-1,999 | 1,122 | 4.0 | 93.3 | 681 | 3.8 | 279 | 4.9 | 32 | 1.8 | 21 | 4.4 | 3 | 2.9 | 5 | 9.7 | 1 | 0.2 | 98 | 6.6 | 2 | 1.0 |
| 2,000-2,999 | 458 | 1.6 | 94.9 | 242 | 1.4 | 150 | 2.6 | 12 | 0.7 | 4 | 0.8 | 0 | 0 | 1 | 0.2 | 48 | 3.2 | 1 | 0.5 | ||
| 3,000-3,999 | 318 | 1.1 | 96.0 | 178 | 1.0 | 89 | 1.6 | 6 | 0.3 | 2 | 0.4 | 2 | 1.9 | 0 | 0 | 40 | 2.7 | 1 | 0.5 | ||
| 4,000-4,999 | 145 | 0.5 | 96.5 | 71 | 0.4 | 53 | 0.9 | 5 | 0.3 | 2 | 0.4 | 0 | 0 | 1 | 0.2 | 13 | 0.9 | 0 | |||
| 5,000-9,999 | 411 | 1.5 | 98.0 | 192 | 1.1 | 150 | 2.6 | 10 | 0.6 | 8 | 1.7 | 1 | 1.0 | 1 | 2.0 | 1 | 0.2 | 47 | 3.2 | 1 | 0.5 |
| Above 9,999 | 572 | 2.0 | 100.0 | 290 | 1.6 | 179 | 3.1 | 29 | 1.6 | 9 | 1.9 | 6 | 5.8 | 6 | 11.7 | 9 | 2.1 | 41 | 2.8 | 3 | 1.5 |
- 1 See Glossary for definitions of terms.
- 2 Based on revised situation count which absorbs companion cases, cross-filing, and multiple filings as compared to situations shown in Charts 1 and 2 of Chapter I, which are based on single and multiple filings of same type of case.
306 of 306 figures sit in a row or column sum that works out.
Reader’s notes
p. 261. Decimal points: in this 1-bit scan many decimal points in the percent columns dropped out and print as a gap (e.g. "100 0", "25 8", "27 6"). Every one of those columns is a one-decimal percentage, so the points have been restored (100.0, 25.8, 27.6). No digits were changed. Column alignment in the CE/CG/CP block was ambiguous in several sparse rows (170-179, 180-189, 190-199, 4,000-4,999, 800-899, 900-999) because zeros and dash rules print faintly. Alignment was settled by checking each column against its printed total; with the values as transcribed, all ten count columns sum exactly to their printed totals (28,143; 17,912; 5,699; 1,794; 479; 104; 51; 433; 1,474; 197), and the cumulative-percent column is consistent step by step with the percent-of-all column (27.6 + 9.2 = 36.8, ... , 98.0 + 2.0 = 100.0). In those rows the lone "1 / 0.2" entry sits in CP, not CG, and CG is 0. Empty cells: a dash rule ("------") in a percent cell, which accompanies a count of 0, is transcribed as "". In a few rows (e.g. CE percent for 160-169 and 190-199, CG percent for 500-599 and 4,000-4,999) the rule is broken or missing in the scan; those cells are blank either way. Printed percentages do not always reconcile with the counts shown: e.g. "Under 10" is 27.6 percent of all situations although 7,713/28,143 = 27.4, and CC "Under 10" is 38.6 although 690/1,794 = 38.5. The implied base for the percent-of-all column is about 27,950 rather than the revised 28,143 carried in the stub column (see footnote 2). Values are transcribed as printed. The total for "Total number of situations" carries a raised 2 printed to the left of the figure; it is recorded as 28,143^2. The CC entry for row 20-29 is printed with a stray leader dot in front (".155"); transcribed as 155.
Source image
Source data: U.S. NLRB Annual Reports (public domain). Reconstruction by NLRB Stats Archive. Read by claude-opus-5 (effort max, prompt extract_v1) from the 300-dpi scan; stitched by page. Updated October 2026.