NLRB Stats Archive › Annual Reports › FY1975 › Size of Units in Representation Election Cases Closed, Fiscal Year 1975 1 Elections in Elections in which representation nights were won by
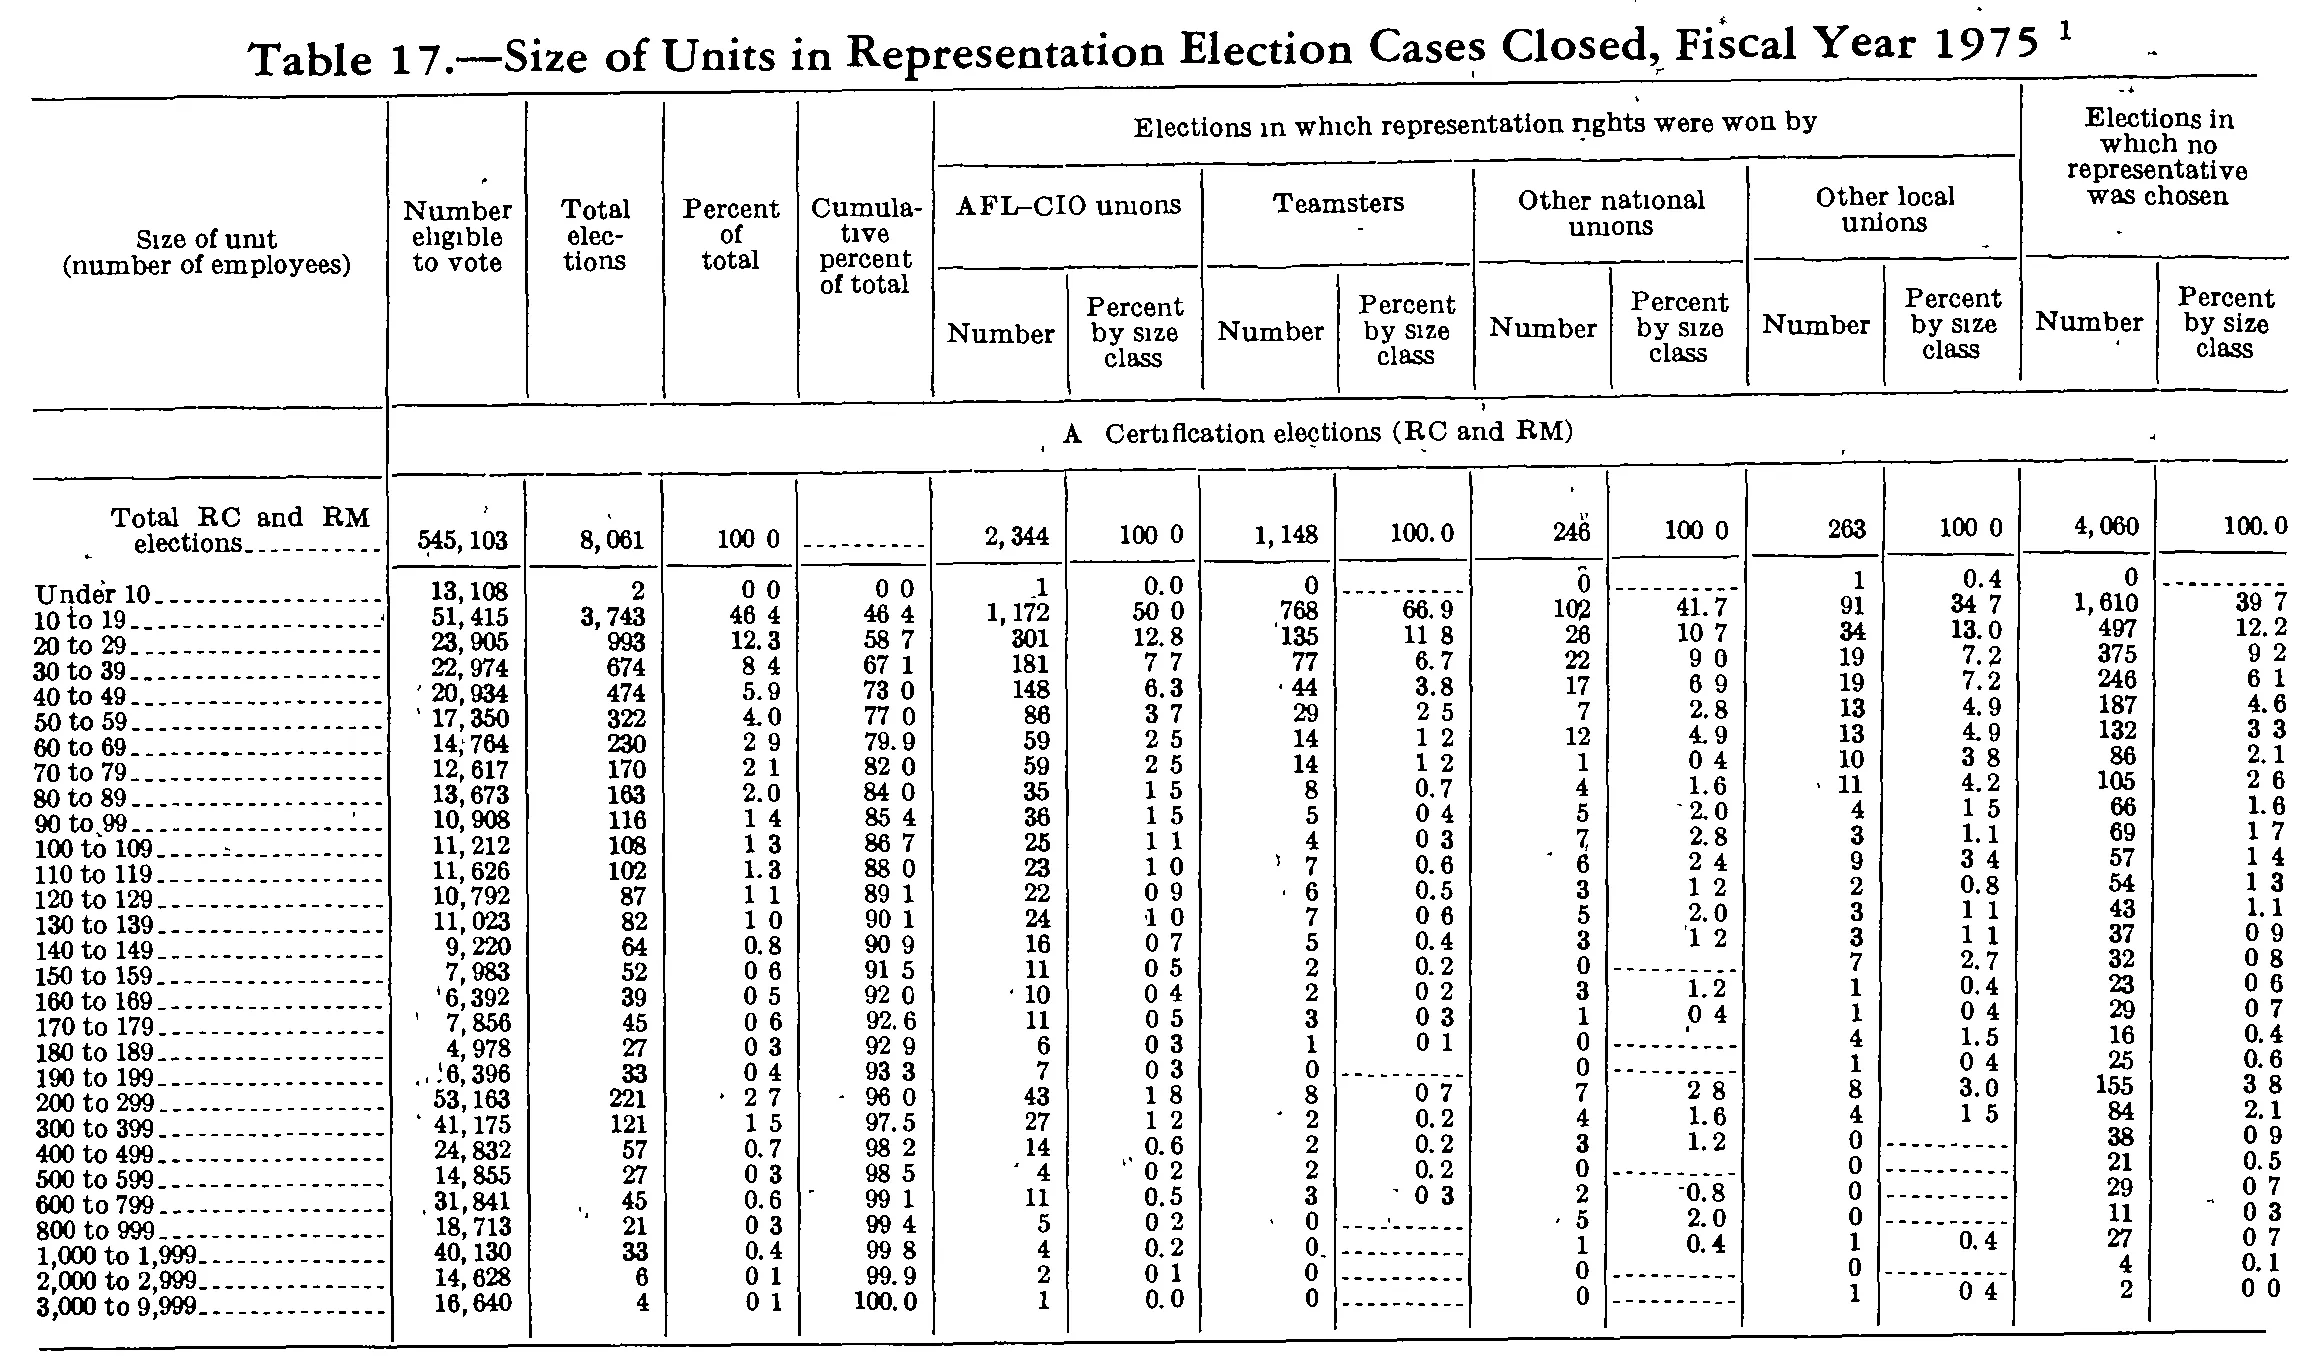
Size of Units in Representation Election Cases Closed, Fiscal Year 1975 1 Elections in Elections in which representation nights were won by
Stitched from pp. 259–260.
| Size of unit (number of employees) | Number eligible to vote | Total elections | Percent of total | Cumulative percent of total | Elections in which representation rights were won by | Elections in which no representative was chosen | ||||||||
|---|---|---|---|---|---|---|---|---|---|---|---|---|---|---|
| Size of unit (number of employees) | Number eligible to vote | Total elections | Percent of total | Cumulative percent of total | AFL-CIO unions | Teamsters | Other national unions | Other local unions | Elections in which no representative was chosen | |||||
| Size of unit (number of employees) | Number eligible to vote | Total elections | Percent of total | Cumulative percent of total | Number | Percent by size class | Number | Percent by size class | Number | Percent by size class | Number | Percent by size class | Number | Percent by size class |
| A. Certification elections (RC and RM) | ||||||||||||||
| Total RC and RM elections | 545,103 | 8,061 | 100.0 | 2,344 | 100.0 | 1,148 | 100.0 | 246 | 100.0 | 263 | 100.0 | 4,060 | 100.0 | |
| Under 10 | 13,108 | 2 | 0.0 | 0.0 | 1 | 0.0 | 0 | 0 | 1 | 0.4 | 0 | |||
| 10 to 19 | 51,415 | 3,743 | 46.4 | 46.4 | 1,172 | 50.0 | 768 | 66.9 | 102 | 41.7 | 91 | 34.7 | 1,610 | 39.7 |
| 20 to 29 | 23,905 | 993 | 12.3 | 58.7 | 301 | 12.8 | 135 | 11.8 | 26 | 10.7 | 34 | 13.0 | 497 | 12.2 |
| 30 to 39 | 22,974 | 674 | 8.4 | 67.1 | 181 | 7.7 | 77 | 6.7 | 22 | 9.0 | 19 | 7.2 | 375 | 9.2 |
| 40 to 49 | 20,934 | 474 | 5.9 | 73.0 | 148 | 6.3 | 44 | 3.8 | 17 | 6.9 | 19 | 7.2 | 246 | 6.1 |
| 50 to 59 | 17,350 | 322 | 4.0 | 77.0 | 86 | 3.7 | 29 | 2.5 | 7 | 2.8 | 13 | 4.9 | 187 | 4.6 |
| 60 to 69 | 14,764 | 230 | 2.9 | 79.9 | 59 | 2.5 | 14 | 1.2 | 12 | 4.9 | 13 | 4.9 | 132 | 3.3 |
| 70 to 79 | 12,617 | 170 | 2.1 | 82.0 | 59 | 2.5 | 14 | 1.2 | 1 | 0.4 | 10 | 3.8 | 86 | 2.1 |
| 80 to 89 | 13,673 | 163 | 2.0 | 84.0 | 35 | 1.5 | 8 | 0.7 | 4 | 1.6 | 11 | 4.2 | 105 | 2.6 |
| 90 to 99 | 10,908 | 116 | 1.4 | 85.4 | 36 | 1.5 | 5 | 0.4 | 5 | 2.0 | 4 | 1.5 | 66 | 1.6 |
| 100 to 109 | 11,212 | 108 | 1.3 | 86.7 | 25 | 1.1 | 4 | 0.3 | 7 | 2.8 | 3 | 1.1 | 69 | 1.7 |
| 110 to 119 | 11,626 | 102 | 1.3 | 88.0 | 23 | 1.0 | 7 | 0.6 | 6 | 2.4 | 9 | 3.4 | 57 | 1.4 |
| 120 to 129 | 10,792 | 87 | 1.1 | 89.1 | 22 | 0.9 | 6 | 0.5 | 3 | 1.2 | 2 | 0.8 | 54 | 1.3 |
| 130 to 139 | 11,023 | 82 | 1.0 | 90.1 | 24 | 1.0 | 7 | 0.6 | 5 | 2.0 | 3 | 1.1 | 43 | 1.1 |
| 140 to 149 | 9,220 | 64 | 0.8 | 90.9 | 16 | 0.7 | 5 | 0.4 | 3 | 1.2 | 3 | 1.1 | 37 | 0.9 |
| 150 to 159 | 7,983 | 52 | 0.6 | 91.5 | 11 | 0.5 | 2 | 0.2 | 0 | 7 | 2.7 | 32 | 0.8 | |
| 160 to 169 | 6,392 | 39 | 0.5 | 92.0 | 10 | 0.4 | 2 | 0.2 | 3 | 1.2 | 1 | 0.4 | 23 | 0.6 |
| 170 to 179 | 7,856 | 45 | 0.6 | 92.6 | 11 | 0.5 | 3 | 0.3 | 1 | 0.4 | 1 | 0.4 | 29 | 0.7 |
| 180 to 189 | 4,978 | 27 | 0.3 | 92.9 | 6 | 0.3 | 1 | 0.1 | 0 | 4 | 1.5 | 16 | 0.4 | |
| 190 to 199 | 6,396 | 33 | 0.4 | 93.3 | 7 | 0.3 | 0 | 0 | 1 | 0.4 | 25 | 0.6 | ||
| 200 to 299 | 53,163 | 221 | 2.7 | 96.0 | 43 | 1.8 | 8 | 0.7 | 7 | 2.8 | 8 | 3.0 | 155 | 3.8 |
| 300 to 399 | 41,175 | 121 | 1.5 | 97.5 | 27 | 1.2 | 2 | 0.2 | 4 | 1.6 | 4 | 1.5 | 84 | 2.1 |
| 400 to 499 | 24,832 | 57 | 0.7 | 98.2 | 14 | 0.6 | 2 | 0.2 | 3 | 1.2 | 0 | 38 | 0.9 | |
| 500 to 599 | 14,855 | 27 | 0.3 | 98.5 | 4 | 0.2 | 2 | 0.2 | 0 | 0 | 21 | 0.5 | ||
| 600 to 799 | 31,841 | 45 | 0.6 | 99.1 | 11 | 0.5 | 3 | 0.3 | 2 | 0.8 | 0 | 29 | 0.7 | |
| 800 to 999 | 18,713 | 21 | 0.3 | 99.4 | 5 | 0.2 | 0 | 5 | 2.0 | 0 | 11 | 0.3 | ||
| 1,000 to 1,999 | 40,130 | 33 | 0.4 | 99.8 | 4 | 0.2 | 0 | 1 | 0.4 | 1 | 0.4 | 27 | 0.7 | |
| 2,000 to 2,999 | 14,628 | 6 | 0.1 | 99.9 | 2 | 0.1 | 0 | 0 | 0 | 4 | 0.1 | |||
| 3,000 to 9,999 | 16,640 | 4 | 0.1 | 100.0 | 1 | 0.0 | 0 | 0 | 1 | 0.4 | 2 | 0.0 | ||
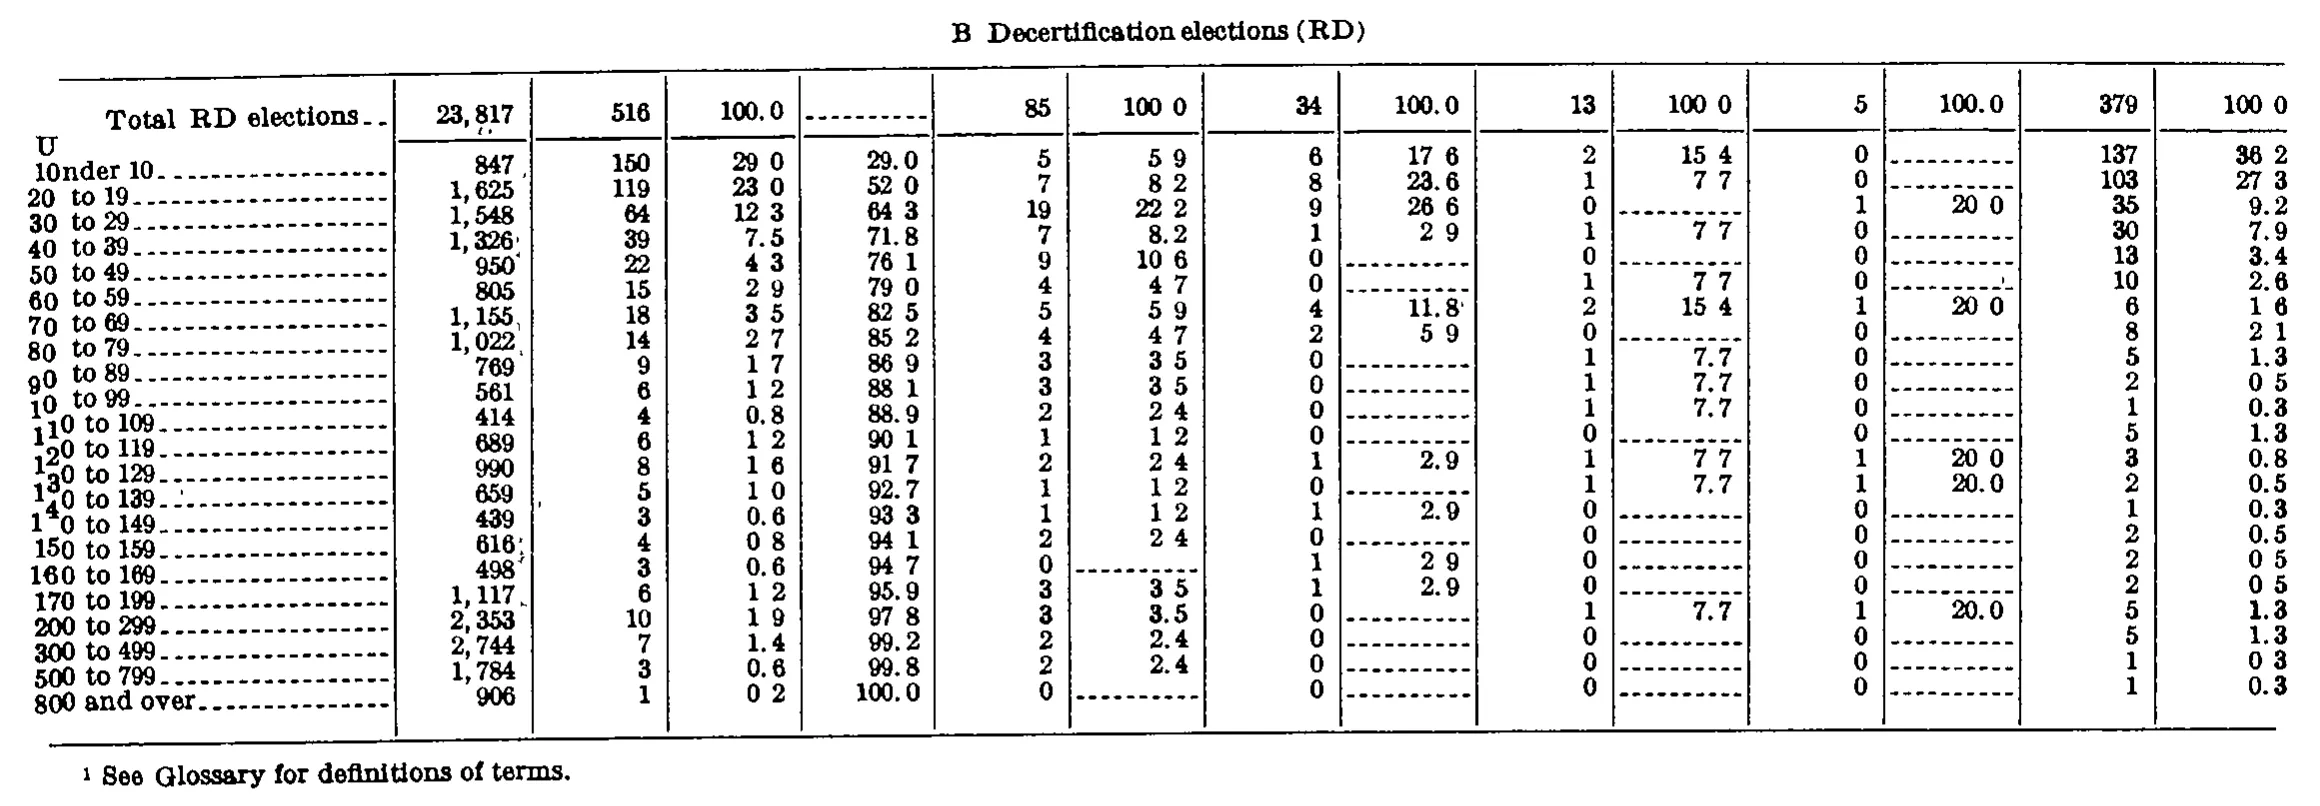
| B Decertification elections (RD) | ||||||||||||||
| Total RD elections | 23,817 | 516 | 100.0 | 85 | 100.0 | 34 | 100.0 | 13 | 100.0 | 5 | 100.0 | 379 | 100.0 | |
| Under 10 | 847 | 150 | 29.0 | 29.0 | 5 | 5.9 | 6 | 17.6 | 2 | 15.4 | 0 | 137 | 36.2 | |
| 10 to 19 | 1,625 | 119 | 23.0 | 52.0 | 7 | 8.2 | 8 | 23.6 | 1 | 7.7 | 0 | 103 | 27.3 | |
| 20 to 29 | 1,548 | 64 | 12.3 | 64.3 | 19 | 22.2 | 9 | 26.6 | 0 | 1 | 20.0 | 35 | 9.2 | |
| 30 to 39 | 1,326 | 39 | 7.5 | 71.8 | 7 | 8.2 | 1 | 2.9 | 1 | 7.7 | 0 | 30 | 7.9 | |
| 40 to 49 | 950 | 22 | 4.3 | 76.1 | 9 | 10.6 | 0 | 0 | 0 | 13 | 3.4 | |||
| 50 to 59 | 805 | 15 | 2.9 | 79.0 | 4 | 4.7 | 0 | 1 | 7.7 | 0 | 10 | 2.6 | ||
| 60 to 69 | 1,155 | 18 | 3.5 | 82.5 | 5 | 5.9 | 4 | 11.8 | 2 | 15.4 | 1 | 20.0 | 6 | 1.6 |
| 70 to 79 | 1,022 | 14 | 2.7 | 85.2 | 4 | 4.7 | 2 | 5.9 | 0 | 0 | 8 | 2.1 | ||
| 80 to 89 | 769 | 9 | 1.7 | 86.9 | 3 | 3.5 | 0 | 1 | 7.7 | 0 | 5 | 1.3 | ||
| 90 to 99 | 561 | 6 | 1.2 | 88.1 | 3 | 3.5 | 0 | 1 | 7.7 | 0 | 2 | 0.5 | ||
| 100 to 109 | 414 | 4 | 0.8 | 88.9 | 2 | 2.4 | 0 | 1 | 7.7 | 0 | 1 | 0.3 | ||
| 110 to 119 | 689 | 6 | 1.2 | 90.1 | 1 | 1.2 | 0 | 0 | 0 | 5 | 1.3 | |||
| 120 to 129 | 990 | 8 | 1.6 | 91.7 | 2 | 2.4 | 1 | 2.9 | 1 | 7.7 | 1 | 20.0 | 3 | 0.8 |
| 130 to 139 | 659 | 5 | 1.0 | 92.7 | 1 | 1.2 | 0 | 1 | 7.7 | 1 | 20.0 | 2 | 0.5 | |
| 140 to 149 | 439 | 3 | 0.6 | 93.3 | 1 | 1.2 | 1 | 2.9 | 0 | 0 | 1 | 0.3 | ||
| 150 to 159 | 616 | 4 | 0.8 | 94.1 | 2 | 2.4 | 0 | 0 | 0 | 2 | 0.5 | |||
| 160 to 169 | 498 | 3 | 0.6 | 94.7 | 0 | 1 | 2.9 | 0 | 0 | 2 | 0.5 | |||
| 170 to 199 | 1,117 | 6 | 1.2 | 95.9 | 3 | 3.5 | 1 | 2.9 | 0 | 0 | 2 | 0.5 | ||
| 200 to 299 | 2,353 | 10 | 1.9 | 97.8 | 3 | 3.5 | 0 | 1 | 7.7 | 1 | 20.0 | 5 | 1.3 | |
| 300 to 499 | 2,744 | 7 | 1.4 | 99.2 | 2 | 2.4 | 0 | 0 | 0 | 5 | 1.3 | |||
| 500 to 799 | 1,784 | 3 | 0.6 | 99.8 | 2 | 2.4 | 0 | 0 | 0 | 1 | 0.3 | |||
| 800 and over | 906 | 1 | 0.2 | 100.0 | 0 | 0 | 0 | 0 | 1 | 0.3 | ||||
- 1 See Glossary for definitions of terms.
310 of 310 figures sit in a row or column sum that works out.
Reader’s notes
p. 259. 15 columns: stub, 4 summary columns, four Number/Percent pairs under "Elections in which representation rights were won by" (AFL-CIO, Teamsters, Other national, Other local), and a Number/Percent pair under "Elections in which no representative was chosen". Decimal points: this is a 1-bit scan in which many decimal points have dropped out, so most percent cells print as e.g. "46 4", "100 0", "0 6". Every one of these columns carries exactly one decimal place, so I have restored the decimal point ("46.4", "100.0", "0.6"). No digits were changed. Cells holding only a dash rule ("------") are transcribed as "" (they occur in the Cumulative-percent cell of the total row and in the percent columns wherever the paired count is 0). Arithmetic checks: the five count columns (Number eligible to vote, Total elections, AFL-CIO Number, Teamsters Number, Other national Number, Other local Number, No-representative Number) each sum exactly to the printed total row (545,103; 8,061; 2,344; 1,148; 246; 263; 4,060), which supports the digit readings. Suspected source anomaly, transcribed as printed: the "Under 10" row shows 13,108 eligible voters in only 2 elections, which is impossible for units of under 10 employees. It is nevertheless what is printed, and it is required for the column to sum to the printed total 545,103 (the other 28 rows sum to 531,995), so the error appears to be in the source rather than in the reading. Minor rounding oddities in the source, transcribed as printed: in the "Other national unions - Percent by size class" column, 102/246 = 41.5 but 41.7 is printed, 26/246 = 10.6 but 10.7 is printed, and 22/246 = 8.9 but 9.0 is printed; in the "Other local unions - Percent by size class" column, 91/263 = 34.6 but 34.7 is printed and 34/263 = 12.9 but 13.0 is printed. All other percentages in those columns round correctly, so 41.7 / 10.7 / 34.7 are the cells I would re-check at higher resolution (5 vs 7 and 6 vs 7 are the plausible confusions). The section line reads "A Certification elections (RC and RM)"; the period after "A" is not legible in the scan (consistent with the general loss of periods) and I have written it as "A.". Crop: the page ends with the bottom rule after the "3,000 to 9,999" row, so only panel A (Certification elections) is present; any further panels and the footnote text for the caption's superscript 1 fall outside this crop. No footnotes are printed on this image.
p. 260. No column headings are printed on this crop: it continues the table from the previous page, so header_rows is empty. The column rules give 15 columns (stub + 14 data columns): a count column, a second count column, a percent column, a cumulative-percent column, and then five (number, percent) pairs. The five number columns of the total line (85, 34, 13, 5, 379) sum to the 516 of the second column, and the second column's body sums to 516 while the first column's body sums to 23,817, matching both printed totals. The centered line "B Decertification elections (RD)" is printed above the table's top rule (this page carries panel B of a table whose panel A is on the earlier page); it is kept as a label-only section row at the top of the body. Decimal points: in this scan the decimal point of many percent cells did not reproduce, so they print as e.g. "100 0", "29 0", "15 4". They are transcribed with the decimal point. Two independent checks support this: the percent column equals the successive differences of the cumulative column exactly (29.0, 23.0, 12.3, 7.5, 4.3, 2.9, 3.5, 2.7, 1.7, 1.2, 0.8, 1.2, 1.6, 1.0, 0.6, 0.8, 0.6, 1.2, 1.9, 1.4, 0.6, 0.2), and each of the five paired percent columns sums to exactly 100.0. Stub labels: in the scan the first character of each stub label sits about one line high, so the "U" of "Under 10" prints on the line above "nder 10" and each following label's leading digit rides up into the line above it. The labels are read from those displaced characters and are corroborated by the implied average unit size (e.g. 1,117 employees in 6 elections = 186 average, consistent with "170 to 199", and 906 in 1 election with "800 and over"). Rounding in the source is not always to the nearest tenth (150/516 = 29.07 is printed 29.0; 64/516 = 12.40 is printed 12.3; 19/85 = 22.35 is printed 22.2), but these values are transcribed as printed and are confirmed by the column sums above. A faint mark appears just below the "Total RD elections" stub label; it does not read as a footnote marker and is most likely a scan artifact, so nothing was added to that label. The footnote marker 1 of "See Glossary for definitions of terms." is not attached to anything printed on this crop; it belongs to the caption or headings on the preceding page.
Source image
Source data: U.S. NLRB Annual Reports (public domain). Reconstruction by NLRB Stats Archive. Read by claude-opus-5 (effort max, prompt extract_v1) from the 300-dpi scan; stitched by page. Updated October 2026.