NLRB Stats Archive › Annual Reports › FY1975 › Standard Federal Administrative Regional Distribution of Representation Elections Held in Cases Closed, Fiscal Year 1975
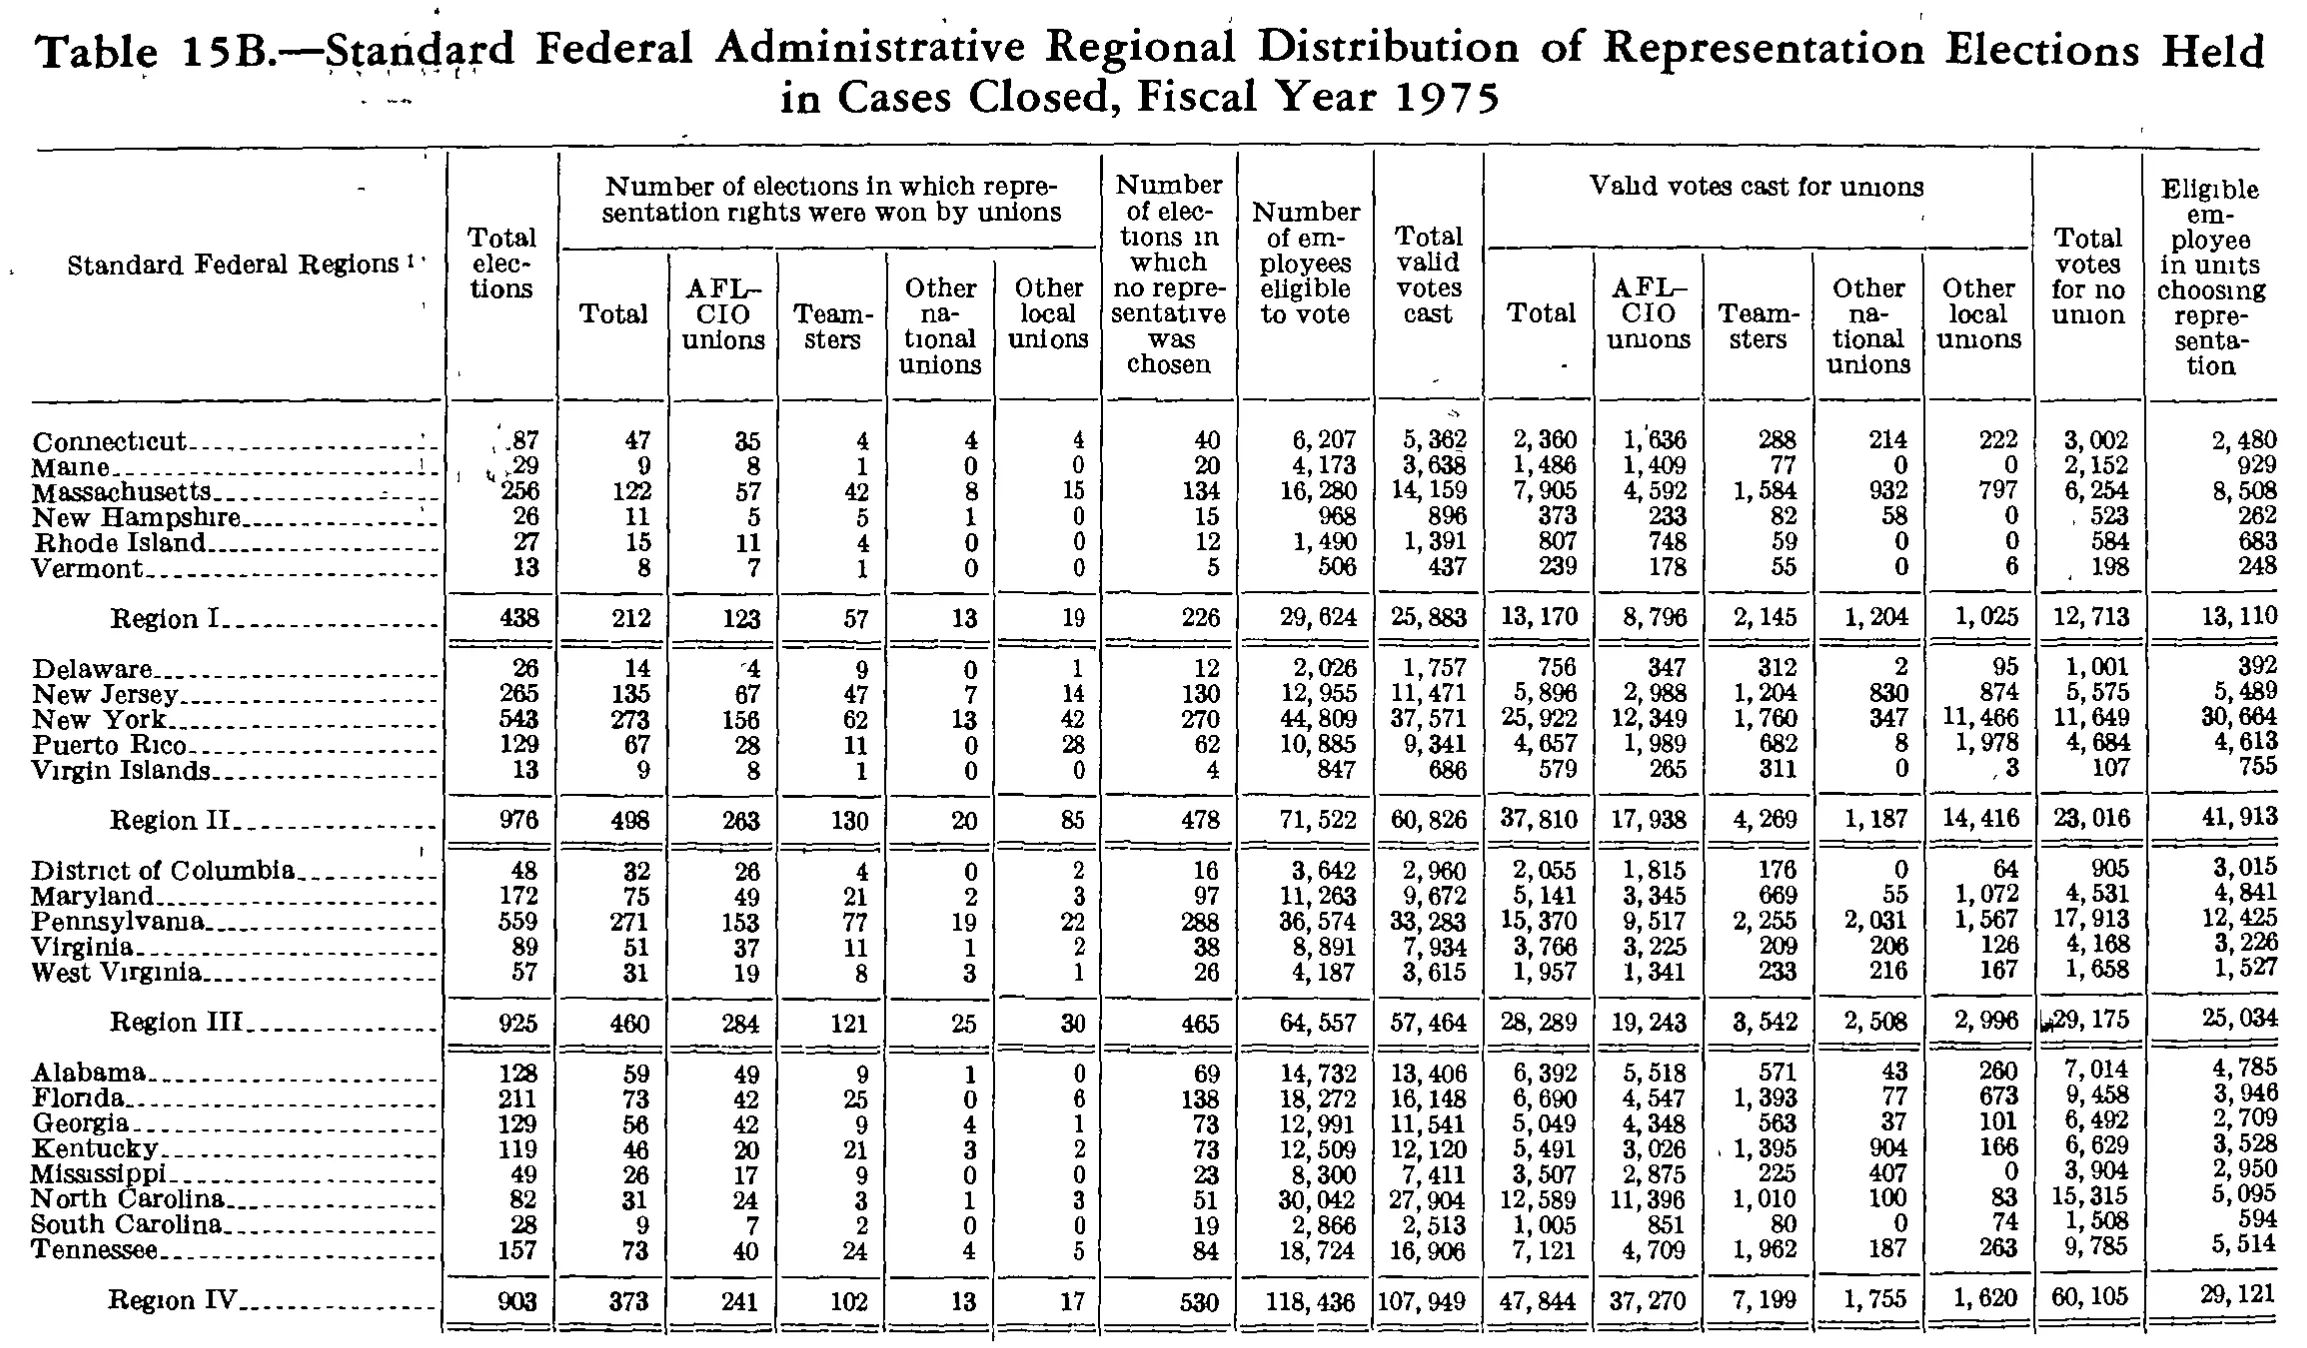
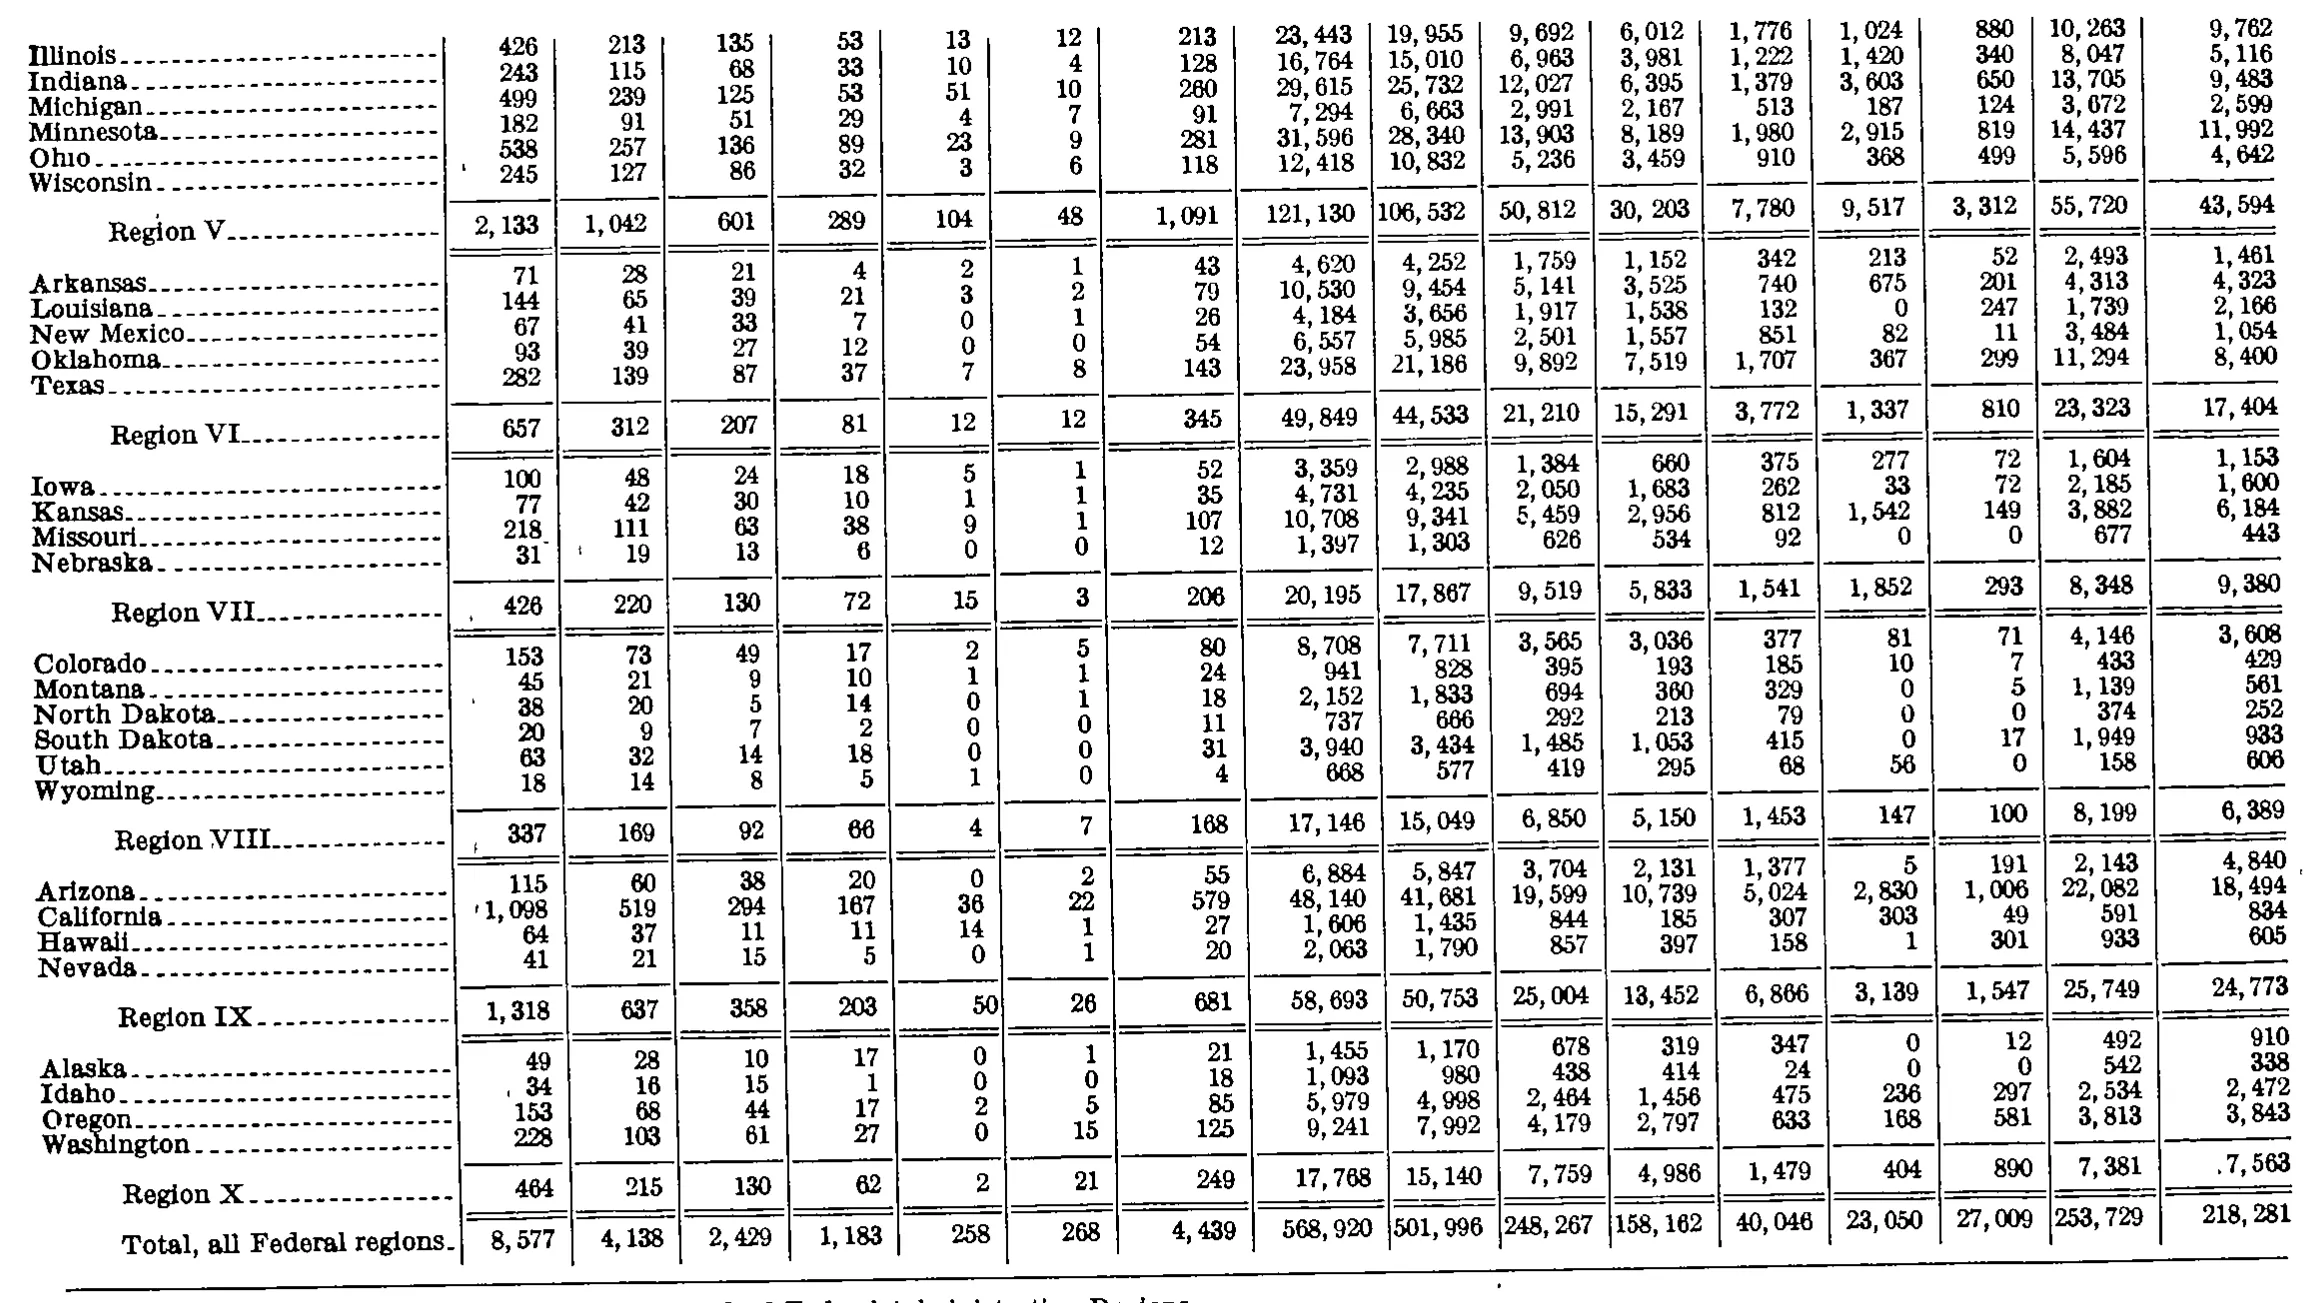
Standard Federal Administrative Regional Distribution of Representation Elections Held in Cases Closed, Fiscal Year 1975
Stitched from pp. 255–256.
| Standard Federal Regions | Total elections | Number of elections in which representation rights were won by unions | Number of elections in which no representative was chosen | Number of employees eligible to vote | Total valid votes cast | Valid votes cast for unions | Total votes for no union | Eligible employee in units choosing representation | ||||||||
|---|---|---|---|---|---|---|---|---|---|---|---|---|---|---|---|---|
| Standard Federal Regions | Total elections | Total | AFL-CIO unions | Teamsters | Other national unions | Other local unions | Number of elections in which no representative was chosen | Number of employees eligible to vote | Total valid votes cast | Total | AFL-CIO unions | Teamsters | Other national unions | Other local unions | Total votes for no union | Eligible employee in units choosing representation |
| Connecticut | 87 | 47 | 35 | 4 | 4 | 4 | 40 | 6,207 | 5,362 | 2,360 | 1,636 | 288 | 214 | 222 | 3,002 | 2,480 |
| Maine | 29 | 9 | 8 | 1 | 0 | 0 | 20 | 4,173 | 3,638 | 1,486 | 1,409 | 77 | 0 | 0 | 2,152 | 929 |
| Massachusetts | 256 | 122 | 57 | 42 | 8 | 15 | 134 | 16,280 | 14,159 | 7,905 | 4,592 | 1,584 | 932 | 797 | 6,254 | 8,508 |
| New Hampshire | 26 | 11 | 5 | 5 | 1 | 0 | 15 | 968 | 896 | 373 | 233 | 82 | 58 | 0 | 523 | 262 |
| Rhode Island | 27 | 15 | 11 | 4 | 0 | 0 | 12 | 1,490 | 1,391 | 807 | 748 | 59 | 0 | 0 | 584 | 683 |
| Vermont | 13 | 8 | 7 | 1 | 0 | 0 | 5 | 506 | 437 | 239 | 178 | 55 | 0 | 6 | 198 | 248 |
| Region I | 438 | 212 | 123 | 57 | 13 | 19 | 226 | 29,624 | 25,883 | 13,170 | 8,796 | 2,145 | 1,204 | 1,025 | 12,713 | 13,110 |
| Delaware | 26 | 14 | 4 | 9 | 0 | 1 | 12 | 2,026 | 1,757 | 756 | 347 | 312 | 2 | 95 | 1,001 | 392 |
| New Jersey | 265 | 135 | 67 | 47 | 7 | 14 | 130 | 12,955 | 11,471 | 5,896 | 2,988 | 1,204 | 830 | 874 | 5,575 | 5,489 |
| New York | 543 | 273 | 156 | 62 | 13 | 42 | 270 | 44,809 | 37,571 | 25,922 | 12,349 | 1,760 | 347 | 11,466 | 11,649 | 30,664 |
| Puerto Rico | 129 | 67 | 28 | 11 | 0 | 28 | 62 | 10,885 | 9,341 | 4,657 | 1,989 | 682 | 8 | 1,978 | 4,684 | 4,613 |
| Virgin Islands | 13 | 9 | 8 | 1 | 0 | 0 | 4 | 847 | 686 | 579 | 265 | 311 | 0 | 3 | 107 | 755 |
| Region II | 976 | 498 | 263 | 130 | 20 | 85 | 478 | 71,522 | 60,826 | 37,810 | 17,938 | 4,269 | 1,187 | 14,416 | 23,016 | 41,913 |
| District of Columbia | 48 | 32 | 26 | 4 | 0 | 2 | 16 | 3,642 | 2,960 | 2,055 | 1,815 | 176 | 0 | 64 | 905 | 3,015 |
| Maryland | 172 | 75 | 49 | 21 | 2 | 3 | 97 | 11,263 | 9,672 | 5,141 | 3,345 | 669 | 55 | 1,072 | 4,531 | 4,841 |
| Pennsylvania | 559 | 271 | 153 | 77 | 19 | 22 | 288 | 36,574 | 33,283 | 15,370 | 9,517 | 2,255 | 2,031 | 1,567 | 17,913 | 12,425 |
| Virginia | 89 | 51 | 37 | 11 | 1 | 2 | 38 | 8,891 | 7,934 | 3,766 | 3,225 | 209 | 206 | 126 | 4,168 | 3,226 |
| West Virginia | 57 | 31 | 19 | 8 | 3 | 1 | 26 | 4,187 | 3,615 | 1,957 | 1,341 | 233 | 216 | 167 | 1,658 | 1,527 |
| Region III | 925 | 460 | 284 | 121 | 25 | 30 | 465 | 64,557 | 57,464 | 28,289 | 19,243 | 3,542 | 2,508 | 2,996 | 29,175 | 25,034 |
| Alabama | 128 | 59 | 49 | 9 | 1 | 0 | 69 | 14,732 | 13,406 | 6,392 | 5,518 | 571 | 43 | 260 | 7,014 | 4,785 |
| Florida | 211 | 73 | 42 | 25 | 0 | 6 | 138 | 18,272 | 16,148 | 6,690 | 4,547 | 1,393 | 77 | 673 | 9,458 | 3,946 |
| Georgia | 129 | 56 | 42 | 9 | 4 | 1 | 73 | 12,991 | 11,541 | 5,049 | 4,348 | 563 | 37 | 101 | 6,492 | 2,709 |
| Kentucky | 119 | 46 | 20 | 21 | 3 | 2 | 73 | 12,509 | 12,120 | 5,491 | 3,026 | 1,395 | 904 | 166 | 6,629 | 3,528 |
| Mississippi | 49 | 26 | 17 | 9 | 0 | 0 | 23 | 8,300 | 7,411 | 3,507 | 2,875 | 225 | 407 | 0 | 3,904 | 2,950 |
| North Carolina | 82 | 31 | 24 | 3 | 1 | 3 | 51 | 30,042 | 27,904 | 12,589 | 11,396 | 1,010 | 100 | 83 | 15,315 | 5,095 |
| South Carolina | 28 | 9 | 7 | 2 | 0 | 0 | 19 | 2,866 | 2,513 | 1,005 | 851 | 80 | 0 | 74 | 1,508 | 594 |
| Tennessee | 157 | 73 | 40 | 24 | 4 | 5 | 84 | 18,724 | 16,906 | 7,121 | 4,709 | 1,962 | 187 | 263 | 9,785 | 5,514 |
| Region IV | 903 | 373 | 241 | 102 | 13 | 17 | 530 | 118,436 | 107,949 | 47,844 | 37,270 | 7,199 | 1,755 | 1,620 | 60,105 | 29,121 |
| Illinois | 426 | 213 | 135 | 53 | 13 | 12 | 213 | 23,443 | 19,955 | 9,692 | 6,012 | 1,776 | 1,024 | 880 | 10,263 | 9,762 |
| Indiana | 243 | 115 | 68 | 33 | 10 | 4 | 128 | 16,764 | 15,010 | 6,963 | 3,981 | 1,222 | 1,420 | 340 | 8,047 | 5,116 |
| Michigan | 499 | 239 | 125 | 53 | 51 | 10 | 260 | 29,615 | 25,732 | 12,027 | 6,395 | 1,379 | 3,603 | 650 | 13,705 | 9,483 |
| Minnesota | 182 | 91 | 51 | 29 | 4 | 7 | 91 | 7,294 | 6,663 | 2,991 | 2,167 | 513 | 187 | 124 | 3,672 | 2,599 |
| Ohio | 538 | 257 | 136 | 89 | 23 | 9 | 281 | 31,596 | 28,340 | 13,903 | 8,189 | 1,980 | 2,915 | 819 | 14,437 | 11,992 |
| Wisconsin | 245 | 127 | 86 | 32 | 3 | 6 | 118 | 12,418 | 10,832 | 5,236 | 3,459 | 910 | 368 | 499 | 5,596 | 4,642 |
| Region V | 2,133 | 1,042 | 601 | 289 | 104 | 48 | 1,091 | 121,130 | 106,532 | 50,812 | 30,203 | 7,780 | 9,517 | 3,312 | 55,720 | 43,594 |
| Arkansas | 71 | 28 | 21 | 4 | 2 | 1 | 43 | 4,620 | 4,252 | 1,759 | 1,152 | 342 | 213 | 52 | 2,493 | 1,461 |
| Louisiana | 144 | 65 | 39 | 21 | 3 | 2 | 79 | 10,530 | 9,454 | 5,141 | 3,525 | 740 | 675 | 201 | 4,313 | 4,323 |
| New Mexico | 67 | 41 | 33 | 7 | 0 | 1 | 26 | 4,184 | 3,656 | 1,917 | 1,538 | 132 | 0 | 247 | 1,739 | 2,166 |
| Oklahoma | 93 | 39 | 27 | 12 | 0 | 0 | 54 | 6,557 | 5,985 | 2,501 | 1,557 | 851 | 82 | 11 | 3,484 | 1,054 |
| Texas | 282 | 139 | 87 | 37 | 7 | 8 | 143 | 23,958 | 21,186 | 9,892 | 7,519 | 1,707 | 367 | 299 | 11,294 | 8,400 |
| Region VI | 657 | 312 | 207 | 81 | 12 | 12 | 345 | 49,849 | 44,533 | 21,210 | 15,291 | 3,772 | 1,337 | 810 | 23,323 | 17,404 |
| Iowa | 100 | 48 | 24 | 18 | 5 | 1 | 52 | 3,359 | 2,988 | 1,384 | 660 | 375 | 277 | 72 | 1,604 | 1,153 |
| Kansas | 77 | 42 | 30 | 10 | 1 | 1 | 35 | 4,731 | 4,235 | 2,050 | 1,683 | 262 | 33 | 72 | 2,185 | 1,600 |
| Missouri | 218 | 111 | 63 | 38 | 9 | 1 | 107 | 10,708 | 9,341 | 5,459 | 2,956 | 812 | 1,542 | 149 | 3,882 | 6,184 |
| Nebraska | 31 | 19 | 13 | 6 | 0 | 0 | 12 | 1,397 | 1,303 | 626 | 534 | 92 | 0 | 0 | 677 | 443 |
| Region VII | 426 | 220 | 130 | 72 | 15 | 3 | 206 | 20,195 | 17,867 | 9,519 | 5,833 | 1,541 | 1,852 | 293 | 8,348 | 9,380 |
| Colorado | 153 | 73 | 49 | 17 | 2 | 5 | 80 | 8,708 | 7,711 | 3,565 | 3,036 | 377 | 81 | 71 | 4,146 | 3,608 |
| Montana | 45 | 21 | 9 | 10 | 1 | 1 | 24 | 941 | 828 | 395 | 193 | 185 | 10 | 7 | 433 | 429 |
| North Dakota | 38 | 20 | 5 | 14 | 0 | 1 | 18 | 2,152 | 1,833 | 694 | 360 | 329 | 0 | 5 | 1,139 | 561 |
| South Dakota | 20 | 9 | 7 | 2 | 0 | 0 | 11 | 737 | 666 | 292 | 213 | 79 | 0 | 0 | 374 | 252 |
| Utah | 63 | 32 | 14 | 18 | 0 | 0 | 31 | 3,940 | 3,434 | 1,485 | 1,053 | 415 | 0 | 17 | 1,949 | 933 |
| Wyoming | 18 | 14 | 8 | 5 | 1 | 0 | 4 | 668 | 577 | 419 | 295 | 68 | 56 | 0 | 158 | 606 |
| Region VIII | 337 | 169 | 92 | 66 | 4 | 7 | 168 | 17,146 | 15,049 | 6,850 | 5,150 | 1,453 | 147 | 100 | 8,199 | 6,389 |
| Arizona | 115 | 60 | 38 | 20 | 0 | 2 | 55 | 6,884 | 5,847 | 3,704 | 2,131 | 1,377 | 5 | 191 | 2,143 | 4,840 |
| California | 1,098 | 519 | 294 | 167 | 36 | 22 | 579 | 48,140 | 41,681 | 19,599 | 10,739 | 5,024 | 2,830 | 1,006 | 22,082 | 18,494 |
| Hawaii | 64 | 37 | 11 | 11 | 14 | 1 | 27 | 1,606 | 1,435 | 844 | 185 | 307 | 303 | 49 | 591 | 834 |
| Nevada | 41 | 21 | 15 | 5 | 0 | 1 | 20 | 2,063 | 1,790 | 857 | 397 | 158 | 1 | 301 | 933 | 605 |
| Region IX | 1,318 | 637 | 358 | 203 | 50 | 26 | 681 | 58,693 | 50,753 | 25,004 | 13,452 | 6,866 | 3,139 | 1,547 | 25,749 | 24,773 |
| Alaska | 49 | 28 | 10 | 17 | 0 | 1 | 21 | 1,455 | 1,170 | 678 | 319 | 347 | 0 | 12 | 492 | 910 |
| Idaho | 34 | 16 | 15 | 1 | 0 | 0 | 18 | 1,093 | 980 | 438 | 414 | 24 | 0 | 0 | 542 | 338 |
| Oregon | 153 | 68 | 44 | 17 | 2 | 5 | 85 | 5,979 | 4,998 | 2,464 | 1,456 | 475 | 236 | 297 | 2,534 | 2,472 |
| Washington | 228 | 103 | 61 | 27 | 0 | 15 | 125 | 9,241 | 7,992 | 4,179 | 2,797 | 633 | 168 | 581 | 3,813 | 3,843 |
| Region X | 464 | 215 | 130 | 62 | 2 | 21 | 249 | 17,768 | 15,140 | 7,759 | 4,986 | 1,479 | 404 | 890 | 7,381 | 7,563 |
| Total, all Federal regions | 8,577 | 4,138 | 2,429 | 1,183 | 258 | 268 | 4,439 | 568,920 | 501,996 | 248,267 | 158,162 | 40,046 | 23,050 | 27,009 | 253,729 | 218,281 |
968 of 968 figures sit in a row or column sum that works out.
Reader’s notes
p. 255. The crop ends after the "Region IV" subtotal line; the table continues (Regions V onward, and any grand total) on the following page. The stub heading carries a raised footnote marker 1 ("Standard Federal Regions ^1"), but no footnote text is printed within this crop, so `footnotes` is empty. The scan is a 1-bit halftone and several digits sit close to the column rules, but every row cross-sum (union total = AFL-CIO + Teamsters + other national + other local; total elections = union-won + no-representative; total valid votes cast = union votes + no-union votes) and every region subtotal column sum reproduces exactly as transcribed, which independently confirms the digits and the column assignment. The only figures without an internal arithmetic check are the last column ("Eligible employee in units choosing representation"), whose region subtotals nevertheless also sum correctly from the state rows.
p. 256. Continuation page: no column headings are printed on this crop, so header_rows is empty. The grid has 17 columns (stub + 16 numeric), counted from the column rules; the same 16 columns carry through every row. The table begins mid-way through the state list — Federal Regions I through IV are on the preceding page. The first printed body line here is Illinois, at the very top edge of the crop; its digits are complete. Arithmetic check: every one of the six region subtotals (Regions V, VI, VII, VIII, IX, X) equals the exact column-wise sum of its member states in all 16 columns, which confirms both the digits and the column assignment for the 29 state rows. The grand total row could not be checked because it also covers Regions I–IV from the previous page. Typography: the row labels with their leader dots sit roughly half a line below the digits of their own row throughout the page; the mapping used here (first label to first digit line within each region block) is the one confirmed by the subtotal sums. Doubtful/incidental marks: in the Region X row, last column, a stray speck precedes the figure, printing as ".7,563"; it is transcribed as 7,563, which the column sum confirms. Similar isolated scan specks sit in the blank gutter to the left of the first numeric column at Ohio, Region V, Missouri, Region VII, Region VIII, California and Idaho; none are footnote markers and none are transcribed. In Region VII the digits in columns 5 and 6 (Iowa/Kansas/Missouri/Nebraska) are crowded against the column rule, but the sums 15 and 3 confirm the readings 5/1/9/0 and 1/1/1/0. Below the table's closing rule a line of text is cut off by the bottom of the crop; only a fragment of it is visible (it appears to end "...Federal administrative Regions"). It is probably a footnote, but it is not legible in full, so footnotes is left empty rather than reconstructed. No footnote markers appear on any value, row label or heading on this page.
Source image
Source data: U.S. NLRB Annual Reports (public domain). Reconstruction by NLRB Stats Archive. Read by claude-opus-5 (effort max, prompt extract_v1) from the 300-dpi scan; stitched by page. Updated October 2026.