NLRB Stats Archive › Annual Reports › FY1975 › Standard Federal Administrative Regional Distribution of Cases Received, Fiscal Year 1975
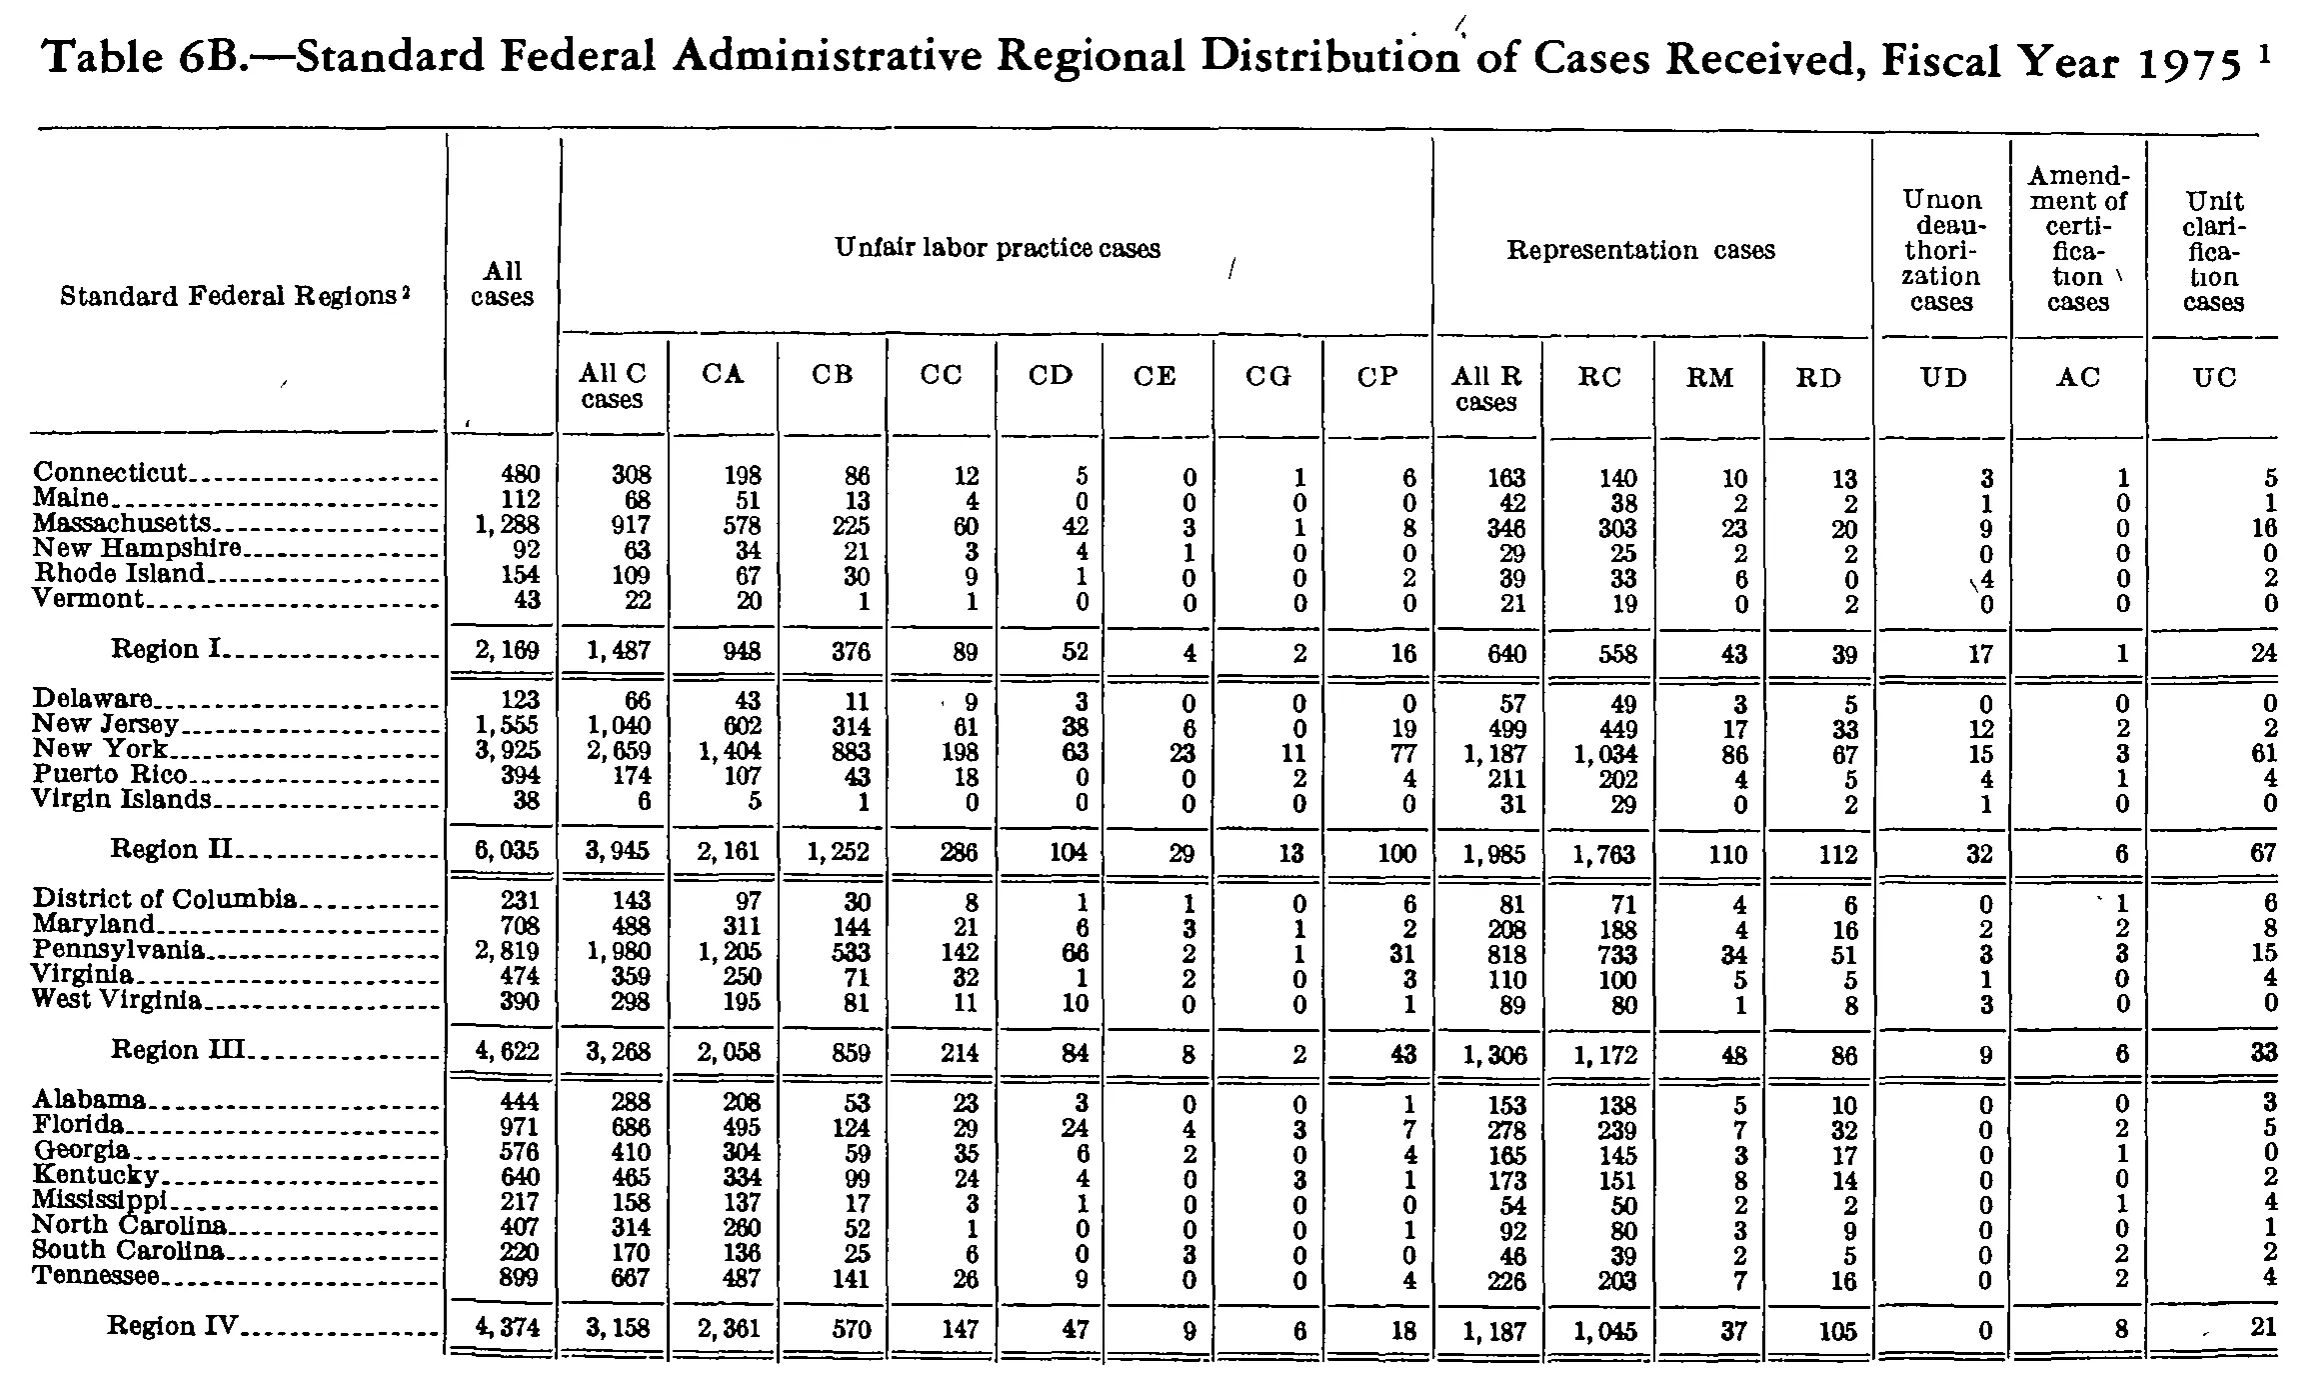
Standard Federal Administrative Regional Distribution of Cases Received, Fiscal Year 1975
Stitched from pp. 229–230.
| Standard Federal Regions | All cases | Unfair labor practice cases | Representation cases | Union deauthorization cases | Amendment of certification cases | Unit clarification cases | ||||||||||
|---|---|---|---|---|---|---|---|---|---|---|---|---|---|---|---|---|
| Standard Federal Regions | All cases | All C cases | CA | CB | CC | CD | CE | CG | CP | All R cases | RC | RM | RD | UD | AC | UC |
| Connecticut | 480 | 308 | 198 | 86 | 12 | 5 | 0 | 1 | 6 | 163 | 140 | 10 | 13 | 3 | 1 | 5 |
| Maine | 112 | 68 | 51 | 13 | 4 | 0 | 0 | 0 | 0 | 42 | 38 | 2 | 2 | 1 | 0 | 1 |
| Massachusetts | 1,288 | 917 | 578 | 225 | 60 | 42 | 3 | 1 | 8 | 346 | 303 | 23 | 20 | 9 | 0 | 16 |
| New Hampshire | 92 | 63 | 34 | 21 | 3 | 4 | 1 | 0 | 0 | 29 | 25 | 2 | 2 | 0 | 0 | 0 |
| Rhode Island | 154 | 109 | 67 | 30 | 9 | 1 | 0 | 0 | 2 | 39 | 33 | 6 | 0 | 4 | 0 | 2 |
| Vermont | 43 | 22 | 20 | 1 | 1 | 0 | 0 | 0 | 0 | 21 | 19 | 0 | 2 | 0 | 0 | 0 |
| Region I | 2,169 | 1,487 | 948 | 376 | 89 | 52 | 4 | 2 | 16 | 640 | 558 | 43 | 39 | 17 | 1 | 24 |
| Delaware | 123 | 66 | 43 | 11 | 9 | 3 | 0 | 0 | 0 | 57 | 49 | 3 | 5 | 0 | 0 | 0 |
| New Jersey | 1,555 | 1,040 | 602 | 314 | 61 | 38 | 6 | 0 | 19 | 499 | 449 | 17 | 33 | 12 | 2 | 2 |
| New York | 3,925 | 2,659 | 1,404 | 883 | 198 | 63 | 23 | 11 | 77 | 1,187 | 1,034 | 86 | 67 | 15 | 3 | 61 |
| Puerto Rico | 394 | 174 | 107 | 43 | 18 | 0 | 0 | 2 | 4 | 211 | 202 | 4 | 5 | 4 | 1 | 4 |
| Virgin Islands | 38 | 6 | 5 | 1 | 0 | 0 | 0 | 0 | 0 | 31 | 29 | 0 | 2 | 1 | 0 | 0 |
| Region II | 6,035 | 3,945 | 2,161 | 1,252 | 286 | 104 | 29 | 13 | 100 | 1,985 | 1,763 | 110 | 112 | 32 | 6 | 67 |
| District of Columbia | 231 | 143 | 97 | 30 | 8 | 1 | 1 | 0 | 6 | 81 | 71 | 4 | 6 | 0 | 1 | 6 |
| Maryland | 708 | 488 | 311 | 144 | 21 | 6 | 3 | 1 | 2 | 208 | 188 | 4 | 16 | 2 | 2 | 8 |
| Pennsylvania | 2,819 | 1,980 | 1,205 | 533 | 142 | 66 | 2 | 1 | 31 | 818 | 733 | 34 | 51 | 3 | 3 | 15 |
| Virginia | 474 | 359 | 250 | 71 | 32 | 1 | 2 | 0 | 3 | 110 | 100 | 5 | 5 | 1 | 0 | 4 |
| West Virginia | 390 | 298 | 195 | 81 | 11 | 10 | 0 | 0 | 1 | 89 | 80 | 1 | 8 | 3 | 0 | 0 |
| Region III | 4,622 | 3,268 | 2,058 | 859 | 214 | 84 | 8 | 2 | 43 | 1,306 | 1,172 | 48 | 86 | 9 | 6 | 33 |
| Alabama | 444 | 288 | 208 | 53 | 23 | 3 | 0 | 0 | 1 | 153 | 138 | 5 | 10 | 0 | 0 | 3 |
| Florida | 971 | 686 | 495 | 124 | 29 | 24 | 4 | 3 | 7 | 278 | 239 | 7 | 32 | 0 | 2 | 5 |
| Georgia | 576 | 410 | 304 | 59 | 35 | 6 | 2 | 0 | 4 | 165 | 145 | 3 | 17 | 0 | 1 | 0 |
| Kentucky | 640 | 465 | 334 | 99 | 24 | 4 | 0 | 3 | 1 | 173 | 151 | 8 | 14 | 0 | 0 | 2 |
| Mississippi | 217 | 158 | 137 | 17 | 3 | 1 | 0 | 0 | 0 | 54 | 50 | 2 | 2 | 0 | 1 | 4 |
| North Carolina | 407 | 314 | 260 | 52 | 1 | 0 | 0 | 0 | 1 | 92 | 80 | 3 | 9 | 0 | 0 | 1 |
| South Carolina | 220 | 170 | 136 | 25 | 6 | 0 | 3 | 0 | 0 | 46 | 39 | 2 | 5 | 0 | 2 | 2 |
| Tennessee | 899 | 667 | 487 | 141 | 26 | 9 | 0 | 0 | 4 | 226 | 203 | 7 | 16 | 0 | 2 | 4 |
| Region IV | 4,374 | 3,158 | 2,361 | 570 | 147 | 47 | 9 | 6 | 18 | 1,187 | 1,045 | 37 | 105 | 0 | 8 | 21 |
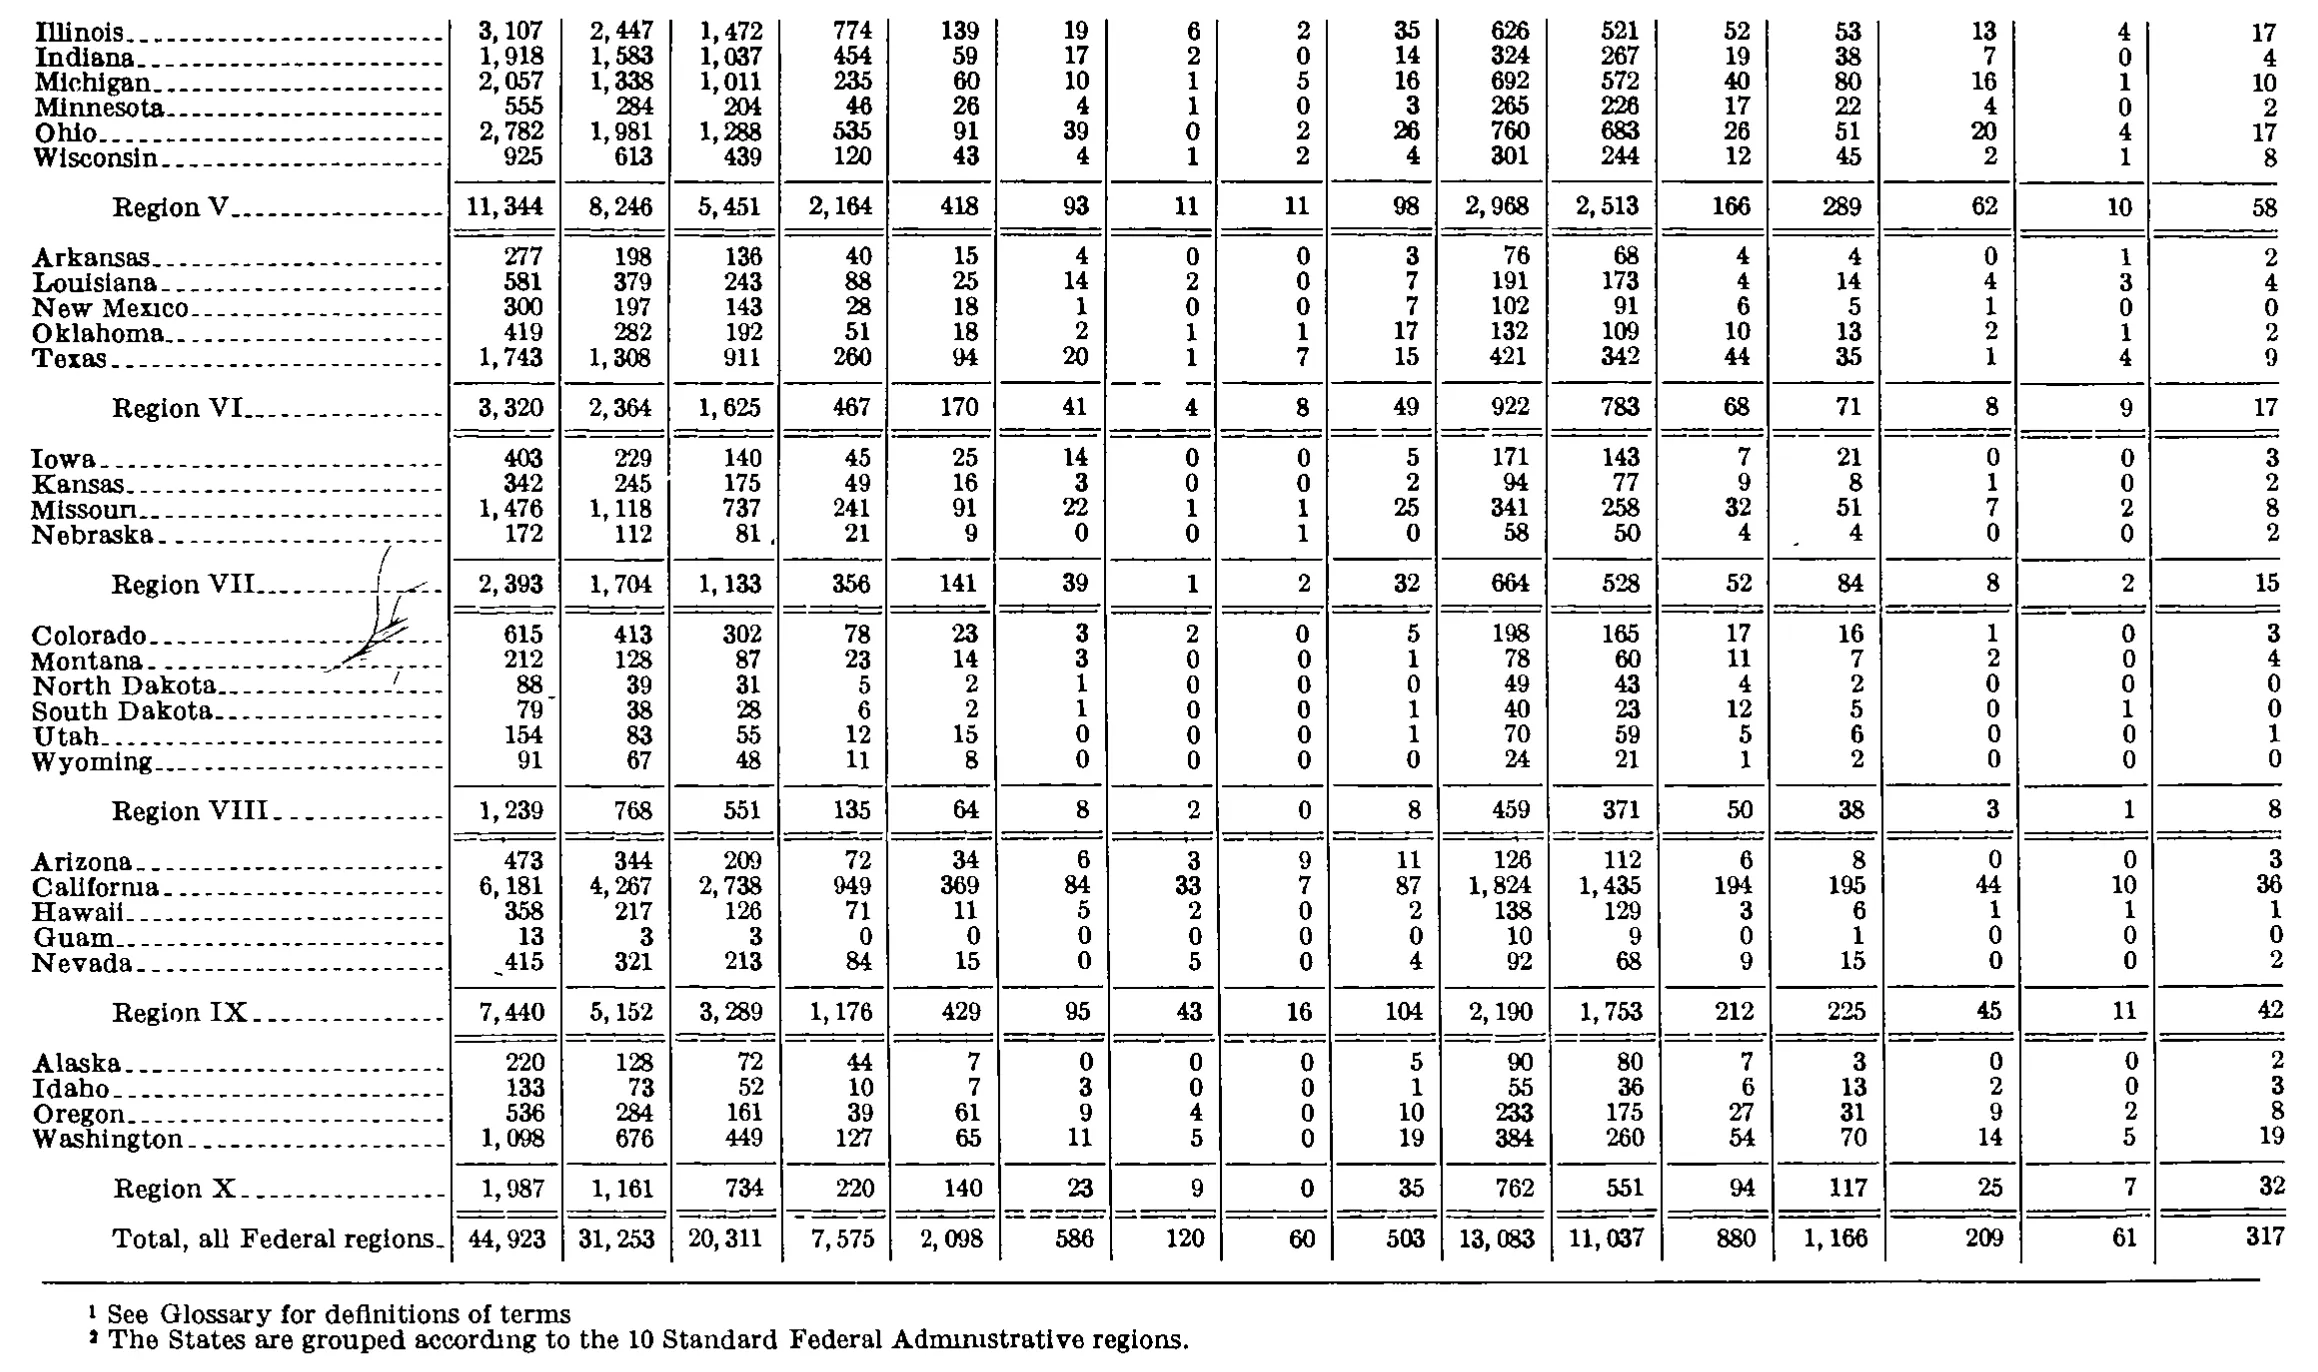
| Illinois | 3,107 | 2,447 | 1,472 | 774 | 139 | 19 | 6 | 2 | 35 | 626 | 521 | 52 | 53 | 13 | 4 | 17 |
| Indiana | 1,918 | 1,583 | 1,037 | 454 | 59 | 17 | 2 | 0 | 14 | 324 | 267 | 19 | 38 | 7 | 0 | 4 |
| Michigan | 2,057 | 1,338 | 1,011 | 235 | 60 | 10 | 1 | 5 | 16 | 692 | 572 | 40 | 80 | 16 | 1 | 10 |
| Minnesota | 555 | 284 | 204 | 46 | 26 | 4 | 1 | 0 | 3 | 265 | 226 | 17 | 22 | 4 | 0 | 2 |
| Ohio | 2,782 | 1,981 | 1,288 | 535 | 91 | 39 | 0 | 2 | 26 | 760 | 683 | 26 | 51 | 20 | 4 | 17 |
| Wisconsin | 925 | 613 | 439 | 120 | 43 | 4 | 1 | 2 | 4 | 301 | 244 | 12 | 45 | 2 | 1 | 8 |
| Region V | 11,344 | 8,246 | 5,451 | 2,164 | 418 | 93 | 11 | 11 | 98 | 2,968 | 2,513 | 166 | 289 | 62 | 10 | 58 |
| Arkansas | 277 | 198 | 136 | 40 | 15 | 4 | 0 | 0 | 3 | 76 | 68 | 4 | 4 | 0 | 1 | 2 |
| Louisiana | 581 | 379 | 243 | 88 | 25 | 14 | 2 | 0 | 7 | 191 | 173 | 4 | 14 | 4 | 3 | 4 |
| New Mexico | 300 | 197 | 143 | 28 | 18 | 1 | 0 | 0 | 7 | 102 | 91 | 6 | 5 | 1 | 0 | 0 |
| Oklahoma | 419 | 282 | 192 | 51 | 18 | 2 | 1 | 1 | 17 | 132 | 109 | 10 | 13 | 2 | 1 | 2 |
| Texas | 1,743 | 1,308 | 911 | 260 | 94 | 20 | 1 | 7 | 15 | 421 | 342 | 44 | 35 | 1 | 4 | 9 |
| Region VI | 3,320 | 2,364 | 1,625 | 467 | 170 | 41 | 4 | 8 | 49 | 922 | 783 | 68 | 71 | 8 | 9 | 17 |
| Iowa | 403 | 229 | 140 | 45 | 25 | 14 | 0 | 0 | 5 | 171 | 143 | 7 | 21 | 0 | 0 | 3 |
| Kansas | 342 | 245 | 175 | 49 | 16 | 3 | 0 | 0 | 2 | 94 | 77 | 9 | 8 | 1 | 0 | 2 |
| Missouri | 1,476 | 1,118 | 737 | 241 | 91 | 22 | 1 | 1 | 25 | 341 | 258 | 32 | 51 | 7 | 2 | 8 |
| Nebraska | 172 | 112 | 81 | 21 | 9 | 0 | 0 | 1 | 0 | 58 | 50 | 4 | 4 | 0 | 0 | 2 |
| Region VII | 2,393 | 1,704 | 1,133 | 356 | 141 | 39 | 1 | 2 | 32 | 664 | 528 | 52 | 84 | 8 | 2 | 15 |
| Colorado | 615 | 413 | 302 | 78 | 23 | 3 | 2 | 0 | 5 | 198 | 165 | 17 | 16 | 1 | 0 | 3 |
| Montana | 212 | 128 | 87 | 23 | 14 | 3 | 0 | 0 | 1 | 78 | 60 | 11 | 7 | 2 | 0 | 4 |
| North Dakota | 88 | 39 | 31 | 5 | 2 | 1 | 0 | 0 | 0 | 49 | 43 | 4 | 2 | 0 | 0 | 0 |
| South Dakota | 79 | 38 | 28 | 6 | 2 | 1 | 0 | 0 | 1 | 40 | 23 | 12 | 5 | 0 | 1 | 0 |
| Utah | 154 | 83 | 55 | 12 | 15 | 0 | 0 | 0 | 1 | 70 | 59 | 5 | 6 | 0 | 0 | 1 |
| Wyoming | 91 | 67 | 48 | 11 | 8 | 0 | 0 | 0 | 0 | 24 | 21 | 1 | 2 | 0 | 0 | 0 |
| Region VIII | 1,239 | 768 | 551 | 135 | 64 | 8 | 2 | 0 | 8 | 459 | 371 | 50 | 38 | 3 | 1 | 8 |
| Arizona | 473 | 344 | 209 | 72 | 34 | 6 | 3 | 9 | 11 | 126 | 112 | 6 | 8 | 0 | 0 | 3 |
| California | 6,181 | 4,267 | 2,738 | 949 | 369 | 84 | 33 | 7 | 87 | 1,824 | 1,435 | 194 | 195 | 44 | 10 | 36 |
| Hawaii | 358 | 217 | 126 | 71 | 11 | 5 | 2 | 0 | 2 | 138 | 129 | 3 | 6 | 1 | 1 | 1 |
| Guam | 13 | 3 | 3 | 0 | 0 | 0 | 0 | 0 | 0 | 10 | 9 | 0 | 1 | 0 | 0 | 0 |
| Nevada | 415 | 321 | 213 | 84 | 15 | 0 | 5 | 0 | 4 | 92 | 68 | 9 | 15 | 0 | 0 | 2 |
| Region IX | 7,440 | 5,152 | 3,289 | 1,176 | 429 | 95 | 43 | 16 | 104 | 2,190 | 1,753 | 212 | 225 | 45 | 11 | 42 |
| Alaska | 220 | 128 | 72 | 44 | 7 | 0 | 0 | 0 | 5 | 90 | 80 | 7 | 3 | 0 | 0 | 2 |
| Idaho | 133 | 73 | 52 | 10 | 7 | 3 | 0 | 0 | 1 | 55 | 36 | 6 | 13 | 2 | 0 | 3 |
| Oregon | 536 | 284 | 161 | 39 | 61 | 9 | 4 | 0 | 10 | 233 | 175 | 27 | 31 | 9 | 2 | 8 |
| Washington | 1,098 | 676 | 449 | 127 | 65 | 11 | 5 | 0 | 19 | 384 | 260 | 54 | 70 | 14 | 5 | 19 |
| Region X | 1,987 | 1,161 | 734 | 220 | 140 | 23 | 9 | 0 | 35 | 762 | 551 | 94 | 117 | 25 | 7 | 32 |
| Total, all Federal regions | 44,923 | 31,253 | 20,311 | 7,575 | 2,098 | 586 | 120 | 60 | 503 | 13,083 | 11,037 | 880 | 1,166 | 209 | 61 | 317 |
- 1 See Glossary for definitions of terms
- 2 The States are grouped according to the 10 Standard Federal Administrative regions.
882 of 882 figures sit in a row or column sum that works out.
Reader’s notes
p. 229. 17 columns: stub, "All cases", eight unfair-labor-practice columns, four representation columns, and UD, AC, UC. The caption carries a raised 1 and the stub heading a raised 2, but no footnote text is printed within the crop (the page is cut off just below the Region IV line), so `footnotes` is empty. The crop also cuts the table off after Region IV; Regions V and beyond, and the grand total, are not on this image. Every row and regional subtotal cross-foots exactly (row total = C + R + UD + AC + UC, and each regional line = the sum of its states), which is what I used to settle the one doubtful pair: North Carolina's AC and UC print faintly and could read as 1 and 1, but 0 and 1 is what reconciles both the row total (407) and the Region IV column totals (AC 8, UC 21), and the second reading of the image agrees. Rhode Island's UD (4) and Vermont's UD (0) have a stray ink stroke to their left, part of a faint diagonal scan artifact that also runs through the Maine UD cell and the District of Columbia AC cell; the digits themselves are legible and cross-foot correctly. Digit-grouping spaces in the original ("2, 169", "1, 487") have been closed up to commas as instructed.
p. 230. This crop is a continuation page: no column headings are printed on it (the table's headings and Regions I-IV stand on the preceding page), so header_rows is empty. The grid has 17 columns: the stub plus 16 numeric columns, counted from the column rules and confirmed by the last row ("Total, all Federal regions").\n\nTexas row, last three numeric columns (cols 14-16): the scan is smudged there and at first pass appeared to carry four figures (2, 1, 4, 9) for three column positions. The reading given (1, 4, 9) is the one consistent with every arithmetic identity the rest of the table obeys: the Region VI line requires 1, 4 and 9 in those columns (0+4+1+2+1=8, 1+3+0+1+4=9, 2+4+0+2+9=17), and the row identity col1 = col2+col10+col14+col15+col16 gives 1,308+421+1+4+9 = 1,743. The stray "2" is most likely a mark on the page rather than a printed digit, but this cell trio is the least certain on the page.\n\nThe scan carries handwritten/stray marks that are not part of the table: a pen scribble crossing the leader dots of the "Region VII" stub label (and extending up over the Nebraska/Missouri leader area), and a small stray dot in the Nebraska row near the col-12/13 boundary. A leader dot also runs into the Nevada col-1 figure (printed ".415"); it is transcribed as 415.\n\nNo printed total on this page disagrees with the sum of its parts: all 16 column sums for Regions V through X, and all row-level subtotal identities (col2 = cols 3-9; col10 = cols 11-13; col1 = col2+col10+cols 14-16), reconcile exactly as transcribed.
Source image
Source data: U.S. NLRB Annual Reports (public domain). Reconstruction by NLRB Stats Archive. Read by claude-opus-5 (effort max, prompt extract_v1) from the 300-dpi scan; stitched by page. Updated October 2026.