NLRB Stats Archive › Annual Reports › FY1975 › Geographic Distribution of Cases Received, Fiscal Year 1975
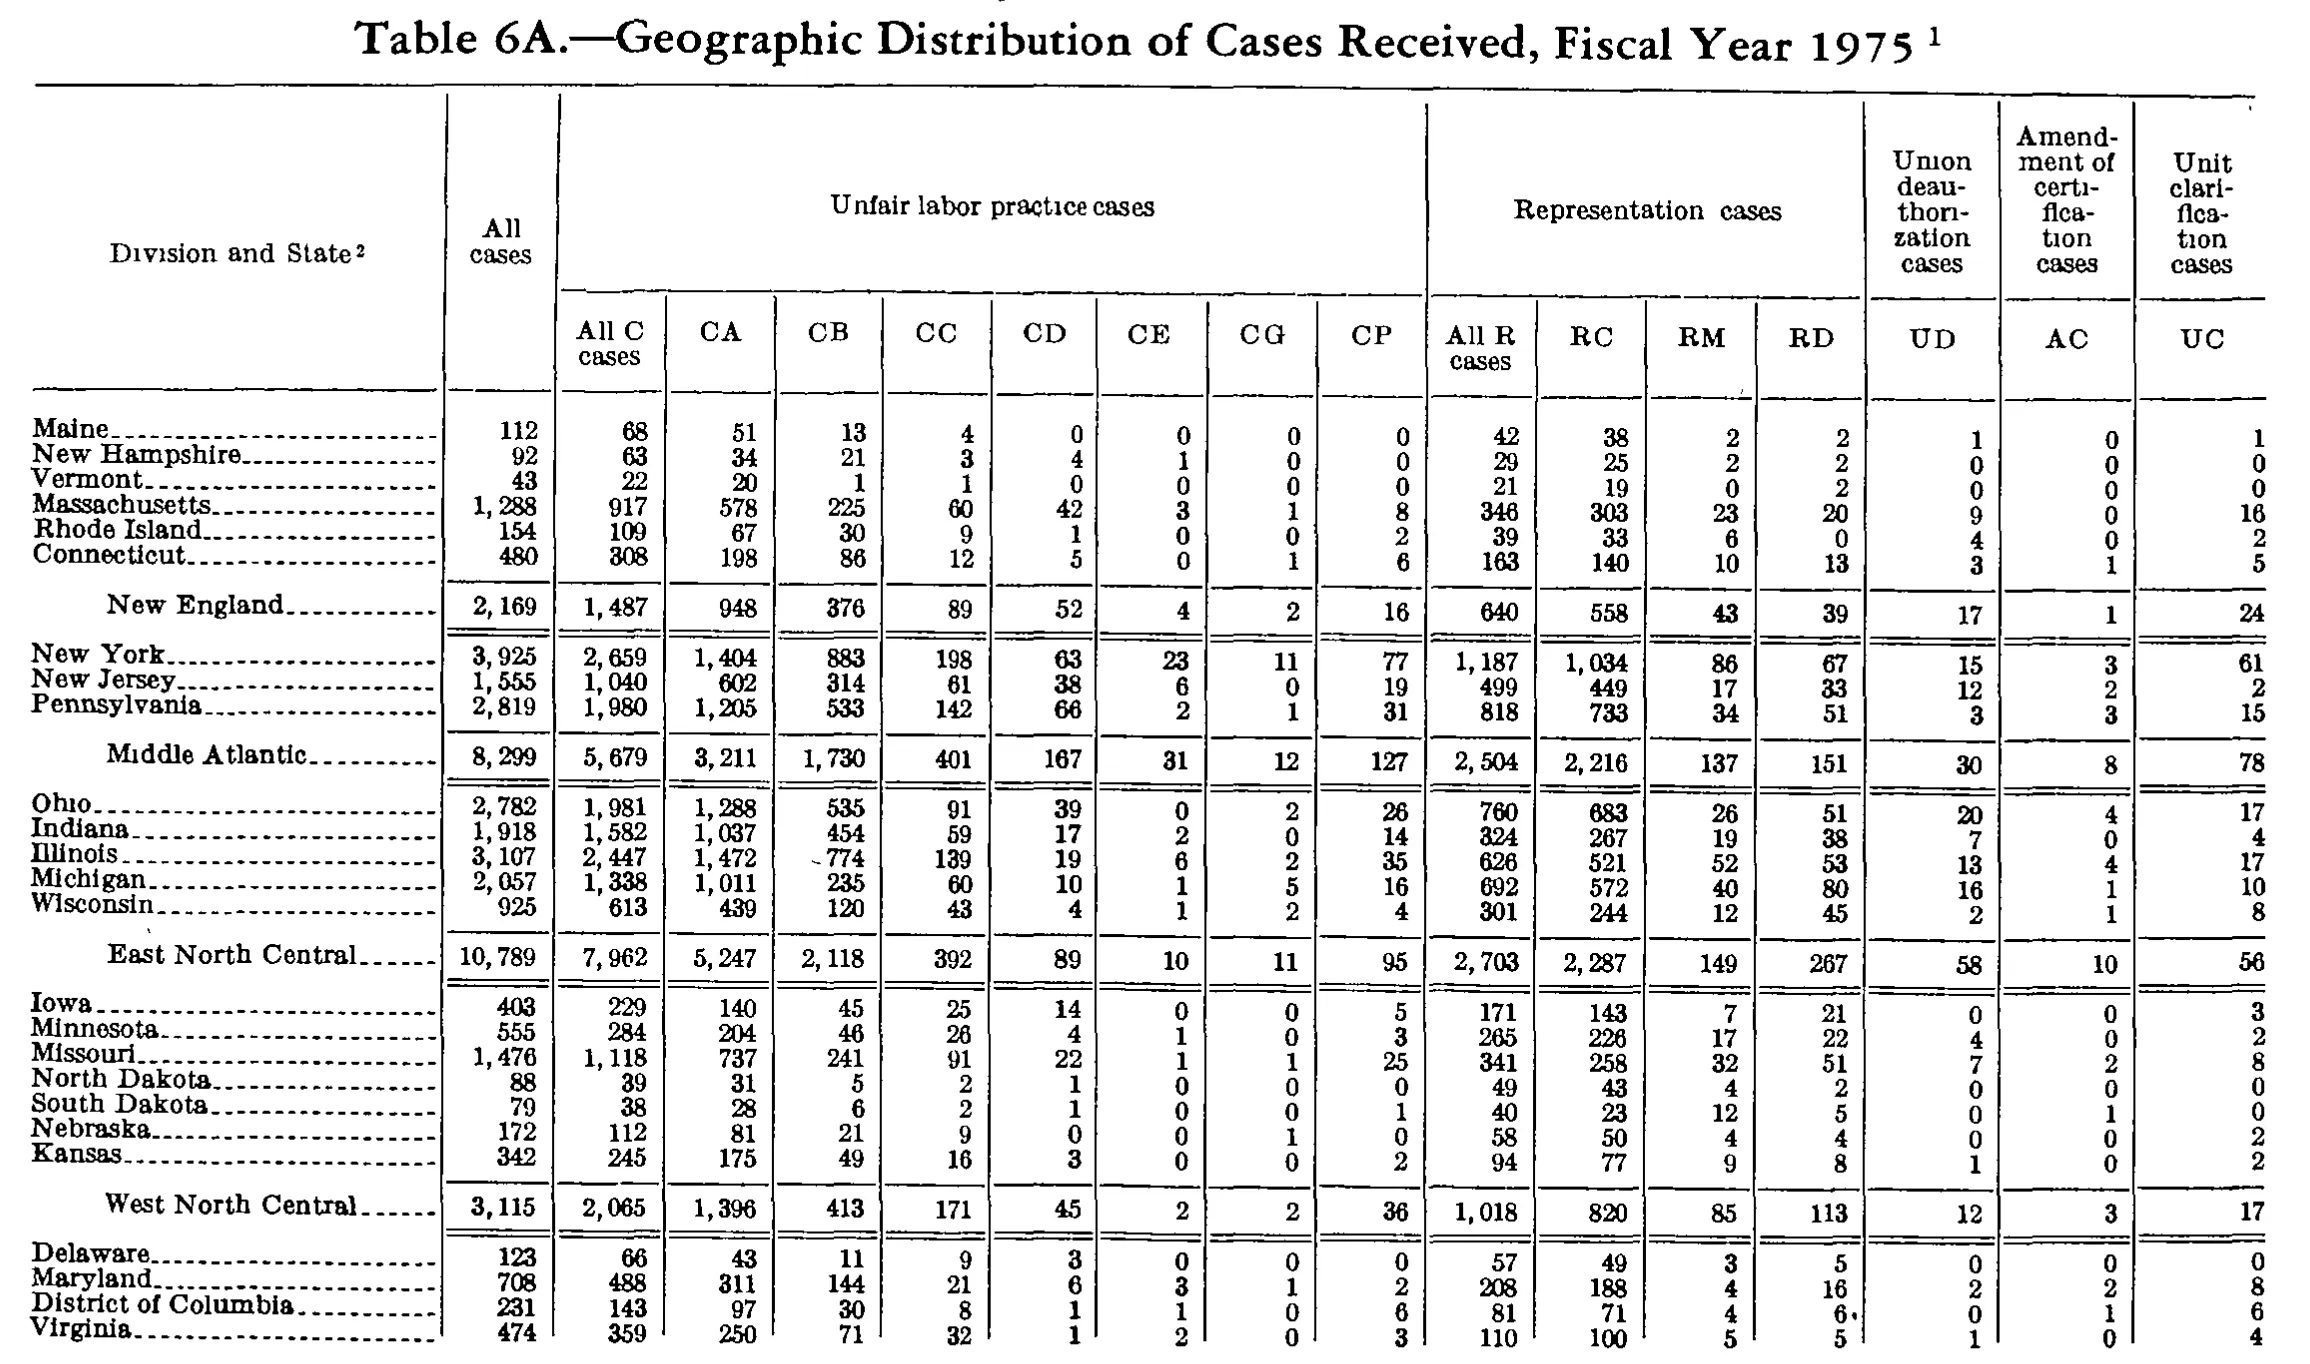
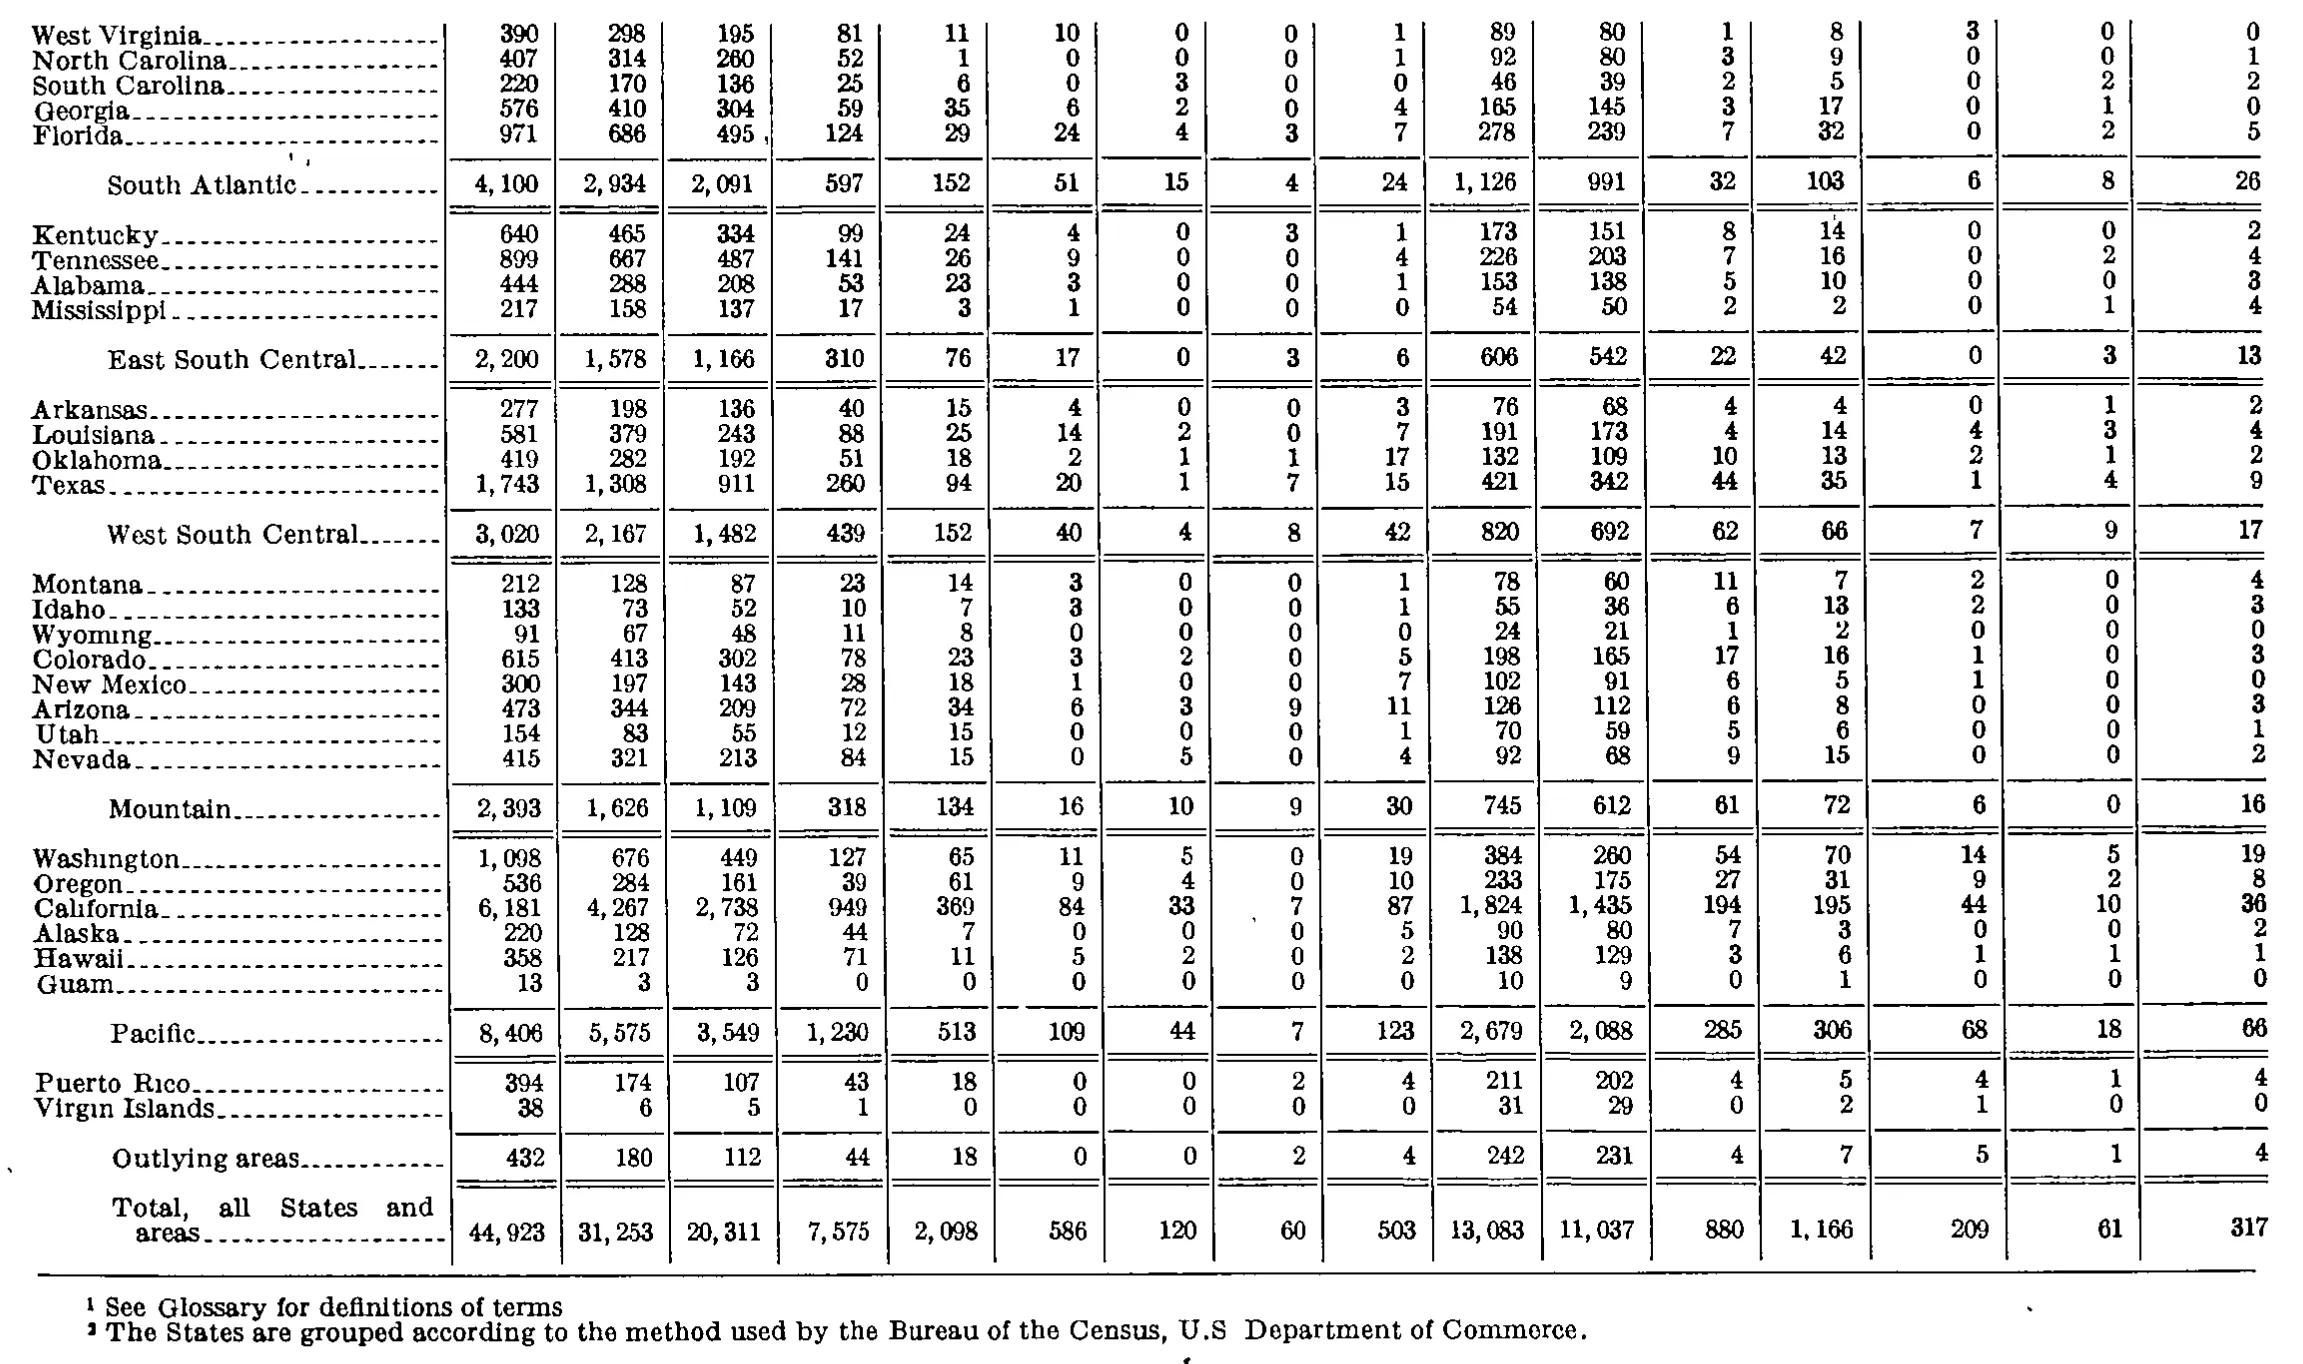
Geographic Distribution of Cases Received, Fiscal Year 1975
Stitched from pp. 227–228.
| Division and State | All cases | Unfair labor practice cases | Representation cases | Union deauthorization cases | Amendment of certification cases | Unit clarification cases | ||||||||||
|---|---|---|---|---|---|---|---|---|---|---|---|---|---|---|---|---|
| Division and State | All cases | All C cases | CA | CB | CC | CD | CE | CG | CP | All R cases | RC | RM | RD | UD | AC | UC |
| Maine | 112 | 68 | 51 | 13 | 4 | 0 | 0 | 0 | 0 | 42 | 38 | 2 | 2 | 1 | 0 | 1 |
| New Hampshire | 92 | 63 | 34 | 21 | 3 | 4 | 1 | 0 | 0 | 29 | 25 | 2 | 2 | 0 | 0 | 0 |
| Vermont | 43 | 22 | 20 | 1 | 1 | 0 | 0 | 0 | 0 | 21 | 19 | 0 | 2 | 0 | 0 | 0 |
| Massachusetts | 1,288 | 917 | 578 | 225 | 60 | 42 | 3 | 1 | 8 | 346 | 303 | 23 | 20 | 9 | 0 | 16 |
| Rhode Island | 154 | 109 | 67 | 30 | 9 | 1 | 0 | 0 | 2 | 39 | 33 | 6 | 0 | 4 | 0 | 2 |
| Connecticut | 480 | 308 | 198 | 86 | 12 | 5 | 0 | 1 | 6 | 163 | 140 | 10 | 13 | 3 | 1 | 5 |
| New England | 2,169 | 1,487 | 948 | 376 | 89 | 52 | 4 | 2 | 16 | 640 | 558 | 43 | 39 | 17 | 1 | 24 |
| New York | 3,925 | 2,659 | 1,404 | 883 | 198 | 63 | 23 | 11 | 77 | 1,187 | 1,034 | 86 | 67 | 15 | 3 | 61 |
| New Jersey | 1,555 | 1,040 | 602 | 314 | 61 | 38 | 6 | 0 | 19 | 499 | 449 | 17 | 33 | 12 | 2 | 2 |
| Pennsylvania | 2,819 | 1,980 | 1,205 | 533 | 142 | 66 | 2 | 1 | 31 | 818 | 733 | 34 | 51 | 3 | 3 | 15 |
| Middle Atlantic | 8,299 | 5,679 | 3,211 | 1,730 | 401 | 167 | 31 | 12 | 127 | 2,504 | 2,216 | 137 | 151 | 30 | 8 | 78 |
| Ohio | 2,782 | 1,981 | 1,288 | 535 | 91 | 39 | 0 | 2 | 26 | 760 | 683 | 26 | 51 | 20 | 4 | 17 |
| Indiana | 1,918 | 1,582 | 1,037 | 454 | 59 | 17 | 2 | 0 | 14 | 324 | 267 | 19 | 38 | 7 | 0 | 4 |
| Illinois | 3,107 | 2,447 | 1,472 | 774 | 139 | 19 | 6 | 2 | 35 | 626 | 521 | 52 | 53 | 13 | 4 | 17 |
| Michigan | 2,057 | 1,338 | 1,011 | 235 | 60 | 10 | 1 | 5 | 16 | 692 | 572 | 40 | 80 | 16 | 1 | 10 |
| Wisconsin | 925 | 613 | 439 | 120 | 43 | 4 | 1 | 2 | 4 | 301 | 244 | 12 | 45 | 2 | 1 | 8 |
| East North Central | 10,789 | 7,962 | 5,247 | 2,118 | 392 | 89 | 10 | 11 | 95 | 2,703 | 2,287 | 149 | 267 | 58 | 10 | 56 |
| Iowa | 403 | 229 | 140 | 45 | 25 | 14 | 0 | 0 | 5 | 171 | 143 | 7 | 21 | 0 | 0 | 3 |
| Minnesota | 555 | 284 | 204 | 46 | 26 | 4 | 1 | 0 | 3 | 265 | 226 | 17 | 22 | 4 | 0 | 2 |
| Missouri | 1,476 | 1,118 | 737 | 241 | 91 | 22 | 1 | 1 | 25 | 341 | 258 | 32 | 51 | 7 | 2 | 8 |
| North Dakota | 88 | 39 | 31 | 5 | 2 | 1 | 0 | 0 | 0 | 49 | 43 | 4 | 2 | 0 | 0 | 0 |
| South Dakota | 79 | 38 | 28 | 6 | 2 | 1 | 0 | 0 | 1 | 40 | 23 | 12 | 5 | 0 | 1 | 0 |
| Nebraska | 172 | 112 | 81 | 21 | 9 | 0 | 0 | 1 | 0 | 58 | 50 | 4 | 4 | 0 | 0 | 2 |
| Kansas | 342 | 245 | 175 | 49 | 16 | 3 | 0 | 0 | 2 | 94 | 77 | 9 | 8 | 1 | 0 | 2 |
| West North Central | 3,115 | 2,065 | 1,396 | 413 | 171 | 45 | 2 | 2 | 36 | 1,018 | 820 | 85 | 113 | 12 | 3 | 17 |
| Delaware | 123 | 66 | 43 | 11 | 9 | 3 | 0 | 0 | 0 | 57 | 49 | 3 | 5 | 0 | 0 | 0 |
| Maryland | 708 | 488 | 311 | 144 | 21 | 6 | 3 | 1 | 2 | 208 | 188 | 4 | 16 | 2 | 2 | 8 |
| District of Columbia | 231 | 143 | 97 | 30 | 8 | 1 | 1 | 0 | 6 | 81 | 71 | 4 | 6 | 0 | 1 | 6 |
| Virginia | 474 | 359 | 250 | 71 | 32 | 1 | 2 | 0 | 3 | 110 | 100 | 5 | 5 | 1 | 0 | 4 |
| West Virginia | 390 | 298 | 195 | 81 | 11 | 10 | 0 | 0 | 1 | 89 | 80 | 1 | 8 | 3 | 0 | 0 |
| North Carolina | 407 | 314 | 260 | 52 | 1 | 0 | 0 | 0 | 1 | 92 | 80 | 3 | 9 | 0 | 0 | 1 |
| South Carolina | 220 | 170 | 136 | 25 | 6 | 0 | 3 | 0 | 0 | 46 | 39 | 2 | 5 | 0 | 2 | 2 |
| Georgia | 576 | 410 | 304 | 59 | 35 | 6 | 2 | 0 | 4 | 165 | 145 | 3 | 17 | 0 | 1 | 0 |
| Florida | 971 | 686 | 495 | 124 | 29 | 24 | 4 | 3 | 7 | 278 | 239 | 7 | 32 | 0 | 2 | 5 |
| South Atlantic | 4,100 | 2,934 | 2,091 | 597 | 152 | 51 | 15 | 4 | 24 | 1,126 | 991 | 32 | 103 | 6 | 8 | 26 |
| Kentucky | 640 | 465 | 334 | 99 | 24 | 4 | 0 | 3 | 1 | 173 | 151 | 8 | 14 | 0 | 0 | 2 |
| Tennessee | 899 | 667 | 487 | 141 | 26 | 9 | 0 | 0 | 4 | 226 | 203 | 7 | 16 | 0 | 2 | 4 |
| Alabama | 444 | 288 | 208 | 53 | 23 | 3 | 0 | 0 | 1 | 153 | 138 | 5 | 10 | 0 | 0 | 3 |
| Mississippi | 217 | 158 | 137 | 17 | 3 | 1 | 0 | 0 | 0 | 54 | 50 | 2 | 2 | 0 | 1 | 4 |
| East South Central | 2,200 | 1,578 | 1,166 | 310 | 76 | 17 | 0 | 3 | 6 | 606 | 542 | 22 | 42 | 0 | 3 | 13 |
| Arkansas | 277 | 198 | 136 | 40 | 15 | 4 | 0 | 0 | 3 | 76 | 68 | 4 | 4 | 0 | 1 | 2 |
| Louisiana | 581 | 379 | 243 | 88 | 25 | 14 | 2 | 0 | 7 | 191 | 173 | 4 | 14 | 4 | 3 | 4 |
| Oklahoma | 419 | 282 | 192 | 51 | 18 | 2 | 1 | 1 | 17 | 132 | 109 | 10 | 13 | 2 | 1 | 2 |
| Texas | 1,743 | 1,308 | 911 | 260 | 94 | 20 | 1 | 7 | 15 | 421 | 342 | 44 | 35 | 1 | 4 | 9 |
| West South Central | 3,020 | 2,167 | 1,482 | 439 | 152 | 40 | 4 | 8 | 42 | 820 | 692 | 62 | 66 | 7 | 9 | 17 |
| Montana | 212 | 128 | 87 | 23 | 14 | 3 | 0 | 0 | 1 | 78 | 60 | 11 | 7 | 2 | 0 | 4 |
| Idaho | 133 | 73 | 52 | 10 | 7 | 3 | 0 | 0 | 1 | 55 | 36 | 6 | 13 | 2 | 0 | 3 |
| Wyoming | 91 | 67 | 48 | 11 | 8 | 0 | 0 | 0 | 0 | 24 | 21 | 1 | 2 | 0 | 0 | 0 |
| Colorado | 615 | 413 | 302 | 78 | 23 | 3 | 2 | 0 | 5 | 198 | 165 | 17 | 16 | 1 | 0 | 3 |
| New Mexico | 300 | 197 | 143 | 28 | 18 | 1 | 0 | 0 | 7 | 102 | 91 | 6 | 5 | 1 | 0 | 0 |
| Arizona | 473 | 344 | 209 | 72 | 34 | 6 | 3 | 9 | 11 | 126 | 112 | 6 | 8 | 0 | 0 | 3 |
| Utah | 154 | 83 | 55 | 12 | 15 | 0 | 0 | 0 | 1 | 70 | 59 | 5 | 6 | 0 | 0 | 1 |
| Nevada | 415 | 321 | 213 | 84 | 15 | 0 | 5 | 0 | 4 | 92 | 68 | 9 | 15 | 0 | 0 | 2 |
| Mountain | 2,393 | 1,626 | 1,109 | 318 | 134 | 16 | 10 | 9 | 30 | 745 | 612 | 61 | 72 | 6 | 0 | 16 |
| Washington | 1,098 | 676 | 449 | 127 | 65 | 11 | 5 | 0 | 19 | 384 | 260 | 54 | 70 | 14 | 5 | 19 |
| Oregon | 536 | 284 | 161 | 39 | 61 | 9 | 4 | 0 | 10 | 233 | 175 | 27 | 31 | 9 | 2 | 8 |
| California | 6,181 | 4,267 | 2,738 | 949 | 369 | 84 | 33 | 7 | 87 | 1,824 | 1,435 | 194 | 195 | 44 | 10 | 36 |
| Alaska | 220 | 128 | 72 | 44 | 7 | 0 | 0 | 0 | 5 | 90 | 80 | 7 | 3 | 0 | 0 | 2 |
| Hawaii | 358 | 217 | 126 | 71 | 11 | 5 | 2 | 0 | 2 | 138 | 129 | 3 | 6 | 1 | 1 | 1 |
| Guam | 13 | 3 | 3 | 0 | 0 | 0 | 0 | 0 | 0 | 10 | 9 | 0 | 1 | 0 | 0 | 0 |
| Pacific | 8,406 | 5,575 | 3,549 | 1,230 | 513 | 109 | 44 | 7 | 123 | 2,679 | 2,088 | 285 | 306 | 68 | 18 | 66 |
| Puerto Rico | 394 | 174 | 107 | 43 | 18 | 0 | 0 | 2 | 4 | 211 | 202 | 4 | 5 | 4 | 1 | 4 |
| Virgin Islands | 38 | 6 | 5 | 1 | 0 | 0 | 0 | 0 | 0 | 31 | 29 | 0 | 2 | 1 | 0 | 0 |
| Outlying areas | 432 | 180 | 112 | 44 | 18 | 0 | 0 | 2 | 4 | 242 | 231 | 4 | 7 | 5 | 1 | 4 |
| Total, all States and areas | 44,923 | 31,253 | 20,311 | 7,575 | 2,098 | 586 | 120 | 60 | 503 | 13,083 | 11,037 | 880 | 1,166 | 209 | 61 | 317 |
- 1 See Glossary for definitions of terms
- 2 The States are grouped according to the method used by the Bureau of the Census, U.S Department of Commerce.
879 of 880 figures sit in a row or column sum that works out. 3 cells break a sum: 'Indiana', column 3: prints 1,582, columns 4 to 10 add to 1,583; 'Indiana', column 2: prints 1,918, the subtotals in columns 3 to 17 add to 1,917; 'East North Central', column 3: prints 7,962, rows 'Ohio' to 'Wisconsin' add to 7,961.
Reader’s notes
p. 227. The crop ends mid-table: the last section (South Atlantic, beginning with Delaware) is cut off after the Virginia row, and no footnote text is visible below the table, so `footnotes` is empty even though the caption carries a raised 1 and the stub head a raised 2. The stub head is printed "Division and State 2" with a superscript 2, transcribed as "Division and State^2". The three right-hand headings are printed hyphenated over several lines ("Union deau-thori-zation cases", "Amend-ment of certi-fica-tion cases", "Unit clari-fica-tion cases") and have been rejoined. Doubtful cell: Indiana, "All C cases" reads 1,582 in the scan, but its own components (1,037+454+59+17+2+0+14) sum to 1,583, the row's other entries (1,583+324+7+0+4) are needed to reach the printed All cases figure of 1,918, and the East North Central column total of 7,962 also requires 1,583. It is transcribed as printed (1,582); it is either a misprint or a broken "3" glyph. Every other row and column in the table cross-foots exactly (All cases = All C + All R + UD + AC + UC; All C = CA..CP; All R = RC+RM+RD; and all four division totals equal the sum of their states). Minor scan artifacts, transcribed as the clean digits: Illinois CB 774 has a stray dash-like speck to its left (leader-dot remnant), and District of Columbia RD 6 has a small speck after it.
p. 228. Continuation page: no column headings are printed on this crop (the table begins on an earlier page), so header_rows is empty. The grid has 17 cells per row: stub plus 16 numeric columns. Column structure was confirmed arithmetically: column 2 equals the sum of columns 3-9, column 10 equals the sum of columns 11-13, and column 1 equals column 2 + column 10 + columns 14-16. Every state row, every regional subtotal row and the grand-total row satisfies these identities, and each regional subtotal equals the sum of its constituent state rows for the regions wholly contained on this page (East South Central, West South Central, Mountain, Pacific, Outlying areas). No arithmetic discrepancies were found. Doubtful cells: in the Georgia row the last three columns are faint and partly overlapped by ink from the neighbouring rows; I read them as 0, 1, 0 (columns 14, 15, 16). Their sum must be 1 for the row to total 576, which it does as transcribed, but the placement of the 1 in column 15 rather than column 14 or 16 is the least certain reading on the page. The North Carolina tail (0, 0, 1) is similarly tight but is consistent with its printed total of 407. In the Florida row there is a small comma-shaped speck just right of 495 in column 3; it is not a digit-grouping comma and has been dropped. In footnote 2 the marker is a raised numeral that prints somewhat like a 3 in this face; it is the second footnote and is transcribed as 2. In the same footnote "U.S" appears without a period after the S in the scan (the period may simply have dropped out); it is transcribed as it appears. Footnote 1 likewise shows no terminal period. The section headings printed in the stub (South Atlantic, East South Central, West South Central, Mountain, Pacific, Outlying areas) are subtotal rows carrying values, not blank section lines, and are transcribed as such. The last row's label wraps as "Total, all States and / areas" and has been joined.
Source image
Source data: U.S. NLRB Annual Reports (public domain). Reconstruction by NLRB Stats Archive. Read by claude-opus-5 (effort max, prompt extract_v1) from the 300-dpi scan; stitched by page. Updated October 2026.