NLRB Stats Archive › Annual Reports › FY1975 › Cases received, by industrial group and type
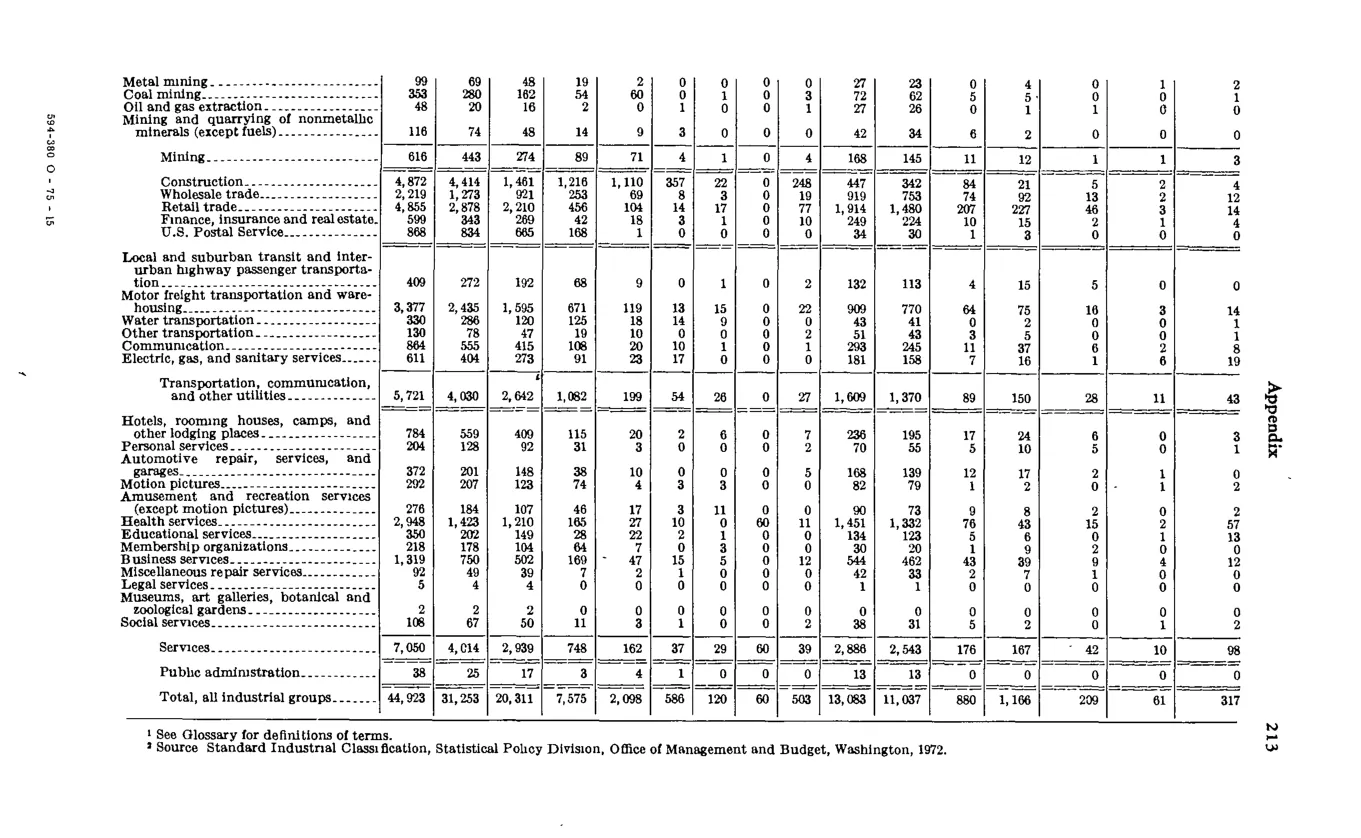
Cases received, by industrial group and type
| Industrial group | All cases | All C cases | CA | CB | CC | CD | CE | CG | CP | All R cases | RC | RM | RD | UD | AC | UC |
|---|---|---|---|---|---|---|---|---|---|---|---|---|---|---|---|---|
| Mining (subtotal) | 616 | 443 | 274 | 89 | 71 | 6 | 1 | 2 | 0 | 168 | 145 | 11 | 12 | 1 | 1 | 3 |
| Transportation, communication, and other utilities (subtotal) | 5,721 | 4,030 | 2,542 | 1,162 | 199 | 34 | 27 | 8 | 7 | 1,609 | 1,370 | 89 | 150 | 28 | 11 | 43 |
| Services (subtotal) | 7,030 | 4,014 | 2,930 | 748 | 192 | 29 | 60 | 20 | 35 | 2,858 | 2,556 | 129 | 167 | 5 | 55 | 98 |
| Public administration | ||||||||||||||||
| Total, all industrial groups | 44,923 | 31,253 | 20,311 | 7,575 | 2,008 | 566 | 120 | 60 | 133 | 13,083 | 11,037 | 680 | 1,196 | 20 | 61 | 317 |
Source image
Source data: U.S. NLRB Annual Reports (public domain). Reconstruction by NLRB Stats Archive. Updated June 2026.