NLRB Stats Archive › Annual Reports › FY1975 › Types of Unfair Labor Practices Alleged, Fiscal Year 1975
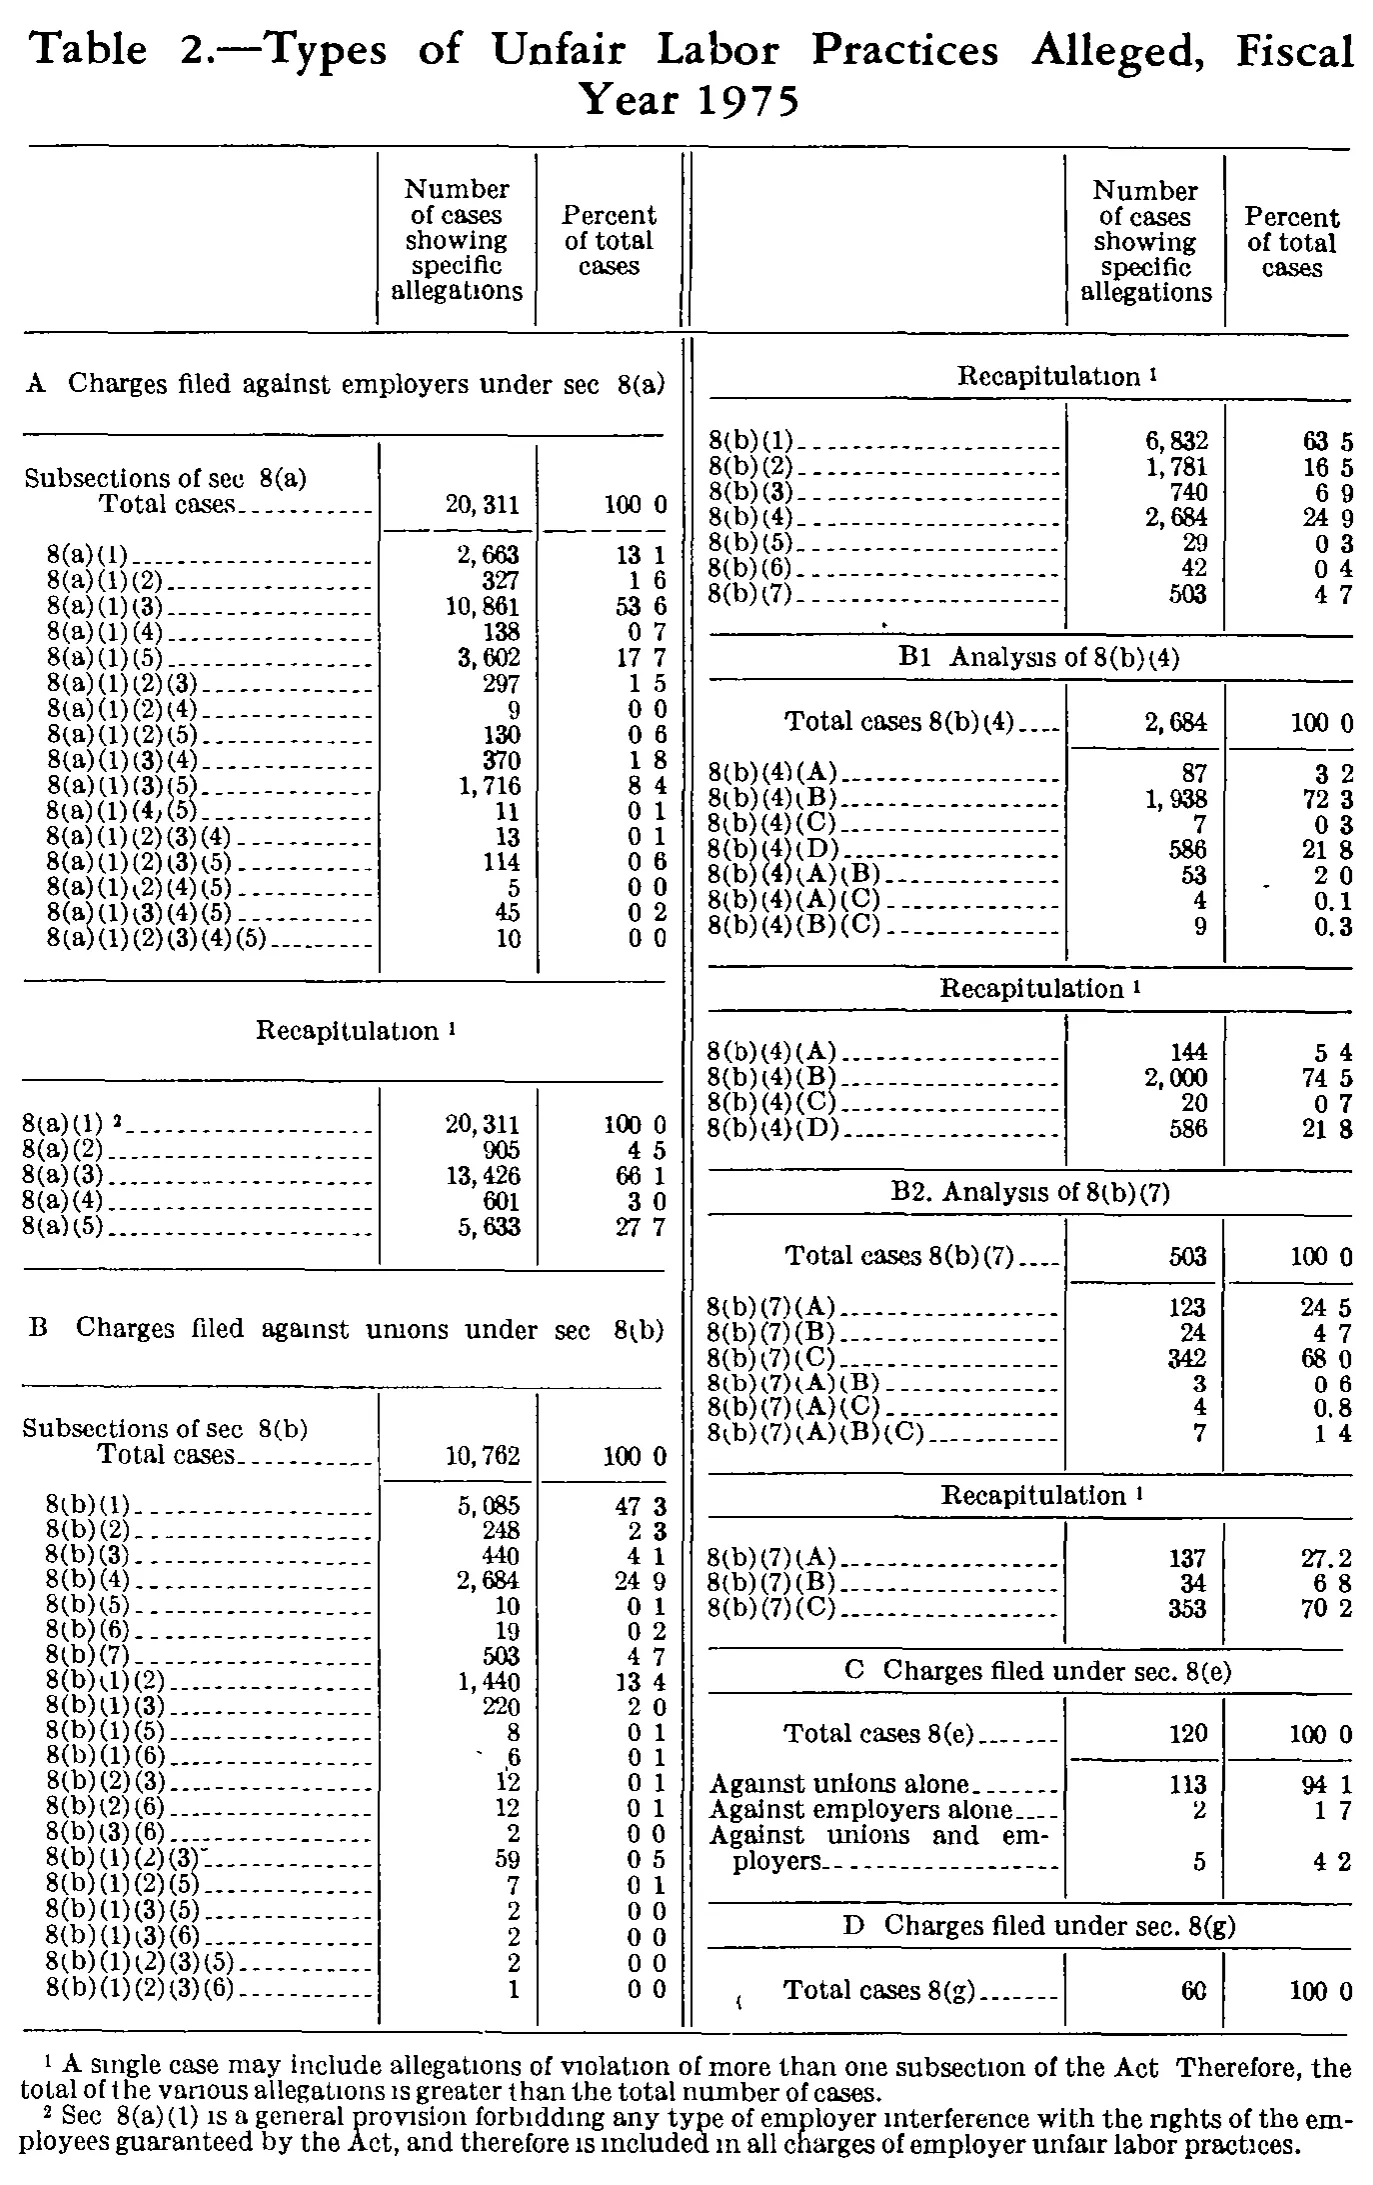
Types of Unfair Labor Practices Alleged, Fiscal Year 1975
| Number of cases showing specific allegations | Percent of total cases | |
|---|---|---|
| A. Charges filed against employers under sec. 8(a) | ||
| Subsections of sec. 8(a) | ||
| Total cases | 20,311 | 100.0 |
| 8(a)(1) | 2,663 | 13.1 |
| 8(a)(1)(2) | 327 | 1.6 |
| 8(a)(1)(3) | 10,861 | 53.6 |
| 8(a)(1)(4) | 138 | 0.7 |
| 8(a)(1)(5) | 3,602 | 17.7 |
| 8(a)(1)(2)(3) | 297 | 1.5 |
| 8(a)(1)(2)(4) | 9 | 0.0 |
| 8(a)(1)(2)(5) | 130 | 0.6 |
| 8(a)(1)(3)(4) | 370 | 1.8 |
| 8(a)(1)(3)(5) | 1,716 | 8.4 |
| 8(a)(1)(4)(5) | 11 | 0.1 |
| 8(a)(1)(2)(3)(4) | 13 | 0.1 |
| 8(a)(1)(2)(3)(5) | 114 | 0.6 |
| 8(a)(1)(2)(4)(5) | 5 | 0.0 |
| 8(a)(1)(3)(4)(5) | 45 | 0.2 |
| 8(a)(1)(2)(3)(4)(5) | 10 | 0.0 |
| Recapitulation | ||
| 8(a)(1) | 20,311 | 100.0 |
| 8(a)(2) | 905 | 4.5 |
| 8(a)(3) | 13,426 | 66.1 |
| 8(a)(4) | 601 | 3.0 |
| 8(a)(5) | 5,633 | 27.7 |
| B. Charges filed against unions under sec. 8(b) | ||
| Subsections of sec. 8(b) | ||
| Total cases | 10,762 | 100.0 |
| 8(b)(1) | 5,085 | 47.3 |
| 8(b)(2) | 248 | 2.3 |
| 8(b)(3) | 440 | 4.1 |
| 8(b)(4) | 2,684 | 24.9 |
| 8(b)(5) | 10 | 0.1 |
| 8(b)(6) | 19 | 0.2 |
| 8(b)(7) | 503 | 4.7 |
| 8(b)(1)(2) | 1,440 | 13.4 |
| 8(b)(1)(3) | 220 | 2.0 |
| 8(b)(1)(5) | 8 | 0.1 |
| 8(b)(1)(6) | 6 | 0.1 |
| 8(b)(2)(3) | 12 | 0.1 |
| 8(b)(2)(6) | 12 | 0.1 |
| 8(b)(3)(6) | 2 | 0.0 |
| 8(b)(1)(2)(3) | 59 | 0.5 |
| 8(b)(1)(2)(5) | 7 | 0.1 |
| 8(b)(1)(3)(5) | 2 | 0.0 |
| 8(b)(1)(3)(6) | 2 | 0.0 |
| 8(b)(1)(2)(3)(5) | 2 | 0.0 |
| 8(b)(1)(2)(3)(6) | 1 | 0.0 |
| Recapitulation | ||
| 8(b)(1) | 6,832 | 63.5 |
| 8(b)(2) | 1,781 | 16.5 |
| 8(b)(3) | 740 | 6.9 |
| 8(b)(4) | 2,684 | 24.9 |
| 8(b)(5) | 29 | 0.3 |
| 8(b)(6) | 42 | 0.4 |
| 8(b)(7) | 503 | 4.7 |
| B1. Analysis of 8(b)(4) | ||
| Total cases 8(b)(4) | 2,684 | 100.0 |
| 8(b)(4)(A) | 87 | 3.2 |
| 8(b)(4)(B) | 1,938 | 72.3 |
| 8(b)(4)(C) | 7 | 0.3 |
| 8(b)(4)(D) | 586 | 21.8 |
| 8(b)(4)(A)(B) | 53 | 2.0 |
| 8(b)(4)(A)(C) | 4 | 0.1 |
| 8(b)(4)(B)(C) | 9 | 0.3 |
| Recapitulation | ||
| 8(b)(4)(A) | 144 | 5.4 |
| 8(b)(4)(B) | 2,000 | 74.5 |
| 8(b)(4)(C) | 20 | 0.7 |
| 8(b)(4)(D) | 586 | 21.8 |
| B2. Analysis of 8(b)(7) | ||
| Total cases 8(b)(7) | 503 | 100.0 |
| 8(b)(7)(A) | 123 | 24.5 |
| 8(b)(7)(B) | 24 | 4.7 |
| 8(b)(7)(C) | 342 | 68.0 |
| 8(b)(7)(A)(B) | 3 | 0.6 |
| 8(b)(7)(A)(C) | 4 | 0.8 |
| 8(b)(7)(A)(B)(C) | 7 | 1.4 |
| Recapitulation | ||
| 8(b)(7)(A) | 137 | 27.2 |
| 8(b)(7)(B) | 34 | 6.8 |
| 8(b)(7)(C) | 353 | 70.2 |
| C. Charges filed under sec. 8(e) | ||
| Total cases 8(e) | 120 | 100.0 |
| Against unions alone | 113 | 94.1 |
| Against employers alone | 2 | 1.7 |
| Against unions and employers | 5 | 4.2 |
| D. Charges filed under sec. 8(g) | ||
| Total cases 8(g) | 60 | 100.0 |
- 1 A single case may include allegations of violation of more than one subsection of the Act. Therefore, the total of the various allegations is greater than the total number of cases.
- 2 Sec. 8(a)(1) is a general provision forbidding any type of employer interference with the rights of the employees guaranteed by the Act, and therefore is included in all charges of employer unfair labor practices.
0 of 77 figures sit in a row or column sum that works out.
Reader’s notes
p. 218. Two-panel table: the left panel (sections A and B, through 8(b)(1)(2)(3)(6)) is given first, then the right panel (the 8(b) Recapitulation through section D). The column headings are printed once over each panel and are given once here; the stub column has no printed heading. Punctuation is badly degraded in this 1-bit scan. (a) The decimal point in the "Percent of total cases" column is invisible in most cells (printed as e.g. "100 0", "13 1"); a few cells retain it clearly ("0.1", "0.3", "0.8", "27.2", "70.2"), and all values in that column are one-decimal percents, so I have written the decimal point in every cell of that column. (b) Periods after the section letters and after "sec" are likewise faint or lost ("A Charges filed ... under sec 8(a)", "B1 Analysis of 8(b)(4)"), while others print clearly ("B2. Analysis of 8(b)(7)", "sec. 8(e)", "sec. 8(g)"); I have written them consistently with periods. Structure: "Subsections of sec. 8(a)" and "Subsections of sec. 8(b)" are printed flush left with an indented "Total cases" line carrying the values beneath each; I have treated them as label-only stub headings followed by a separate "Total cases" data row. They could alternatively be read as one wrapped label ("Subsections of sec. 8(a) Total cases"). Arithmetic checks: the detail lines sum exactly to the printed totals (20,311 and 10,762) and every recapitulation figure reproduces exactly from the detail, so the case counts are well corroborated. Three printed percents are 0.1 above the value implied by the printed counts and appear to be printer's roundings (or possible misreads of a faint digit): 8(a)(1)(3) shows 53.6 where 10,861/20,311 = 53.5; 8(b)(1) (subsections) shows 47.3 where 5,085/10,762 = 47.2; 8(b)(4)(B) shows 72.3 where 1,938/2,684 = 72.2. All are transcribed as printed. The "Percent of total cases" cell for 8(b)(4)(A)(B) (value 2.0) has a stray ink mark to its left in the gutter, and the 8(b)(1)(6) count (6) and the "Total cases 8(g)" row label each have a small stray mark before them; these are scan artifacts, not footnote markers.
Source image
Source data: U.S. NLRB Annual Reports (public domain). Reconstruction by NLRB Stats Archive. Read by claude-opus-5 (effort max, prompt extract_v1) from the 300-dpi scan; stitched by page. Updated October 2026.