NLRB Stats Archive › Annual Reports › FY1974 › Distribution of Unfair Labor Practice Situations Received, by Number of Employees in Establishments, Fiscal Year 1974
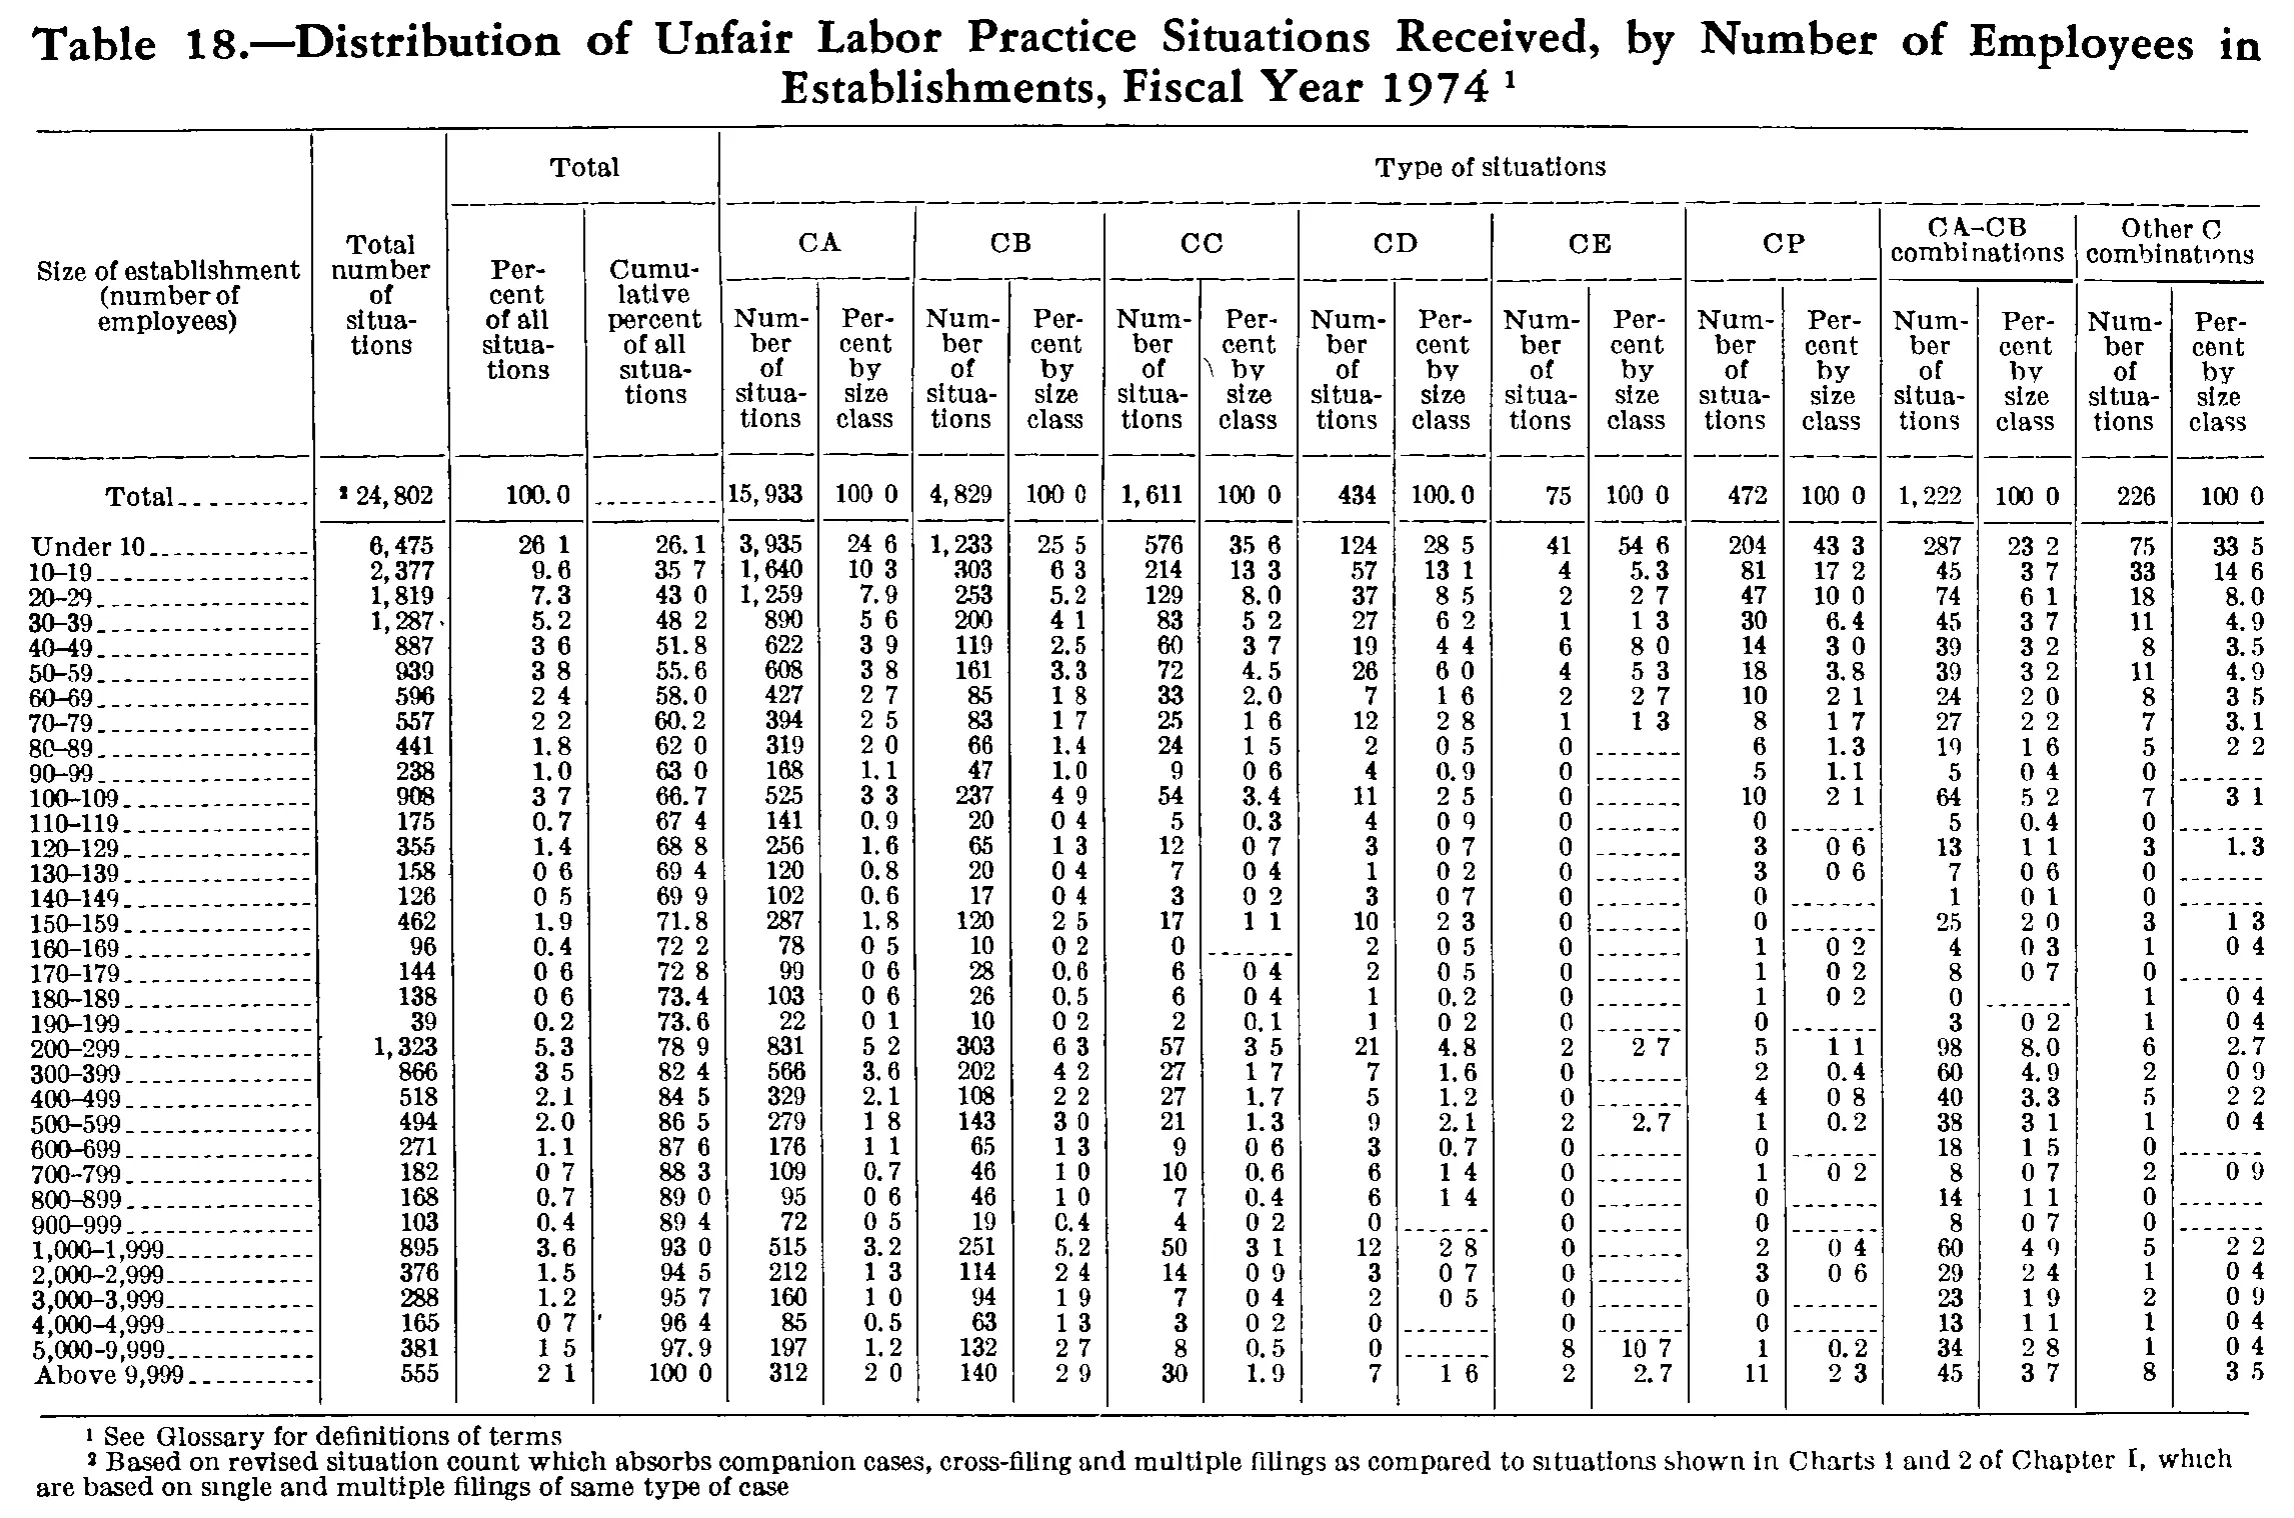
Distribution of Unfair Labor Practice Situations Received, by Number of Employees in Establishments, Fiscal Year 1974
| Size of establishment (number of employees) | Total number of situations | Total | Type of situations | ||||||||||||||||
|---|---|---|---|---|---|---|---|---|---|---|---|---|---|---|---|---|---|---|---|
| Size of establishment (number of employees) | Total number of situations | Percent of all situations | Cumulative percent of all situations | CA | CB | CC | CD | CE | CP | CA-CB combinations | Other C combinations | ||||||||
| Size of establishment (number of employees) | Total number of situations | Percent of all situations | Cumulative percent of all situations | Number of situations | Percent by size class | Number of situations | Percent by size class | Number of situations | Percent by size class | Number of situations | Percent by size class | Number of situations | Percent by size class | Number of situations | Percent by size class | Number of situations | Percent by size class | Number of situations | Percent by size class |
| Total | 24,802 | 100.0 | 15,933 | 100.0 | 4,829 | 100.0 | 1,611 | 100.0 | 434 | 100.0 | 75 | 100.0 | 472 | 100.0 | 1,222 | 100.0 | 226 | 100.0 | |
| Under 10 | 6,475 | 26.1 | 26.1 | 3,935 | 24.6 | 1,233 | 25.5 | 576 | 35.6 | 124 | 28.5 | 41 | 54.6 | 204 | 43.3 | 287 | 23.2 | 75 | 33.5 |
| 10-19 | 2,377 | 9.6 | 35.7 | 1,640 | 10.3 | 303 | 6.3 | 214 | 13.3 | 57 | 13.1 | 4 | 5.3 | 81 | 17.2 | 45 | 3.7 | 33 | 14.6 |
| 20-29 | 1,819 | 7.3 | 43.0 | 1,259 | 7.9 | 253 | 5.2 | 129 | 8.0 | 37 | 8.5 | 2 | 2.7 | 47 | 10.0 | 74 | 6.1 | 18 | 8.0 |
| 30-39 | 1,287 | 5.2 | 48.2 | 890 | 5.6 | 200 | 4.1 | 83 | 5.2 | 27 | 6.2 | 1 | 1.3 | 30 | 6.4 | 45 | 3.7 | 11 | 4.9 |
| 40-49 | 887 | 3.6 | 51.8 | 622 | 3.9 | 119 | 2.5 | 60 | 3.7 | 19 | 4.4 | 6 | 8.0 | 14 | 3.0 | 39 | 3.2 | 8 | 3.5 |
| 50-59 | 939 | 3.8 | 55.6 | 608 | 3.8 | 161 | 3.3 | 72 | 4.5 | 26 | 6.0 | 4 | 5.3 | 18 | 3.8 | 39 | 3.2 | 11 | 4.9 |
| 60-69 | 596 | 2.4 | 58.0 | 427 | 2.7 | 85 | 1.8 | 33 | 2.0 | 7 | 1.6 | 2 | 2.7 | 10 | 2.1 | 24 | 2.0 | 8 | 3.5 |
| 70-79 | 557 | 2.2 | 60.2 | 394 | 2.5 | 83 | 1.7 | 25 | 1.6 | 12 | 2.8 | 1 | 1.3 | 8 | 1.7 | 27 | 2.2 | 7 | 3.1 |
| 80-89 | 441 | 1.8 | 62.0 | 319 | 2.0 | 66 | 1.4 | 24 | 1.5 | 2 | 0.5 | 0 | 6 | 1.3 | 19 | 1.6 | 5 | 2.2 | |
| 90-99 | 238 | 1.0 | 63.0 | 168 | 1.1 | 47 | 1.0 | 9 | 0.6 | 4 | 0.9 | 0 | 5 | 1.1 | 5 | 0.4 | 0 | ||
| 100-109 | 908 | 3.7 | 66.7 | 525 | 3.3 | 237 | 4.9 | 54 | 3.4 | 11 | 2.5 | 0 | 10 | 2.1 | 64 | 5.2 | 7 | 3.1 | |
| 110-119 | 175 | 0.7 | 67.4 | 141 | 0.9 | 20 | 0.4 | 5 | 0.3 | 4 | 0.9 | 0 | 0 | 5 | 0.4 | 0 | |||
| 120-129 | 355 | 1.4 | 68.8 | 256 | 1.6 | 65 | 1.3 | 12 | 0.7 | 3 | 0.7 | 0 | 3 | 0.6 | 13 | 1.1 | 3 | 1.3 | |
| 130-139 | 158 | 0.6 | 69.4 | 120 | 0.8 | 20 | 0.4 | 7 | 0.4 | 1 | 0.2 | 0 | 3 | 0.6 | 7 | 0.6 | 0 | ||
| 140-149 | 126 | 0.5 | 69.9 | 102 | 0.6 | 17 | 0.4 | 3 | 0.2 | 3 | 0.7 | 0 | 0 | 1 | 0.1 | 0 | |||
| 150-159 | 462 | 1.9 | 71.8 | 287 | 1.8 | 120 | 2.5 | 17 | 1.1 | 10 | 2.3 | 0 | 0 | 25 | 2.0 | 3 | 1.3 | ||
| 160-169 | 96 | 0.4 | 72.2 | 78 | 0.5 | 10 | 0.2 | 0 | 2 | 0.5 | 0 | 1 | 0.2 | 4 | 0.3 | 1 | 0.4 | ||
| 170-179 | 144 | 0.6 | 72.8 | 99 | 0.6 | 28 | 0.6 | 6 | 0.4 | 2 | 0.5 | 0 | 1 | 0.2 | 8 | 0.7 | 0 | ||
| 180-189 | 138 | 0.6 | 73.4 | 103 | 0.6 | 26 | 0.5 | 6 | 0.4 | 1 | 0.2 | 0 | 1 | 0.2 | 0 | 1 | 0.4 | ||
| 190-199 | 39 | 0.2 | 73.6 | 22 | 0.1 | 10 | 0.2 | 2 | 0.1 | 1 | 0.2 | 0 | 0 | 3 | 0.2 | 1 | 0.4 | ||
| 200-299 | 1,323 | 5.3 | 78.9 | 831 | 5.2 | 303 | 6.3 | 57 | 3.5 | 21 | 4.8 | 2 | 2.7 | 5 | 1.1 | 98 | 8.0 | 6 | 2.7 |
| 300-399 | 866 | 3.5 | 82.4 | 566 | 3.6 | 202 | 4.2 | 27 | 1.7 | 7 | 1.6 | 0 | 2 | 0.4 | 60 | 4.9 | 2 | 0.9 | |
| 400-499 | 518 | 2.1 | 84.5 | 329 | 2.1 | 108 | 2.2 | 27 | 1.7 | 5 | 1.2 | 0 | 4 | 0.8 | 40 | 3.3 | 5 | 2.2 | |
| 500-599 | 494 | 2.0 | 86.5 | 279 | 1.8 | 143 | 3.0 | 21 | 1.3 | 9 | 2.1 | 2 | 2.7 | 1 | 0.2 | 38 | 3.1 | 1 | 0.4 |
| 600-699 | 271 | 1.1 | 87.6 | 176 | 1.1 | 65 | 1.3 | 9 | 0.6 | 3 | 0.7 | 0 | 0 | 18 | 1.5 | 0 | |||
| 700-799 | 182 | 0.7 | 88.3 | 109 | 0.7 | 46 | 1.0 | 10 | 0.6 | 6 | 1.4 | 0 | 1 | 0.2 | 8 | 0.7 | 2 | 0.9 | |
| 800-899 | 168 | 0.7 | 89.0 | 95 | 0.6 | 46 | 1.0 | 7 | 0.4 | 6 | 1.4 | 0 | 0 | 14 | 1.1 | 0 | |||
| 900-999 | 103 | 0.4 | 89.4 | 72 | 0.5 | 19 | 0.4 | 4 | 0.2 | 0 | 0 | 0 | 8 | 0.7 | 0 | ||||
| 1,000-1,999 | 895 | 3.6 | 93.0 | 515 | 3.2 | 251 | 5.2 | 50 | 3.1 | 12 | 2.8 | 0 | 2 | 0.4 | 60 | 4.9 | 5 | 2.2 | |
| 2,000-2,999 | 376 | 1.5 | 94.5 | 212 | 1.3 | 114 | 2.4 | 14 | 0.9 | 3 | 0.7 | 0 | 3 | 0.6 | 29 | 2.4 | 1 | 0.4 | |
| 3,000-3,999 | 288 | 1.2 | 95.7 | 160 | 1.0 | 94 | 1.9 | 7 | 0.4 | 2 | 0.5 | 0 | 0 | 23 | 1.9 | 2 | 0.9 | ||
| 4,000-4,999 | 165 | 0.7 | 96.4 | 85 | 0.5 | 63 | 1.3 | 3 | 0.2 | 0 | 0 | 0 | 13 | 1.1 | 1 | 0.4 | |||
| 5,000-9,999 | 381 | 1.5 | 97.9 | 197 | 1.2 | 132 | 2.7 | 8 | 0.5 | 0 | 8 | 10.7 | 1 | 0.2 | 34 | 2.8 | 1 | 0.4 | |
| Above 9,999 | 555 | 2.1 | 100.0 | 312 | 2.0 | 140 | 2.9 | 30 | 1.9 | 7 | 1.6 | 2 | 2.7 | 11 | 2.3 | 45 | 3.7 | 8 | 3.5 |
- 1 See Glossary for definitions of terms
- 2 Based on revised situation count which absorbs companion cases, cross-filing and multiple filings as compared to situations shown in Charts 1 and 2 of Chapter I, which are based on single and multiple filings of same type of case
271 of 271 figures sit in a row or column sum that works out.
Reader’s notes
p. 251. 20 printed columns: stub, "Total number of situations" (a tall heading spanning all three heading levels), two columns under "Total", and eight Number/Percent pairs under "Type of situations" (CA, CB, CC, CD, CE, CP, CA-CB combinations, Other C combinations). Decimal points: this is a coarse 1-bit scan and the period in the percent columns frequently fails to print, so very many percent cells appear as a digit, a gap, then a digit ("26 1", "100 0", "0 4"). These are decimal values and I have transcribed them with the decimal point restored ("26.1", "100.0", "0.4"), the same repair the instructions prescribe for a space after a digit-grouping comma. No percent cell was ambiguous as to which digits it contained; only the point itself was faint. The caption's footnote marker 1 and the marker on the Total row's situation count are both small raised figures; the latter is slightly blotted but is the 2 that matches the second printed footnote, so it is given as 24,802^2. Cells that are blank or hold only a dash rule are "" — these appear chiefly in the CE, CP, CA-CB and Other C percent columns on rows whose count is 0, and in the Cumulative percent column of the Total row. In rows 140-149 and 190-199 the empty percent cells in the CP and Other C columns are faint enough that I cannot tell blank from dash rule, but either reading maps to "". Stray ink: a comma-like mark trails "1,287" in the 30-39 row and an apostrophe-like mark trails "96.4" in the 4,000-4,999 row; both are treated as scanning artifacts and not transcribed. Row-label dashes are printed as en dashes (e.g. "10–19", "CA–CB combinations"); transcribed with plain hyphens. Column totals were not checked or adjusted — all values are as printed.
Source image
Source data: U.S. NLRB Annual Reports (public domain). Reconstruction by NLRB Stats Archive. Read by claude-opus-5 (effort max, prompt extract_v1) from the 300-dpi scan; stitched by page. Updated October 2026.