NLRB Stats Archive › Annual Reports › FY1974 › Size of Units in Representation Election Cases Closed, Fiscal Year 19741 Elections in which representation rights were won by Thirty-ninth Annual Report of the National Labor Relations Board
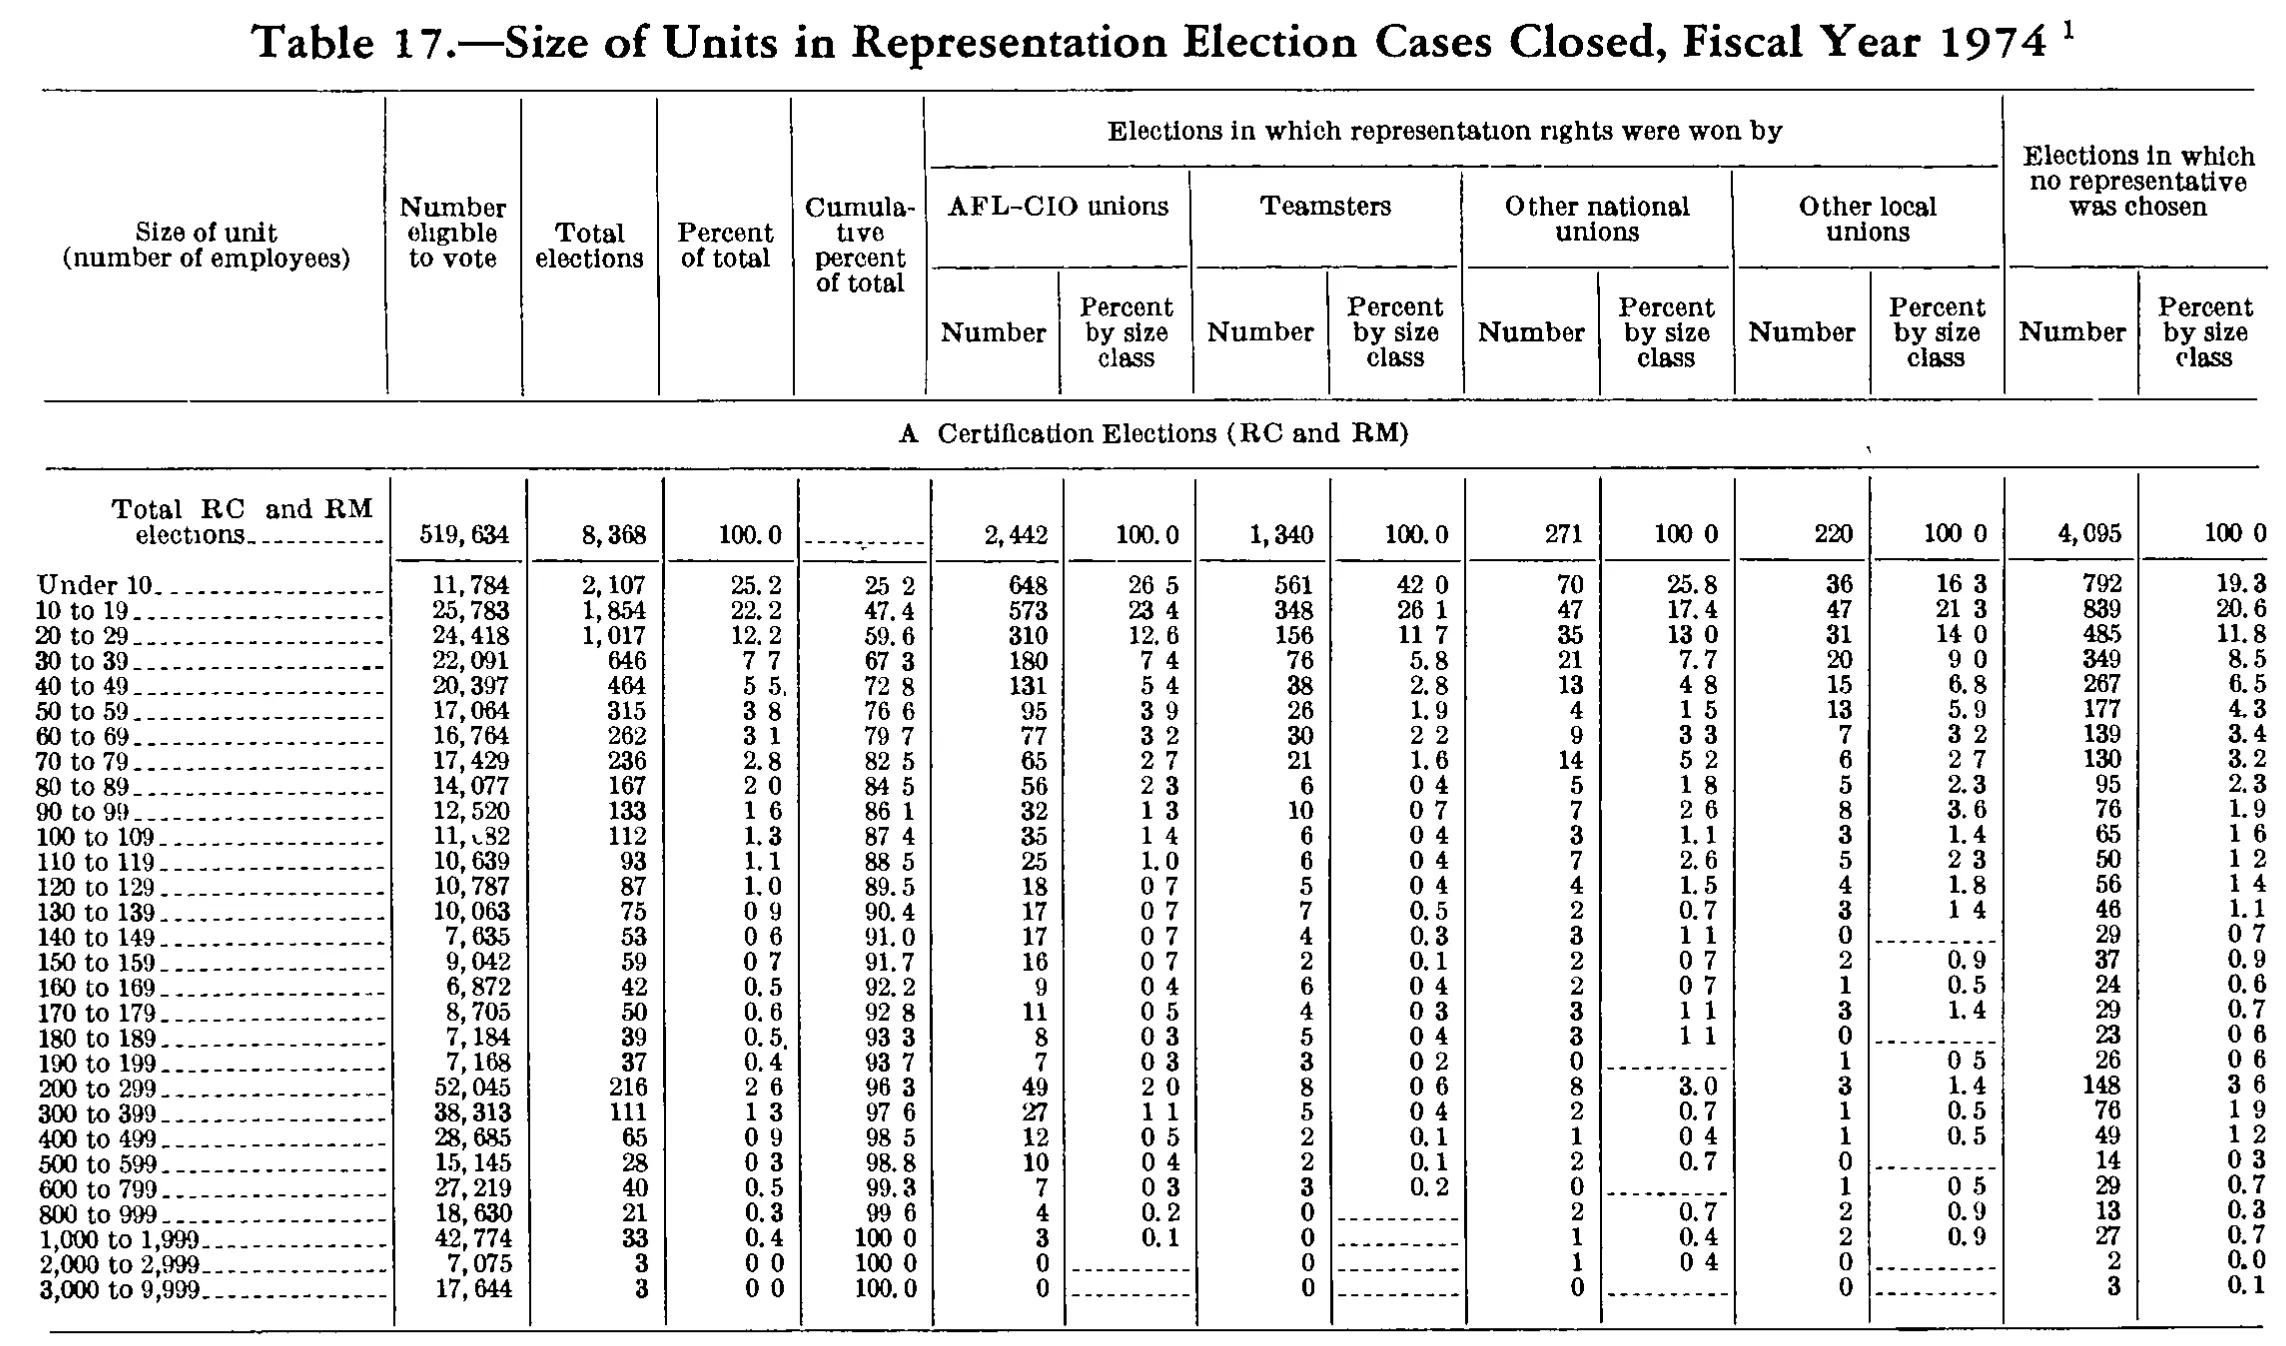
Size of Units in Representation Election Cases Closed, Fiscal Year 19741 Elections in which representation rights were won by Thirty-ninth Annual Report of the National Labor Relations Board
Stitched from pp. 249–250.
| Size of unit (number of employees) | Number eligible to vote | Total elections | Percent of total | Cumulative percent of total | Elections in which representation rights were won by | Elections in which no representative was chosen | ||||||||
|---|---|---|---|---|---|---|---|---|---|---|---|---|---|---|
| Size of unit (number of employees) | Number eligible to vote | Total elections | Percent of total | Cumulative percent of total | AFL-CIO unions | Teamsters | Other national unions | Other local unions | Elections in which no representative was chosen | |||||
| Size of unit (number of employees) | Number eligible to vote | Total elections | Percent of total | Cumulative percent of total | Number | Percent by size class | Number | Percent by size class | Number | Percent by size class | Number | Percent by size class | Number | Percent by size class |
| A. Certification Elections (RC and RM) | ||||||||||||||
| Total RC and RM elections | 519,634 | 8,368 | 100.0 | 2,442 | 100.0 | 1,340 | 100.0 | 271 | 100.0 | 220 | 100.0 | 4,095 | 100.0 | |
| Under 10 | 11,784 | 2,107 | 25.2 | 25.2 | 648 | 26.5 | 561 | 42.0 | 70 | 25.8 | 36 | 16.3 | 792 | 19.3 |
| 10 to 19 | 25,783 | 1,854 | 22.2 | 47.4 | 573 | 23.4 | 348 | 26.1 | 47 | 17.4 | 47 | 21.3 | 839 | 20.6 |
| 20 to 29 | 24,418 | 1,017 | 12.2 | 59.6 | 310 | 12.6 | 156 | 11.7 | 35 | 13.0 | 31 | 14.0 | 485 | 11.8 |
| 30 to 39 | 22,091 | 646 | 7.7 | 67.3 | 180 | 7.4 | 76 | 5.8 | 21 | 7.7 | 20 | 9.0 | 349 | 8.5 |
| 40 to 49 | 20,397 | 464 | 5.5 | 72.8 | 131 | 5.4 | 38 | 2.8 | 13 | 4.8 | 15 | 6.8 | 267 | 6.5 |
| 50 to 59 | 17,064 | 315 | 3.8 | 76.6 | 95 | 3.9 | 26 | 1.9 | 4 | 1.5 | 13 | 5.9 | 177 | 4.3 |
| 60 to 69 | 16,764 | 262 | 3.1 | 79.7 | 77 | 3.2 | 30 | 2.2 | 9 | 3.3 | 7 | 3.2 | 139 | 3.4 |
| 70 to 79 | 17,429 | 236 | 2.8 | 82.5 | 65 | 2.7 | 21 | 1.6 | 14 | 5.2 | 6 | 2.7 | 130 | 3.2 |
| 80 to 89 | 14,077 | 167 | 2.0 | 84.5 | 56 | 2.3 | 6 | 0.4 | 5 | 1.8 | 5 | 2.3 | 95 | 2.3 |
| 90 to 99 | 12,520 | 133 | 1.6 | 86.1 | 32 | 1.3 | 10 | 0.7 | 7 | 2.6 | 8 | 3.6 | 76 | 1.9 |
| 100 to 109 | 11,682 | 112 | 1.3 | 87.4 | 35 | 1.4 | 6 | 0.4 | 3 | 1.1 | 3 | 1.4 | 65 | 1.6 |
| 110 to 119 | 10,639 | 93 | 1.1 | 88.5 | 25 | 1.0 | 6 | 0.4 | 7 | 2.6 | 5 | 2.3 | 50 | 1.2 |
| 120 to 129 | 10,787 | 87 | 1.0 | 89.5 | 18 | 0.7 | 5 | 0.4 | 4 | 1.5 | 4 | 1.8 | 56 | 1.4 |
| 130 to 139 | 10,063 | 75 | 0.9 | 90.4 | 17 | 0.7 | 7 | 0.5 | 2 | 0.7 | 3 | 1.4 | 46 | 1.1 |
| 140 to 149 | 7,635 | 53 | 0.6 | 91.0 | 17 | 0.7 | 4 | 0.3 | 3 | 1.1 | 0 | 29 | 0.7 | |
| 150 to 159 | 9,042 | 59 | 0.7 | 91.7 | 16 | 0.7 | 2 | 0.1 | 2 | 0.7 | 2 | 0.9 | 37 | 0.9 |
| 160 to 169 | 6,872 | 42 | 0.5 | 92.2 | 9 | 0.4 | 6 | 0.4 | 2 | 0.7 | 1 | 0.5 | 24 | 0.6 |
| 170 to 179 | 8,705 | 50 | 0.6 | 92.8 | 11 | 0.5 | 4 | 0.3 | 3 | 1.1 | 3 | 1.4 | 29 | 0.7 |
| 180 to 189 | 7,184 | 39 | 0.5 | 93.3 | 8 | 0.3 | 5 | 0.4 | 3 | 1.1 | 0 | 23 | 0.6 | |
| 190 to 199 | 7,168 | 37 | 0.4 | 93.7 | 7 | 0.3 | 3 | 0.2 | 0 | 1 | 0.5 | 26 | 0.6 | |
| 200 to 299 | 52,045 | 216 | 2.6 | 96.3 | 49 | 2.0 | 8 | 0.6 | 8 | 3.0 | 3 | 1.4 | 148 | 3.6 |
| 300 to 399 | 38,313 | 111 | 1.3 | 97.6 | 27 | 1.1 | 5 | 0.4 | 2 | 0.7 | 1 | 0.5 | 76 | 1.9 |
| 400 to 499 | 28,685 | 65 | 0.9 | 98.5 | 12 | 0.5 | 2 | 0.1 | 1 | 0.4 | 1 | 0.5 | 49 | 1.2 |
| 500 to 599 | 15,145 | 28 | 0.3 | 98.8 | 10 | 0.4 | 2 | 0.1 | 2 | 0.7 | 0 | 14 | 0.3 | |
| 600 to 799 | 27,219 | 40 | 0.5 | 99.3 | 7 | 0.3 | 3 | 0.2 | 0 | 1 | 0.5 | 29 | 0.7 | |
| 800 to 999 | 18,630 | 21 | 0.3 | 99.6 | 4 | 0.2 | 0 | 2 | 0.7 | 2 | 0.9 | 13 | 0.3 | |
| 1,000 to 1,999 | 42,774 | 33 | 0.4 | 100.0 | 3 | 0.1 | 0 | 1 | 0.4 | 2 | 0.9 | 27 | 0.7 | |
| 2,000 to 2,999 | 7,075 | 3 | 0.0 | 100.0 | 0 | 0 | 1 | 0.4 | 0 | 2 | 0.0 | |||
| 3,000 to 9,999 | 17,644 | 3 | 0.0 | 100.0 | 0 | 0 | 0 | 0 | 3 | 0.1 | ||||
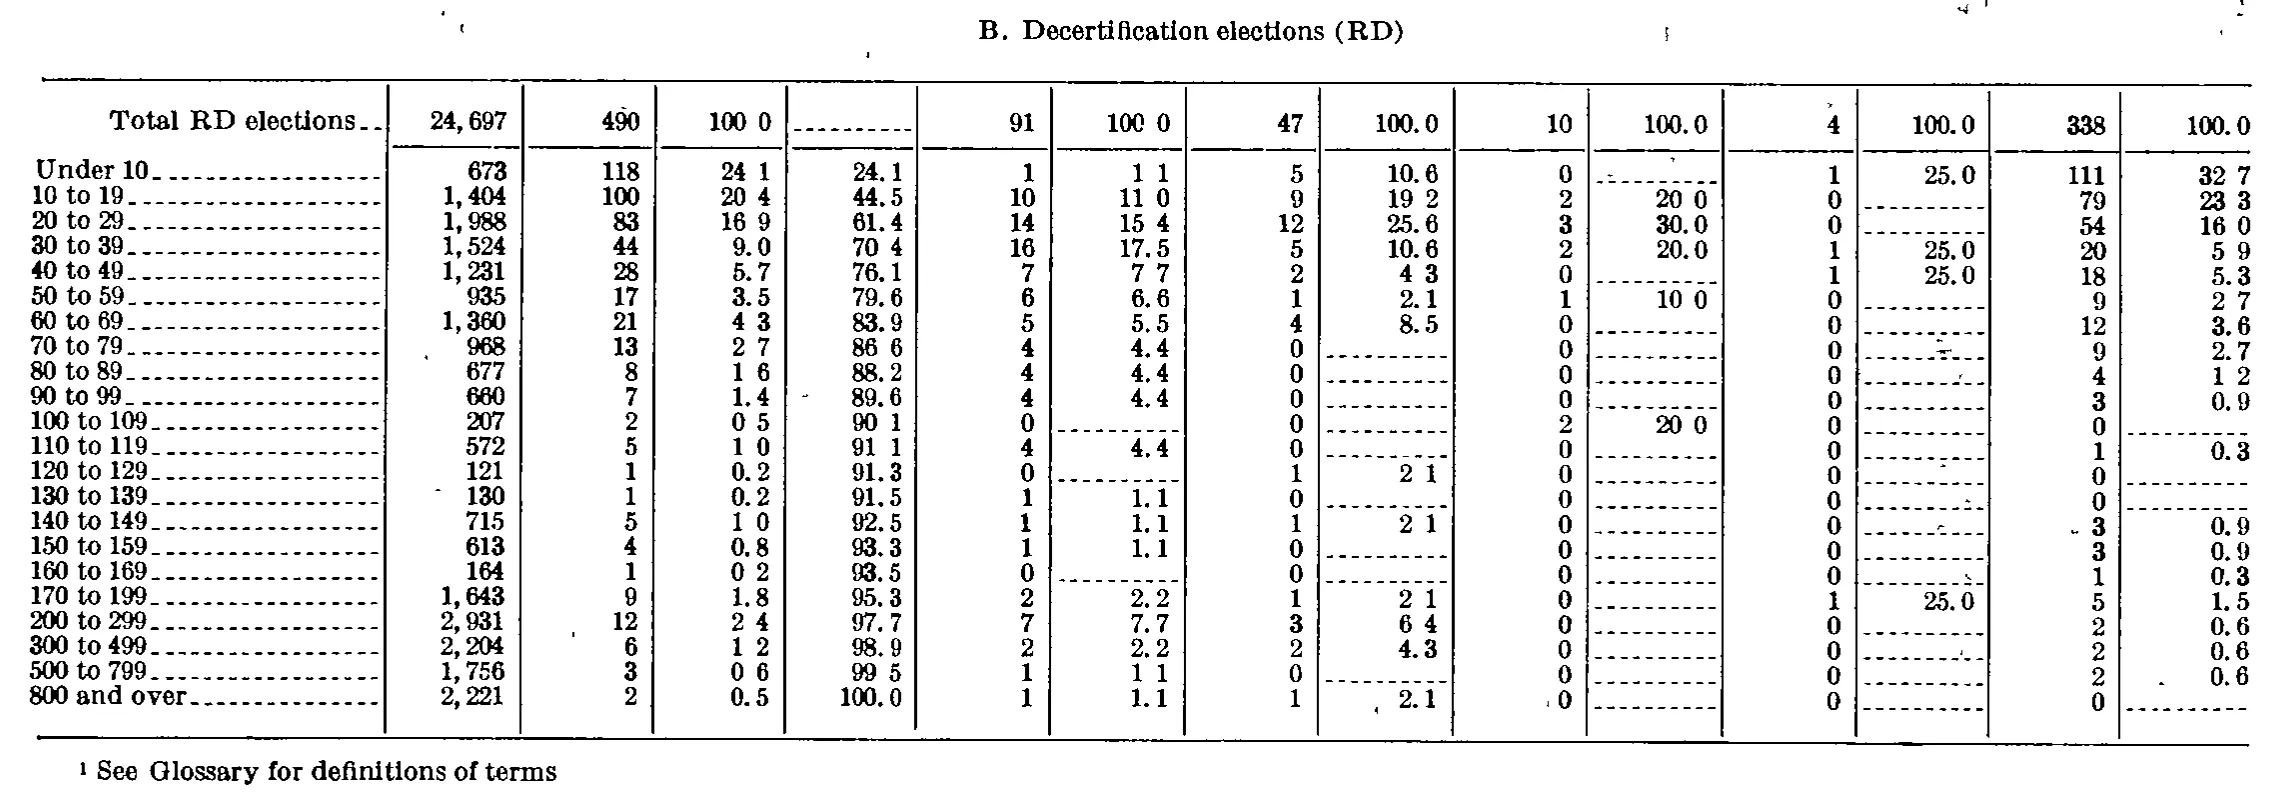
| B. Decertification elections (RD) | ||||||||||||||
| Total RD elections | 24,697 | 490 | 100.0 | 91 | 100.0 | 47 | 100.0 | 10 | 100.0 | 4 | 100.0 | 338 | 100.0 | |
| Under 10 | 673 | 118 | 24.1 | 24.1 | 1 | 1.1 | 5 | 10.6 | 0 | 1 | 25.0 | 111 | 32.7 | |
| 10 to 19 | 1,404 | 100 | 20.4 | 44.5 | 10 | 11.0 | 9 | 19.2 | 2 | 20.0 | 0 | 79 | 23.3 | |
| 20 to 29 | 1,988 | 83 | 16.9 | 61.4 | 14 | 15.4 | 12 | 25.6 | 3 | 30.0 | 0 | 54 | 16.0 | |
| 30 to 39 | 1,524 | 44 | 9.0 | 70.4 | 16 | 17.5 | 5 | 10.6 | 2 | 20.0 | 1 | 25.0 | 20 | 5.9 |
| 40 to 49 | 1,231 | 28 | 5.7 | 76.1 | 7 | 7.7 | 2 | 4.3 | 0 | 1 | 25.0 | 18 | 5.3 | |
| 50 to 59 | 935 | 17 | 3.5 | 79.6 | 6 | 6.6 | 1 | 2.1 | 1 | 10.0 | 0 | 9 | 2.7 | |
| 60 to 69 | 1,360 | 21 | 4.3 | 83.9 | 5 | 5.5 | 4 | 8.5 | 0 | 0 | 12 | 3.6 | ||
| 70 to 79 | 968 | 13 | 2.7 | 86.6 | 4 | 4.4 | 0 | 0 | 0 | 9 | 2.7 | |||
| 80 to 89 | 677 | 8 | 1.6 | 88.2 | 4 | 4.4 | 0 | 0 | 0 | 4 | 1.2 | |||
| 90 to 99 | 660 | 7 | 1.4 | 89.6 | 4 | 4.4 | 0 | 0 | 0 | 3 | 0.9 | |||
| 100 to 109 | 207 | 2 | 0.5 | 90.1 | 0 | 0 | 2 | 20.0 | 0 | 0 | ||||
| 110 to 119 | 572 | 5 | 1.0 | 91.1 | 4 | 4.4 | 0 | 0 | 0 | 1 | 0.3 | |||
| 120 to 129 | 121 | 1 | 0.2 | 91.3 | 0 | 1 | 2.1 | 0 | 0 | 0 | ||||
| 130 to 139 | 130 | 1 | 0.2 | 91.5 | 1 | 1.1 | 0 | 0 | 0 | 0 | ||||
| 140 to 149 | 715 | 5 | 1.0 | 92.5 | 1 | 1.1 | 1 | 2.1 | 0 | 0 | 3 | 0.9 | ||
| 150 to 159 | 613 | 4 | 0.8 | 93.3 | 1 | 1.1 | 0 | 0 | 0 | 3 | 0.9 | |||
| 160 to 169 | 164 | 1 | 0.2 | 93.5 | 0 | 0 | 0 | 0 | 1 | 0.3 | ||||
| 170 to 199 | 1,643 | 9 | 1.8 | 95.3 | 2 | 2.2 | 1 | 2.1 | 0 | 1 | 25.0 | 5 | 1.5 | |
| 200 to 299 | 2,931 | 12 | 2.4 | 97.7 | 7 | 7.7 | 3 | 6.4 | 0 | 0 | 2 | 0.6 | ||
| 300 to 499 | 2,204 | 6 | 1.2 | 98.9 | 2 | 2.2 | 2 | 4.3 | 0 | 0 | 2 | 0.6 | ||
| 500 to 799 | 1,756 | 3 | 0.6 | 99.5 | 1 | 1.1 | 0 | 0 | 0 | 2 | 0.6 | |||
| 800 and over | 2,221 | 2 | 0.5 | 100.0 | 1 | 1.1 | 1 | 2.1 | 0 | 0 | 0 | |||
- 1 See Glossary for definitions of terms.
306 of 306 figures sit in a row or column sum that works out.
Reader’s notes
p. 249. 15 columns: stub, 4 whole-table columns, four two-column union blocks under "Elections in which representation rights were won by", and a final two-column block for "Elections in which no representative was chosen". Decimal points: in this scan many decimal points in the percent and cumulative-percent columns failed to print, leaving a gap (e.g. "25 2", "100 0", "26 5", "16 3"). Every such column holds one-decimal percentages, so these are transcribed with the decimal point restored. No digits were altered. "100 to 109", Number eligible to vote: the hundreds digit is broken/smudged on the page and reads ambiguously (0 or 6). The column sums to the printed total 519,634 only with 11,682, so that is what is entered. This is the one cell whose glyph I could not read directly. Section line: the panel head prints as "A" followed by a wide gap and "Certification Elections (RC and RM)"; the period after "A" did not ink. Transcribed as "A. Certification Elections (RC and RM)". Stray marks: the "40 to 49" and "180 to 189" cells in "Percent of total" each carry a comma-like speck after the final digit ("5 5," and "0.5,"); treated as scanning dirt, not punctuation. Cross-checks all pass as printed: every data row's five outcome Number cells sum to its Total elections, every Number column sums to its printed total, and the Total elections column sums to 8,368. No arithmetic discrepancy found. Crop coverage: this image shows only panel A (Certification Elections, RC and RM) and ends at "3,000 to 9,999"; any further size classes, the panel B section (decertification/deauthorization elections) and the text of footnote 1 — whose marker appears on the caption — are below the crop and not transcribed here.
p. 250. The crop is a continuation page: no column headings are printed on it, so header_rows is empty. The grid has 15 columns (stub + 14): a size-of-unit column, then number of elections / percent / cumulative percent, then six paired number-and-percent columns whose element counts are 91, 47, 10, 4 and 338. "B. Decertification elections (RD)" is printed centred above the table's top rule, as a part heading for this section of the table; it is transcribed as a label-only row because it is a section line within the table and not the table caption. The scan loses many faint decimal points, so cells print as e.g. "100 0", "24 1", "19 2", "32 7". These are transcribed with the decimal point restored; no digits were changed. Column rules and the arithmetic confirm the column assignments: the five element columns sum to 490 (91+47+10+4+338), each percent column sums to 100.0, the size column sums to 24,697, and the cumulative column is the running sum of the rounded percent column (which also confirms 0.5 in the percent column for "100 to 109" and for "800 and over", where the unrounded values are 0.41). Doubtful cells: "30 to 39", percent column of the 91-element group, read as 17.5 although 16/91 = 17.58 would round to 17.6 — read as printed, and the column then sums to exactly 100.0. Likewise "Under 10" and "10 to 19" in the last (338-element) percent column read 32.7 and 23.3 although 111/338 and 79/338 round to 32.8 and 23.4; as read, that column sums to exactly 100.0. Cells printed as a dash rule are transcribed as empty.
Source image
Source data: U.S. NLRB Annual Reports (public domain). Reconstruction by NLRB Stats Archive. Read by claude-opus-5 (effort max, prompt extract_v1) from the 300-dpi scan; stitched by page. Updated October 2026.