NLRB Stats Archive › Annual Reports › FY1974 › Standard Federal Administrative Regional Distribution of Representation Elections Held in Cases Closed, Fiscal Year 1974
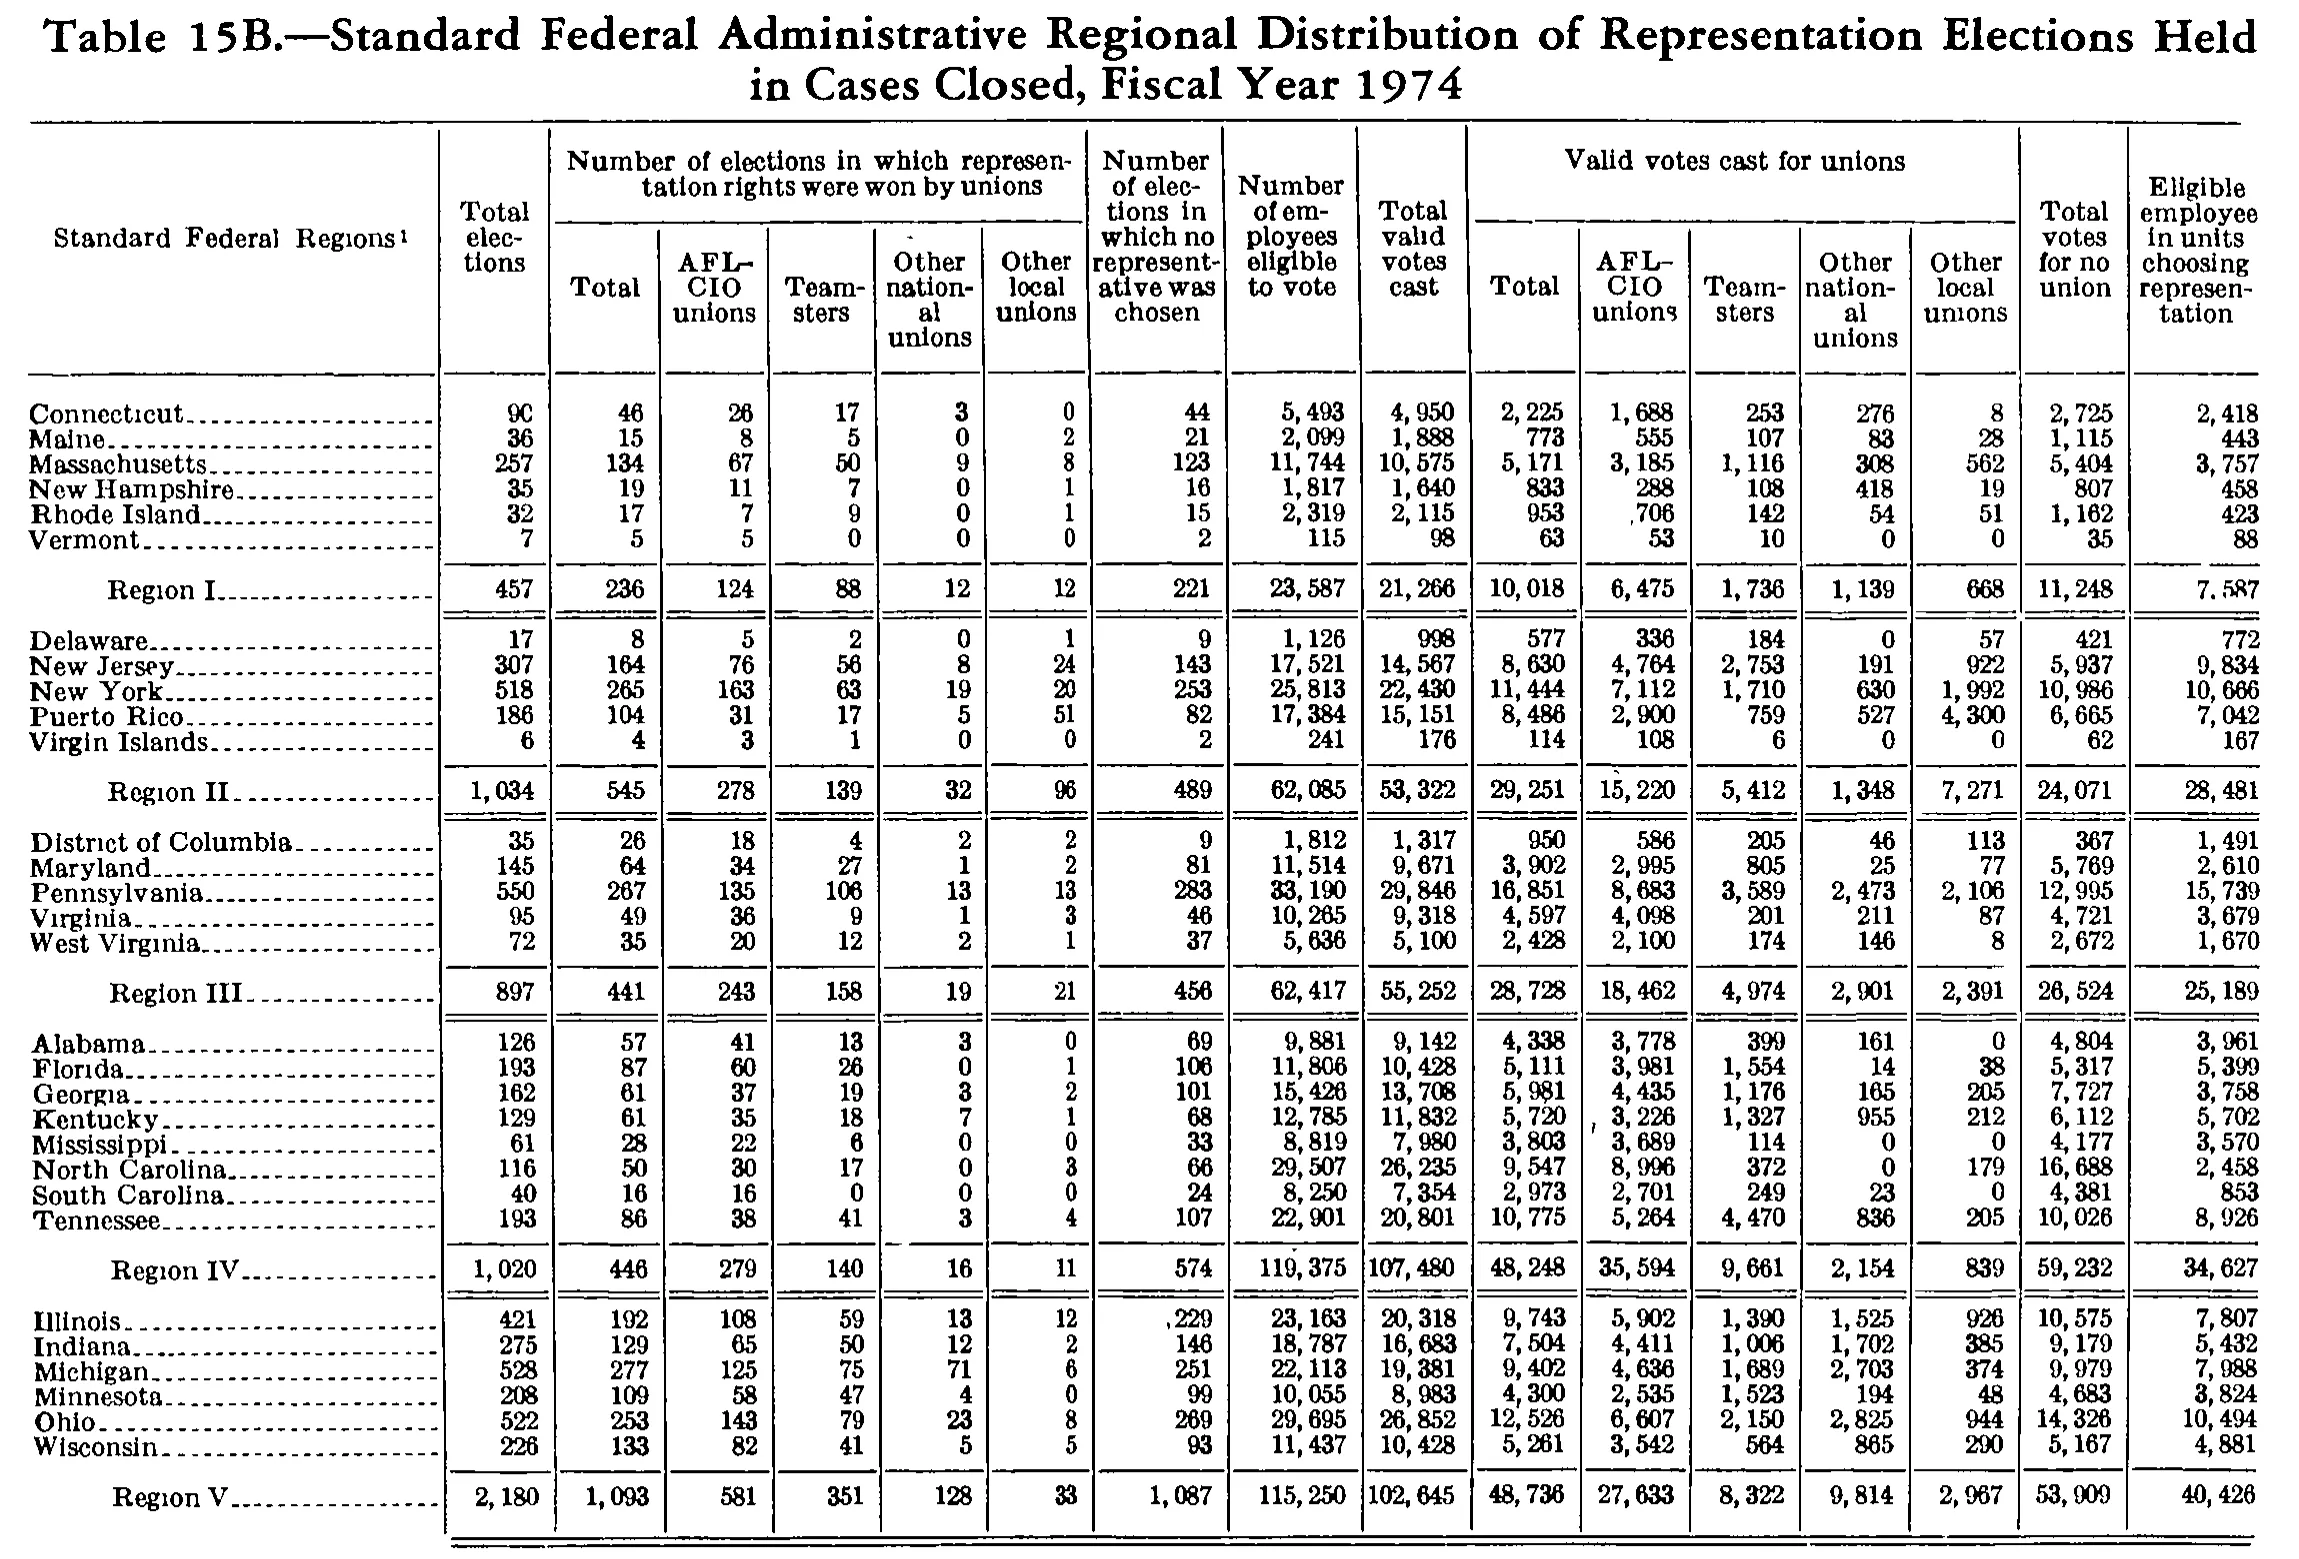
Standard Federal Administrative Regional Distribution of Representation Elections Held in Cases Closed, Fiscal Year 1974
Stitched from pp. 245–246.
| Standard Federal Regions | Total elections | Number of elections in which representation rights were won by unions | Number of elections in which no representative was chosen | Number of employees eligible to vote | Total valid votes cast | Valid votes cast for unions | Total votes for no union | Eligible employee in units choosing representation | ||||||||
|---|---|---|---|---|---|---|---|---|---|---|---|---|---|---|---|---|
| Standard Federal Regions | Total elections | Total | AFL-CIO unions | Teamsters | Other national unions | Other local unions | Number of elections in which no representative was chosen | Number of employees eligible to vote | Total valid votes cast | Total | AFL-CIO unions | Teamsters | Other national unions | Other local unions | Total votes for no union | Eligible employee in units choosing representation |
| Connecticut | 90 | 46 | 26 | 17 | 3 | 0 | 44 | 5,493 | 4,950 | 2,225 | 1,688 | 253 | 276 | 8 | 2,725 | 2,418 |
| Maine | 36 | 15 | 8 | 5 | 0 | 2 | 21 | 2,099 | 1,888 | 773 | 555 | 107 | 83 | 28 | 1,115 | 443 |
| Massachusetts | 257 | 134 | 67 | 50 | 9 | 8 | 123 | 11,744 | 10,575 | 5,171 | 3,185 | 1,116 | 308 | 562 | 5,404 | 3,757 |
| New Hampshire | 35 | 19 | 11 | 7 | 0 | 1 | 16 | 1,817 | 1,640 | 833 | 288 | 108 | 418 | 19 | 807 | 458 |
| Rhode Island | 32 | 17 | 7 | 9 | 0 | 1 | 15 | 2,319 | 2,115 | 953 | 706 | 142 | 54 | 51 | 1,162 | 423 |
| Vermont | 7 | 5 | 5 | 0 | 0 | 0 | 2 | 115 | 98 | 63 | 53 | 10 | 0 | 0 | 35 | 88 |
| Region I | 457 | 236 | 124 | 88 | 12 | 12 | 221 | 23,587 | 21,266 | 10,018 | 6,475 | 1,736 | 1,139 | 668 | 11,248 | 7,587 |
| Delaware | 17 | 8 | 5 | 2 | 0 | 1 | 9 | 1,126 | 998 | 577 | 336 | 184 | 0 | 57 | 421 | 772 |
| New Jersey | 307 | 164 | 76 | 56 | 8 | 24 | 143 | 17,521 | 14,567 | 8,630 | 4,764 | 2,753 | 191 | 922 | 5,937 | 9,834 |
| New York | 518 | 265 | 163 | 63 | 19 | 20 | 253 | 25,813 | 22,430 | 11,444 | 7,112 | 1,710 | 630 | 1,992 | 10,986 | 10,666 |
| Puerto Rico | 186 | 104 | 31 | 17 | 5 | 51 | 82 | 17,384 | 15,151 | 8,486 | 2,900 | 759 | 527 | 4,300 | 6,665 | 7,042 |
| Virgin Islands | 6 | 4 | 3 | 1 | 0 | 0 | 2 | 241 | 176 | 114 | 108 | 6 | 0 | 0 | 62 | 167 |
| Region II | 1,034 | 545 | 278 | 139 | 32 | 96 | 489 | 62,085 | 53,322 | 29,251 | 15,220 | 5,412 | 1,348 | 7,271 | 24,071 | 28,481 |
| District of Columbia | 35 | 26 | 18 | 4 | 2 | 2 | 9 | 1,812 | 1,317 | 950 | 586 | 205 | 46 | 113 | 367 | 1,491 |
| Maryland | 145 | 64 | 34 | 27 | 1 | 2 | 81 | 11,514 | 9,671 | 3,902 | 2,995 | 805 | 25 | 77 | 5,769 | 2,610 |
| Pennsylvania | 550 | 267 | 135 | 106 | 13 | 13 | 283 | 33,190 | 29,846 | 16,851 | 8,683 | 3,589 | 2,473 | 2,106 | 12,995 | 15,739 |
| Virginia | 95 | 49 | 36 | 9 | 1 | 3 | 46 | 10,265 | 9,318 | 4,597 | 4,098 | 201 | 211 | 87 | 4,721 | 3,679 |
| West Virginia | 72 | 35 | 20 | 12 | 2 | 1 | 37 | 5,636 | 5,100 | 2,428 | 2,100 | 174 | 146 | 8 | 2,672 | 1,670 |
| Region III | 897 | 441 | 243 | 158 | 19 | 21 | 456 | 62,417 | 55,252 | 28,728 | 18,462 | 4,974 | 2,901 | 2,391 | 26,524 | 25,189 |
| Alabama | 126 | 57 | 41 | 13 | 3 | 0 | 69 | 9,881 | 9,142 | 4,338 | 3,778 | 399 | 161 | 0 | 4,804 | 3,961 |
| Florida | 193 | 87 | 60 | 26 | 0 | 1 | 106 | 11,806 | 10,428 | 5,111 | 3,981 | 1,554 | 14 | 38 | 5,317 | 5,399 |
| Georgia | 162 | 61 | 37 | 19 | 3 | 2 | 101 | 15,426 | 13,708 | 5,981 | 4,435 | 1,176 | 165 | 205 | 7,727 | 3,758 |
| Kentucky | 129 | 61 | 35 | 18 | 7 | 1 | 68 | 12,785 | 11,832 | 5,720 | 3,226 | 1,327 | 955 | 212 | 6,112 | 5,702 |
| Mississippi | 61 | 28 | 22 | 6 | 0 | 0 | 33 | 8,819 | 7,980 | 3,803 | 3,689 | 114 | 0 | 0 | 4,177 | 3,570 |
| North Carolina | 116 | 50 | 30 | 17 | 0 | 3 | 66 | 29,507 | 26,235 | 9,547 | 8,996 | 372 | 0 | 179 | 16,688 | 2,458 |
| South Carolina | 40 | 16 | 16 | 0 | 0 | 0 | 24 | 8,250 | 7,354 | 2,973 | 2,701 | 249 | 23 | 0 | 4,381 | 853 |
| Tennessee | 193 | 86 | 38 | 41 | 3 | 4 | 107 | 22,901 | 20,801 | 10,775 | 5,264 | 4,470 | 836 | 205 | 10,026 | 8,926 |
| Region IV | 1,020 | 446 | 279 | 140 | 16 | 11 | 574 | 119,375 | 107,480 | 48,248 | 35,594 | 9,661 | 2,154 | 839 | 59,232 | 34,627 |
| Illinois | 421 | 192 | 108 | 59 | 13 | 12 | 229 | 23,163 | 20,318 | 9,743 | 5,902 | 1,390 | 1,525 | 926 | 10,575 | 7,807 |
| Indiana | 275 | 129 | 65 | 50 | 12 | 2 | 146 | 18,787 | 16,683 | 7,504 | 4,411 | 1,006 | 1,702 | 385 | 9,179 | 5,432 |
| Michigan | 528 | 277 | 125 | 75 | 71 | 6 | 251 | 22,113 | 19,381 | 9,402 | 4,636 | 1,689 | 2,703 | 374 | 9,979 | 7,988 |
| Minnesota | 208 | 109 | 58 | 47 | 4 | 0 | 99 | 10,055 | 8,983 | 4,300 | 2,555 | 1,523 | 194 | 48 | 4,683 | 3,824 |
| Ohio | 522 | 253 | 143 | 79 | 23 | 8 | 269 | 29,695 | 26,852 | 12,526 | 6,607 | 2,150 | 2,825 | 944 | 14,326 | 10,494 |
| Wisconsin | 226 | 133 | 82 | 41 | 5 | 5 | 93 | 11,437 | 10,428 | 5,261 | 3,542 | 564 | 865 | 290 | 5,167 | 4,881 |
| Region V | 2,180 | 1,093 | 581 | 351 | 128 | 33 | 1,087 | 115,250 | 102,645 | 48,736 | 27,633 | 8,322 | 9,814 | 2,967 | 53,909 | 40,426 |
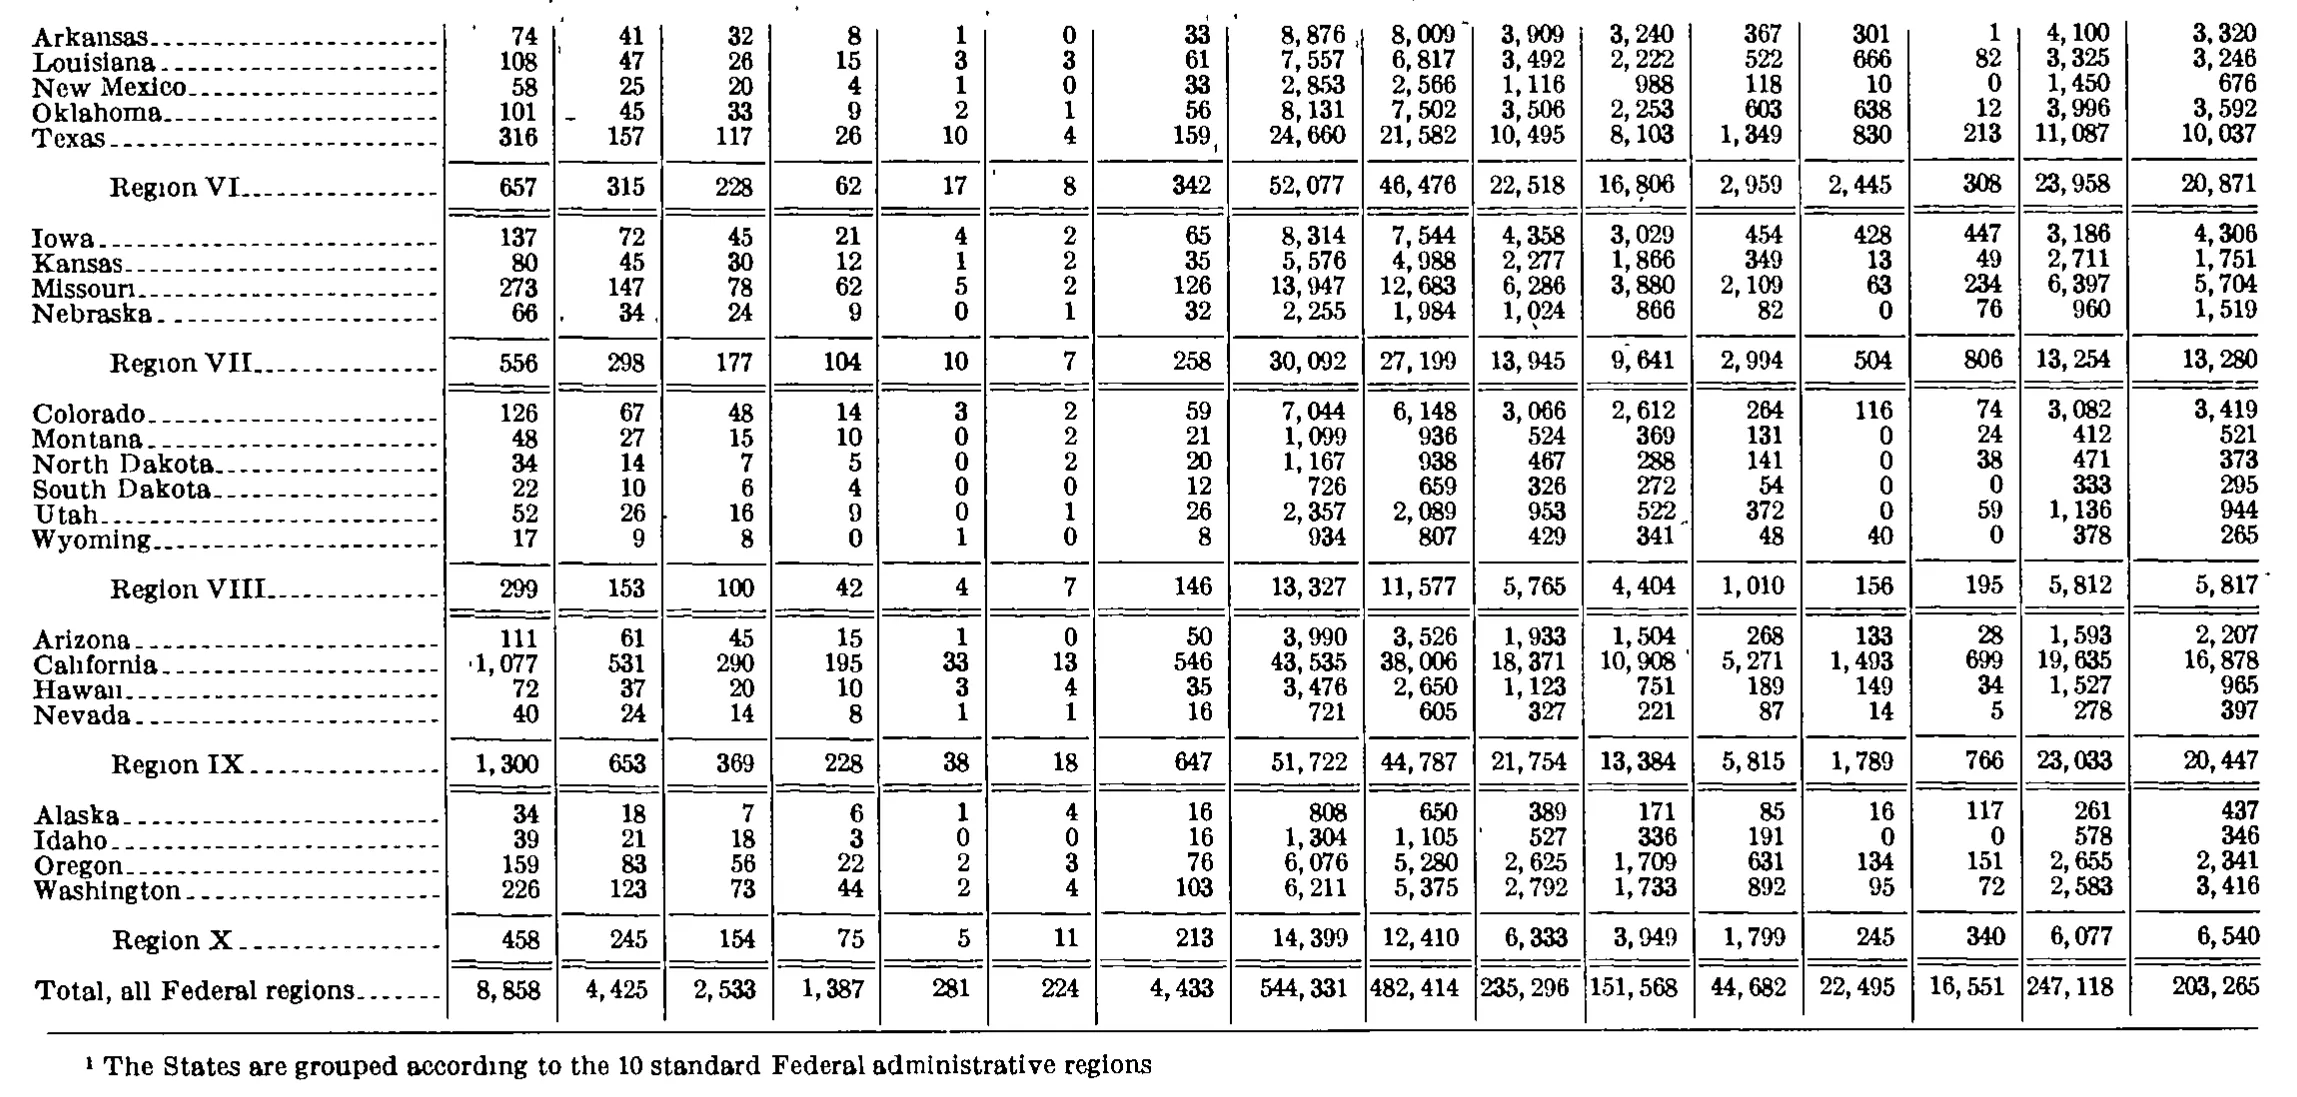
| Arkansas | 74 | 41 | 32 | 8 | 1 | 0 | 33 | 8,876 | 8,009 | 3,909 | 3,240 | 367 | 301 | 1 | 4,100 | 3,320 |
| Louisiana | 108 | 47 | 26 | 15 | 3 | 3 | 61 | 7,557 | 6,817 | 3,492 | 2,222 | 522 | 666 | 82 | 3,325 | 3,246 |
| New Mexico | 58 | 25 | 20 | 4 | 1 | 0 | 33 | 2,853 | 2,566 | 1,116 | 988 | 118 | 10 | 0 | 1,450 | 676 |
| Oklahoma | 101 | 45 | 33 | 9 | 2 | 1 | 56 | 8,131 | 7,502 | 3,506 | 2,253 | 603 | 638 | 12 | 3,996 | 3,592 |
| Texas | 316 | 157 | 117 | 26 | 10 | 4 | 159 | 24,660 | 21,582 | 10,495 | 8,103 | 1,349 | 830 | 213 | 11,087 | 10,037 |
| Region VI | 657 | 315 | 228 | 62 | 17 | 8 | 342 | 52,077 | 46,476 | 22,518 | 16,806 | 2,959 | 2,445 | 308 | 23,958 | 20,871 |
| Iowa | 137 | 72 | 45 | 21 | 4 | 2 | 65 | 8,314 | 7,544 | 4,358 | 3,029 | 454 | 428 | 447 | 3,186 | 4,306 |
| Kansas | 80 | 45 | 30 | 12 | 1 | 2 | 35 | 5,576 | 4,988 | 2,277 | 1,866 | 349 | 13 | 49 | 2,711 | 1,751 |
| Missouri | 273 | 147 | 78 | 62 | 5 | 2 | 126 | 13,947 | 12,683 | 6,286 | 3,880 | 2,109 | 63 | 234 | 6,397 | 5,704 |
| Nebraska | 66 | 34 | 24 | 9 | 0 | 1 | 32 | 2,255 | 1,984 | 1,024 | 866 | 82 | 0 | 76 | 960 | 1,519 |
| Region VII | 556 | 298 | 177 | 104 | 10 | 7 | 258 | 30,092 | 27,199 | 13,945 | 9,641 | 2,994 | 504 | 806 | 13,254 | 13,280 |
| Colorado | 126 | 67 | 48 | 14 | 3 | 2 | 59 | 7,044 | 6,148 | 3,066 | 2,612 | 264 | 116 | 74 | 3,082 | 3,419 |
| Montana | 48 | 27 | 15 | 10 | 0 | 2 | 21 | 1,099 | 936 | 524 | 369 | 131 | 0 | 24 | 412 | 521 |
| North Dakota | 34 | 14 | 7 | 5 | 0 | 2 | 20 | 1,167 | 938 | 467 | 288 | 141 | 0 | 38 | 471 | 373 |
| South Dakota | 22 | 10 | 6 | 4 | 0 | 0 | 12 | 726 | 659 | 326 | 272 | 54 | 0 | 0 | 333 | 295 |
| Utah | 52 | 26 | 16 | 9 | 0 | 1 | 26 | 2,357 | 2,089 | 953 | 522 | 372 | 0 | 59 | 1,136 | 944 |
| Wyoming | 17 | 9 | 8 | 0 | 1 | 0 | 8 | 934 | 807 | 429 | 341 | 48 | 40 | 0 | 378 | 265 |
| Region VIII | 299 | 153 | 100 | 42 | 4 | 7 | 146 | 13,327 | 11,577 | 5,765 | 4,404 | 1,010 | 156 | 195 | 5,812 | 5,817 |
| Arizona | 111 | 61 | 45 | 15 | 1 | 0 | 50 | 3,990 | 3,526 | 1,933 | 1,504 | 268 | 133 | 28 | 1,593 | 2,207 |
| California | 1,077 | 531 | 290 | 195 | 33 | 13 | 546 | 43,535 | 38,006 | 18,371 | 10,908 | 5,271 | 1,493 | 699 | 19,635 | 16,878 |
| Hawaii | 72 | 37 | 20 | 10 | 3 | 4 | 35 | 3,476 | 2,650 | 1,123 | 751 | 189 | 149 | 34 | 1,527 | 965 |
| Nevada | 40 | 24 | 14 | 8 | 1 | 1 | 16 | 721 | 605 | 327 | 221 | 87 | 14 | 5 | 278 | 397 |
| Region IX | 1,300 | 653 | 369 | 228 | 38 | 18 | 647 | 51,722 | 44,787 | 21,754 | 13,384 | 5,815 | 1,789 | 766 | 23,033 | 20,447 |
| Alaska | 34 | 18 | 7 | 6 | 1 | 4 | 16 | 808 | 650 | 389 | 171 | 85 | 16 | 117 | 261 | 437 |
| Idaho | 39 | 21 | 18 | 3 | 0 | 0 | 16 | 1,304 | 1,105 | 527 | 336 | 191 | 0 | 0 | 578 | 346 |
| Oregon | 159 | 83 | 56 | 22 | 2 | 3 | 76 | 6,076 | 5,280 | 2,625 | 1,709 | 631 | 134 | 151 | 2,655 | 2,341 |
| Washington | 226 | 123 | 73 | 44 | 2 | 4 | 103 | 6,211 | 5,375 | 2,792 | 1,733 | 892 | 95 | 72 | 2,583 | 3,416 |
| Region X | 458 | 245 | 154 | 75 | 5 | 11 | 213 | 14,399 | 12,410 | 6,333 | 3,949 | 1,799 | 245 | 340 | 6,077 | 6,540 |
| Total, all Federal regions | 8,858 | 4,425 | 2,533 | 1,387 | 281 | 224 | 4,433 | 544,331 | 482,414 | 235,296 | 151,568 | 44,682 | 22,495 | 16,551 | 247,118 | 203,265 |
- 1 The States are grouped according to the 10 standard Federal administrative regions
969 of 972 figures sit in a row or column sum that works out. 6 cells break a sum: 'Florida', column 11: prints 5,111, columns 12 to 15 add to 5,587; 'Minnesota', column 11: prints 4,300, columns 12 to 15 add to 4,320; 'Idaho', column 2: prints 39, the subtotals in columns 3 to 8 add to 37; 'Region X', column 8: prints 213, rows 'Alaska' to 'Washington' add to 211; 'Region V', column 12: prints 27,633, rows 'Illinois' to 'Wisconsin' add to 27,653; 'Region IV', column 12: prints 35,594, rows 'Alabama' to 'Tennessee' add to 36,070.
Reader’s notes
p. 245. 17 columns. The stub heading carries a superscript 1, but no footnote text is printed on this crop; the footnote presumably appears at the end of the table on a later page, so `footnotes` is empty. Crop coverage: the table is cut off after the "Region V" total line — Regions VI through X and any grand total continue on the following page. Damaged/ambiguous glyphs restored (all confirmed by column arithmetic): - Connecticut / Total elections: the second digit is a broken zero that images as "9C"; transcribed 90 (Region I total 457 = 90+36+257+35+32+7). - Region I / Eligible employee in units choosing representation: the thousands separator images as a low dot ("7. 587") rather than a comma; transcribed 7,587, which is the column sum for Region I. - Illinois / Number of elections in which no representative was chosen: a stray comma-like mark precedes the figure (", 229"); transcribed 229 (Region V total 1,087 confirms). - Rhode Island / Valid votes cast for unions – AFL-CIO unions: a stray mark precedes the figure (",706"); transcribed 706 (row total 953 = 706+142+54+51 confirms). - Stray ink specks sit in the Kentucky and Mississippi rows just left of the "Valid votes cast for unions – AFL-CIO unions" figures; they are not footnote markers and were ignored. Two cells read clearly but fail arithmetic, and are transcribed as printed: - Florida / Valid votes cast for unions – AFL-CIO unions reads 3,981, but the row's union components then sum to 5,587 against a printed row total of 5,111, and the Region IV column sum comes to 36,070 against a printed 35,594. Both discrepancies are exactly 476, and every other Region IV row and column reconciles, so the printed 3,981 appears to be a misprint for 3,505. Not corrected. - Minnesota / Valid votes cast for unions – AFL-CIO unions reads 2,555, but the row's components then sum to 4,320 against a printed row total of 4,300, and the Region V column sum comes to 27,653 against a printed 27,633. Both discrepancies are exactly 20, suggesting a printed 2,555 for 2,535. The middle digit is the least legible character on the page (3 and 5 are easily confused at this scan quality), so this one may be my misreading rather than a misprint. Not corrected. Every other row and every other region subtotal reconciles exactly in all 16 numeric columns, including the identities total-valid-votes-cast = union votes + no-union votes, and union total = AFL-CIO + Teamsters + other national + other local. Georgia / Number of employees eligible to vote is 15,426 (the final digit is faint; the Region IV column total 119,375 confirms 426 rather than 428). Headings are printed with an en-dash in "AFL–CIO"; written here as "AFL-CIO".
p. 246. This crop is a continuation page: no column headings are printed on it, so header_rows is empty. The grid has 17 columns (stub + 16 numeric), counted from the vertical rules; the table continues the State listing from Region VI through Region X plus the grand total, so Regions I-V are on the preceding page. Suspected misprint: in column 7 the Region X subtotal is printed 213, but the four States above it (Alaska 16, Idaho 16, Oregon 76, Washington 103) sum to 211. Both Alaska and Idaho read clearly as 16 on two passes of the scan, and the same column's subtotals for Regions VI-IX all reconcile exactly, so this looks like an error in the printed source rather than a misreading; the values are transcribed as printed. Every other column in every region subtotal reconciles, as does the internal relation col2 = col3+col4+col5+col6 in all rows. California, column 1: a small ink speck sits immediately left of the figure ("·1,077"). It is a scan/printing artifact rather than a footnote marker or a digit, so the cell is transcribed as 1,077. Minor scanning specks also appear next to Louisiana col 1, Oklahoma col 2, Nebraska cols 1-3, Texas col 7, Arkansas col 8 and col 14, and Utah col 11; none of them alter the digits read. A thin fragment of a horizontal rule is clipped along the top edge of the crop.
Source image
Source data: U.S. NLRB Annual Reports (public domain). Reconstruction by NLRB Stats Archive. Read by claude-opus-5 (effort max, prompt extract_v1) from the 300-dpi scan; stitched by page. Updated October 2026.