NLRB Stats Archive › Annual Reports › FY1974 › Objections filed in representation cases closed
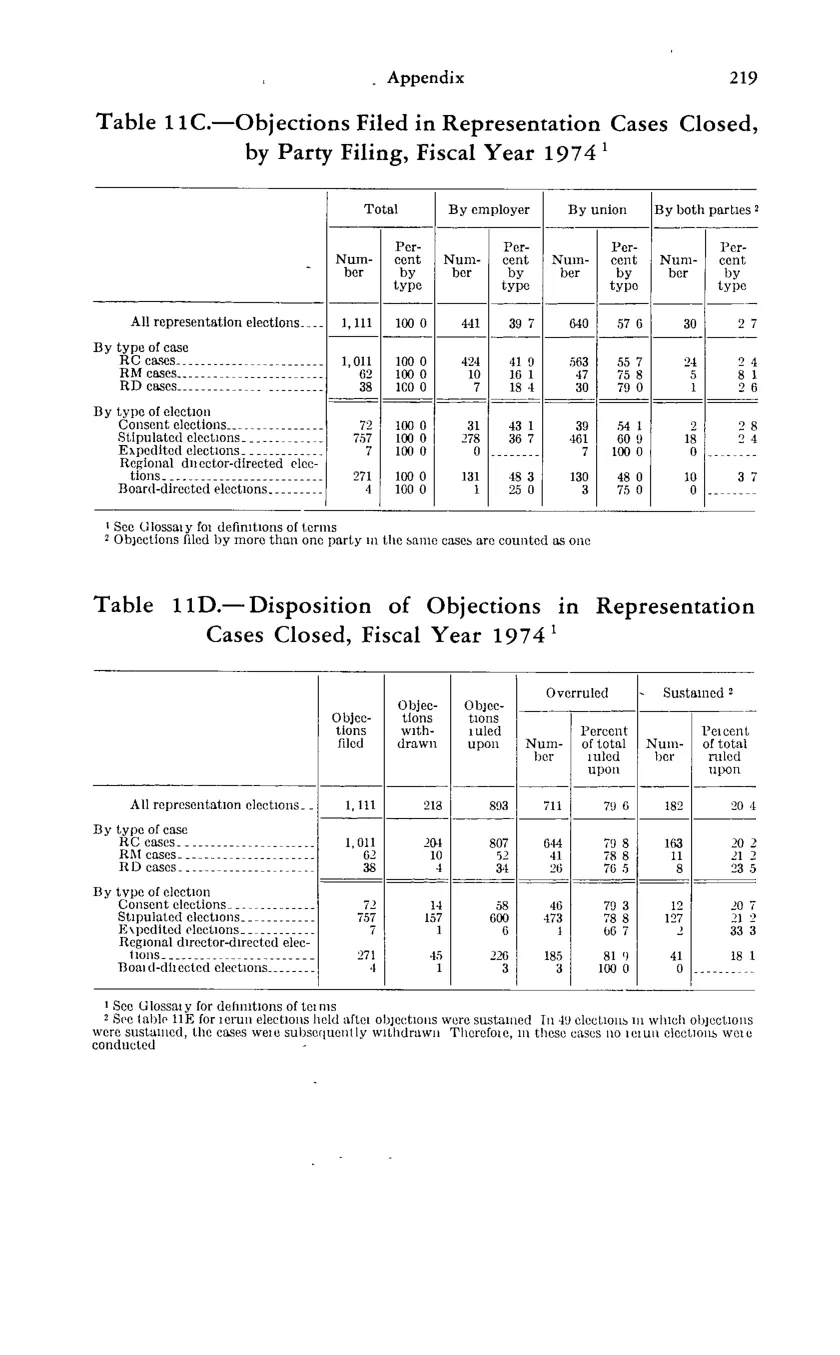
Objections filed in representation cases closed
| Total | Total | By employer | By employer | By union | By union | By both parties | By both parties | |
|---|---|---|---|---|---|---|---|---|
| Number | Percent by type | Number | Percent by type | Number | Percent by type | Number | Percent by type | |
| All representation elections | 1,111 | 100 0 | 441 | 39 7 | 640 | 57 6 | 30 | 2 7 |
| By type of case | ||||||||
| RC cases | 1,011 | 100 0 | 424 | 41 9 | 563 | 55 7 | 24 | 2 4 |
| RM cases | 62 | 100 0 | 10 | 16 1 | 47 | 75 8 | 5 | 8 1 |
| RD cases | 38 | 100 0 | 7 | 18 4 | 30 | 79 0 | 1 | 2 6 |
| By type of election | ||||||||
| Consent elections | 72 | 100 0 | 31 | 43 1 | 39 | 54 1 | 2 | 2 8 |
| Stipulated elections | 757 | 100 0 | 278 | 36 7 | 461 | 60 9 | 18 | 2 4 |
| Expedited elections | 7 | 100 0 | 0 | 7 | 100 0 | 0 | ||
| Regional director-directed elections | 271 | 100 0 | 131 | 48 3 | 130 | 48 0 | 10 | 3 7 |
| Board-directed elections | 4 | 100 0 | 1 | 25 0 | 3 | 75 0 | 0 |
Source image
Source data: U.S. NLRB Annual Reports (public domain). Reconstruction by NLRB Stats Archive. Updated June 2026.