NLRB Stats Archive › Annual Reports › FY1974 › Geographic Distribution of Cases Received, Fiscal Year 1974
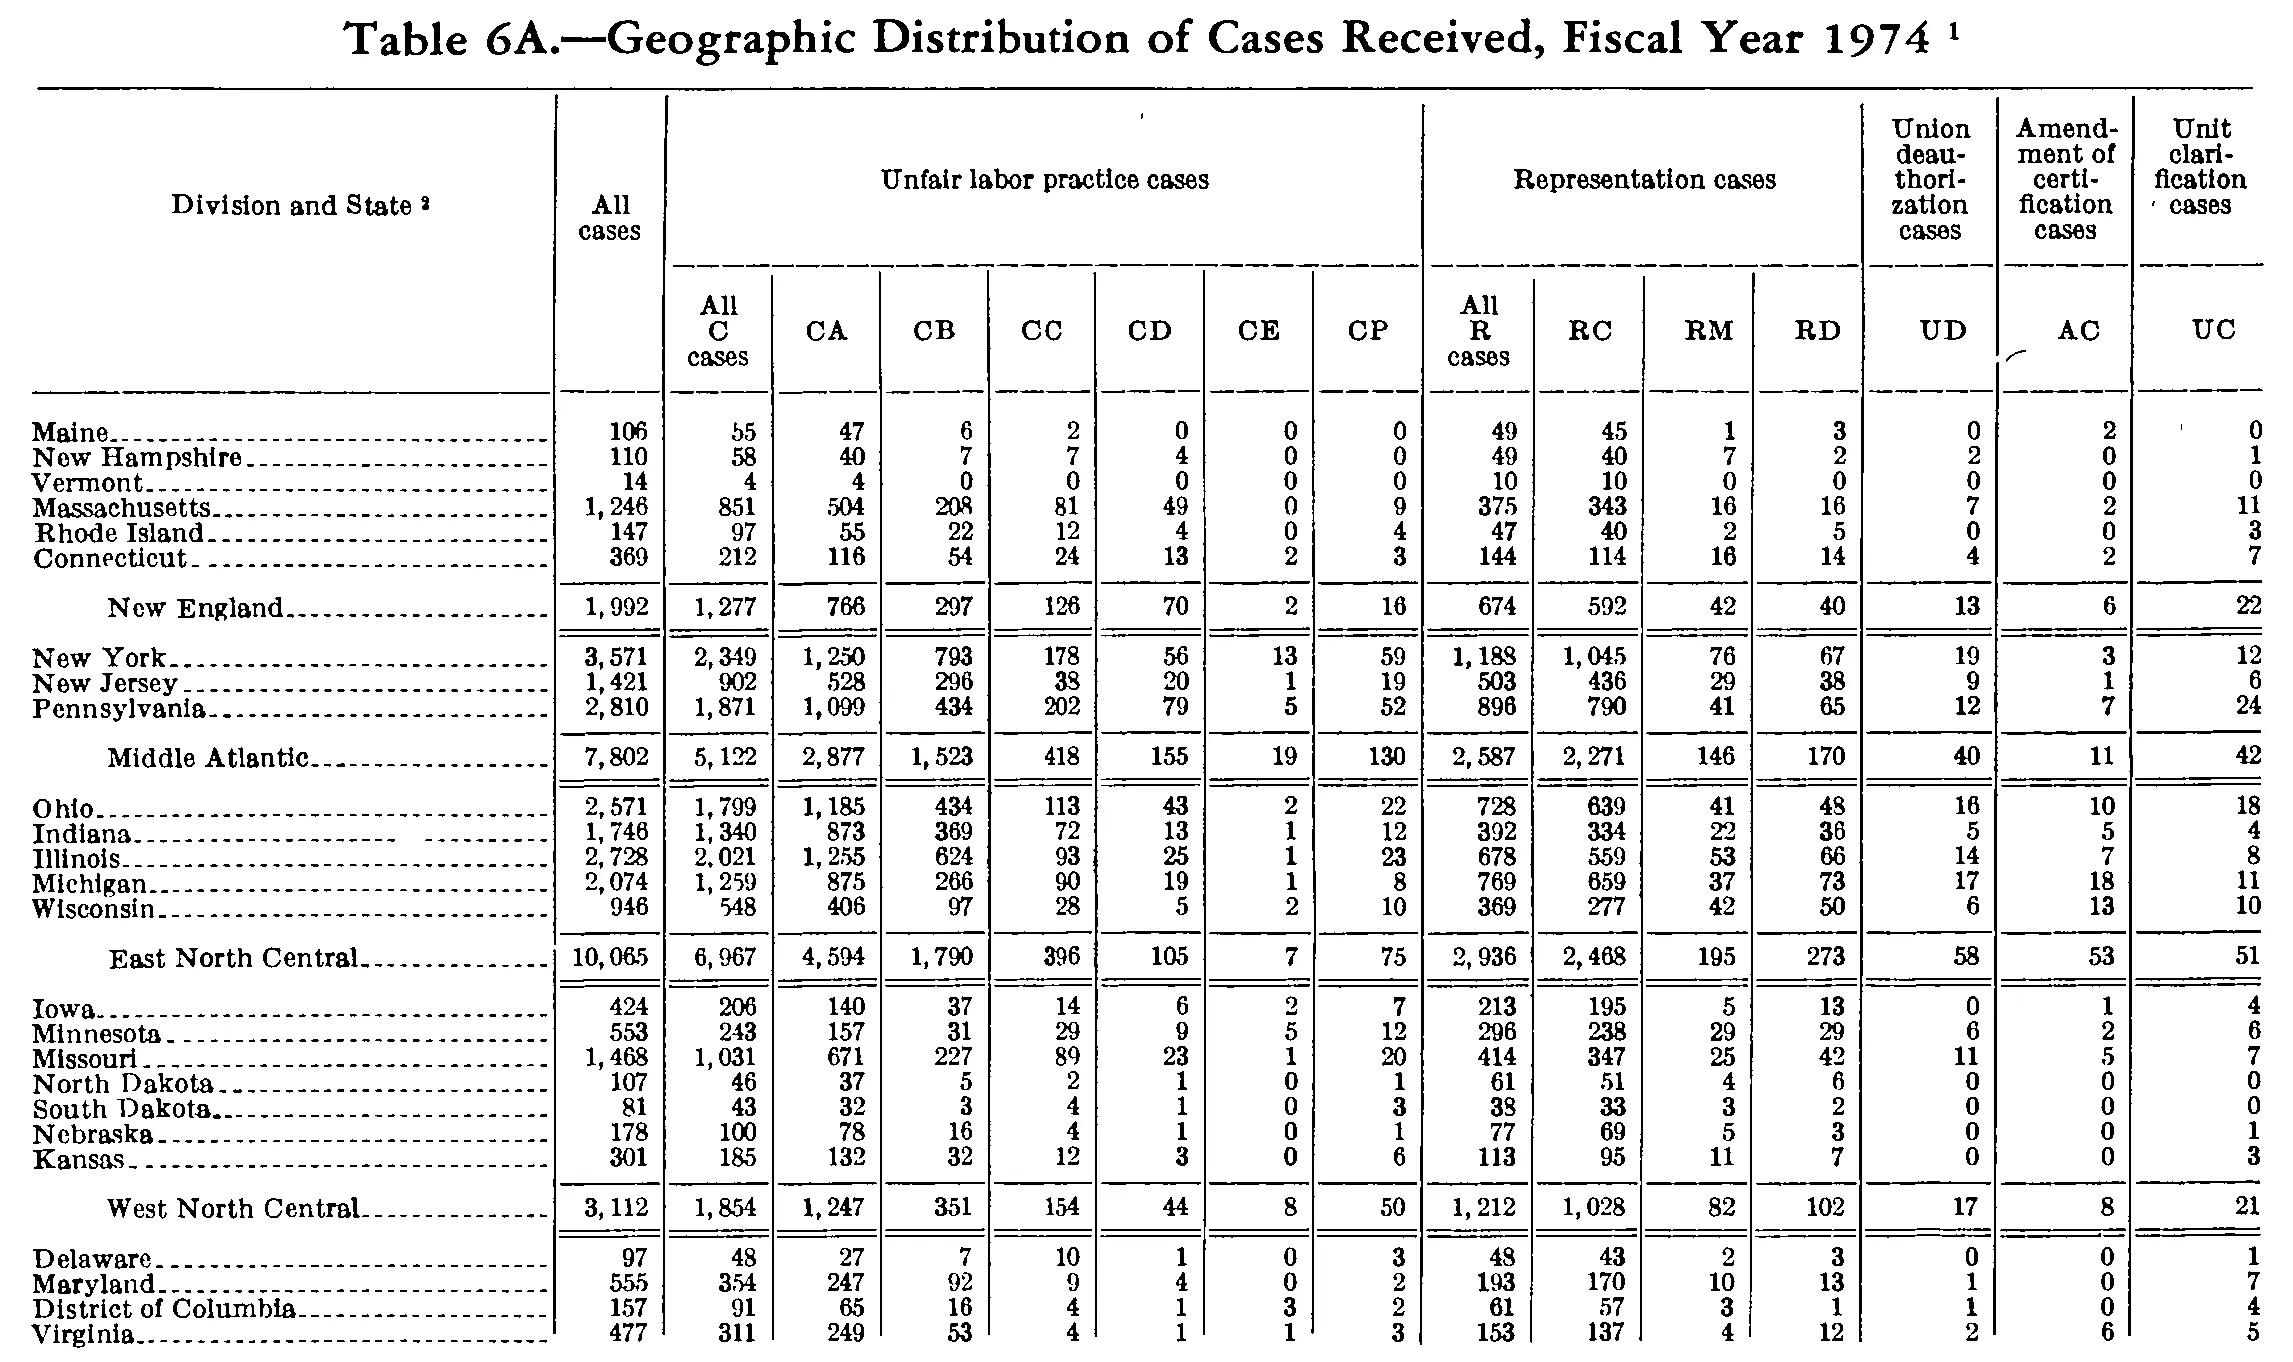
Geographic Distribution of Cases Received, Fiscal Year 1974
Stitched from pp. 219–220.
| Division and State | All cases | Unfair labor practice cases | Representation cases | Union deauthorization cases | Amendment of certification cases | Unit clarification cases | |||||||||
|---|---|---|---|---|---|---|---|---|---|---|---|---|---|---|---|
| Division and State | All cases | All C cases | CA | CB | CC | CD | CE | CP | All R cases | RC | RM | RD | UD | AC | UC |
| Maine | 106 | 55 | 47 | 6 | 2 | 0 | 0 | 0 | 49 | 45 | 1 | 3 | 0 | 2 | 0 |
| New Hampshire | 110 | 58 | 40 | 7 | 7 | 4 | 0 | 0 | 49 | 40 | 7 | 2 | 2 | 0 | 1 |
| Vermont | 14 | 4 | 4 | 0 | 0 | 0 | 0 | 0 | 10 | 10 | 0 | 0 | 0 | 0 | 0 |
| Massachusetts | 1,246 | 851 | 504 | 208 | 81 | 49 | 0 | 9 | 375 | 343 | 16 | 16 | 7 | 2 | 11 |
| Rhode Island | 147 | 97 | 55 | 22 | 12 | 4 | 0 | 4 | 47 | 40 | 2 | 5 | 0 | 0 | 3 |
| Connecticut | 369 | 212 | 116 | 54 | 24 | 13 | 2 | 3 | 144 | 114 | 16 | 14 | 4 | 2 | 7 |
| New England | 1,992 | 1,277 | 766 | 297 | 126 | 70 | 2 | 16 | 674 | 592 | 42 | 40 | 13 | 6 | 22 |
| New York | 3,571 | 2,349 | 1,250 | 793 | 178 | 56 | 13 | 59 | 1,188 | 1,045 | 76 | 67 | 19 | 3 | 12 |
| New Jersey | 1,421 | 902 | 528 | 296 | 38 | 20 | 1 | 19 | 503 | 436 | 29 | 38 | 9 | 1 | 6 |
| Pennsylvania | 2,810 | 1,871 | 1,099 | 434 | 202 | 79 | 5 | 52 | 896 | 790 | 41 | 65 | 12 | 7 | 24 |
| Middle Atlantic | 7,802 | 5,122 | 2,877 | 1,523 | 418 | 155 | 19 | 130 | 2,587 | 2,271 | 146 | 170 | 40 | 11 | 42 |
| Ohio | 2,571 | 1,799 | 1,185 | 434 | 113 | 43 | 2 | 22 | 728 | 639 | 41 | 48 | 16 | 10 | 18 |
| Indiana | 1,746 | 1,340 | 873 | 369 | 72 | 13 | 1 | 12 | 392 | 334 | 22 | 36 | 5 | 5 | 4 |
| Illinois | 2,728 | 2,021 | 1,255 | 624 | 93 | 25 | 1 | 23 | 678 | 559 | 53 | 66 | 14 | 7 | 8 |
| Michigan | 2,074 | 1,259 | 875 | 266 | 90 | 19 | 1 | 8 | 769 | 659 | 37 | 73 | 17 | 18 | 11 |
| Wisconsin | 946 | 548 | 406 | 97 | 28 | 5 | 2 | 10 | 369 | 277 | 42 | 50 | 6 | 13 | 10 |
| East North Central | 10,065 | 6,967 | 4,594 | 1,790 | 396 | 105 | 7 | 75 | 2,936 | 2,468 | 195 | 273 | 58 | 53 | 51 |
| Iowa | 424 | 206 | 140 | 37 | 14 | 6 | 2 | 7 | 213 | 195 | 5 | 13 | 0 | 1 | 4 |
| Minnesota | 553 | 243 | 157 | 31 | 29 | 9 | 5 | 12 | 296 | 238 | 29 | 29 | 6 | 2 | 6 |
| Missouri | 1,468 | 1,031 | 671 | 227 | 89 | 23 | 1 | 20 | 414 | 347 | 25 | 42 | 11 | 5 | 7 |
| North Dakota | 107 | 46 | 37 | 5 | 2 | 1 | 0 | 1 | 61 | 51 | 4 | 6 | 0 | 0 | 0 |
| South Dakota | 81 | 43 | 32 | 3 | 4 | 1 | 0 | 3 | 38 | 33 | 3 | 2 | 0 | 0 | 0 |
| Nebraska | 178 | 100 | 78 | 16 | 4 | 1 | 0 | 1 | 77 | 69 | 5 | 3 | 0 | 0 | 1 |
| Kansas | 301 | 185 | 132 | 32 | 12 | 3 | 0 | 6 | 113 | 95 | 11 | 7 | 0 | 0 | 3 |
| West North Central | 3,112 | 1,854 | 1,247 | 351 | 154 | 44 | 8 | 50 | 1,212 | 1,028 | 82 | 102 | 17 | 8 | 21 |
| Delaware | 97 | 48 | 27 | 7 | 10 | 1 | 0 | 3 | 48 | 43 | 2 | 3 | 0 | 0 | 1 |
| Maryland | 555 | 354 | 247 | 92 | 9 | 4 | 0 | 2 | 193 | 170 | 10 | 13 | 1 | 0 | 7 |
| District of Columbia | 157 | 91 | 65 | 16 | 4 | 1 | 3 | 2 | 61 | 57 | 3 | 1 | 1 | 0 | 4 |
| Virginia | 477 | 311 | 249 | 53 | 4 | 1 | 1 | 3 | 153 | 137 | 4 | 12 | 2 | 6 | 5 |
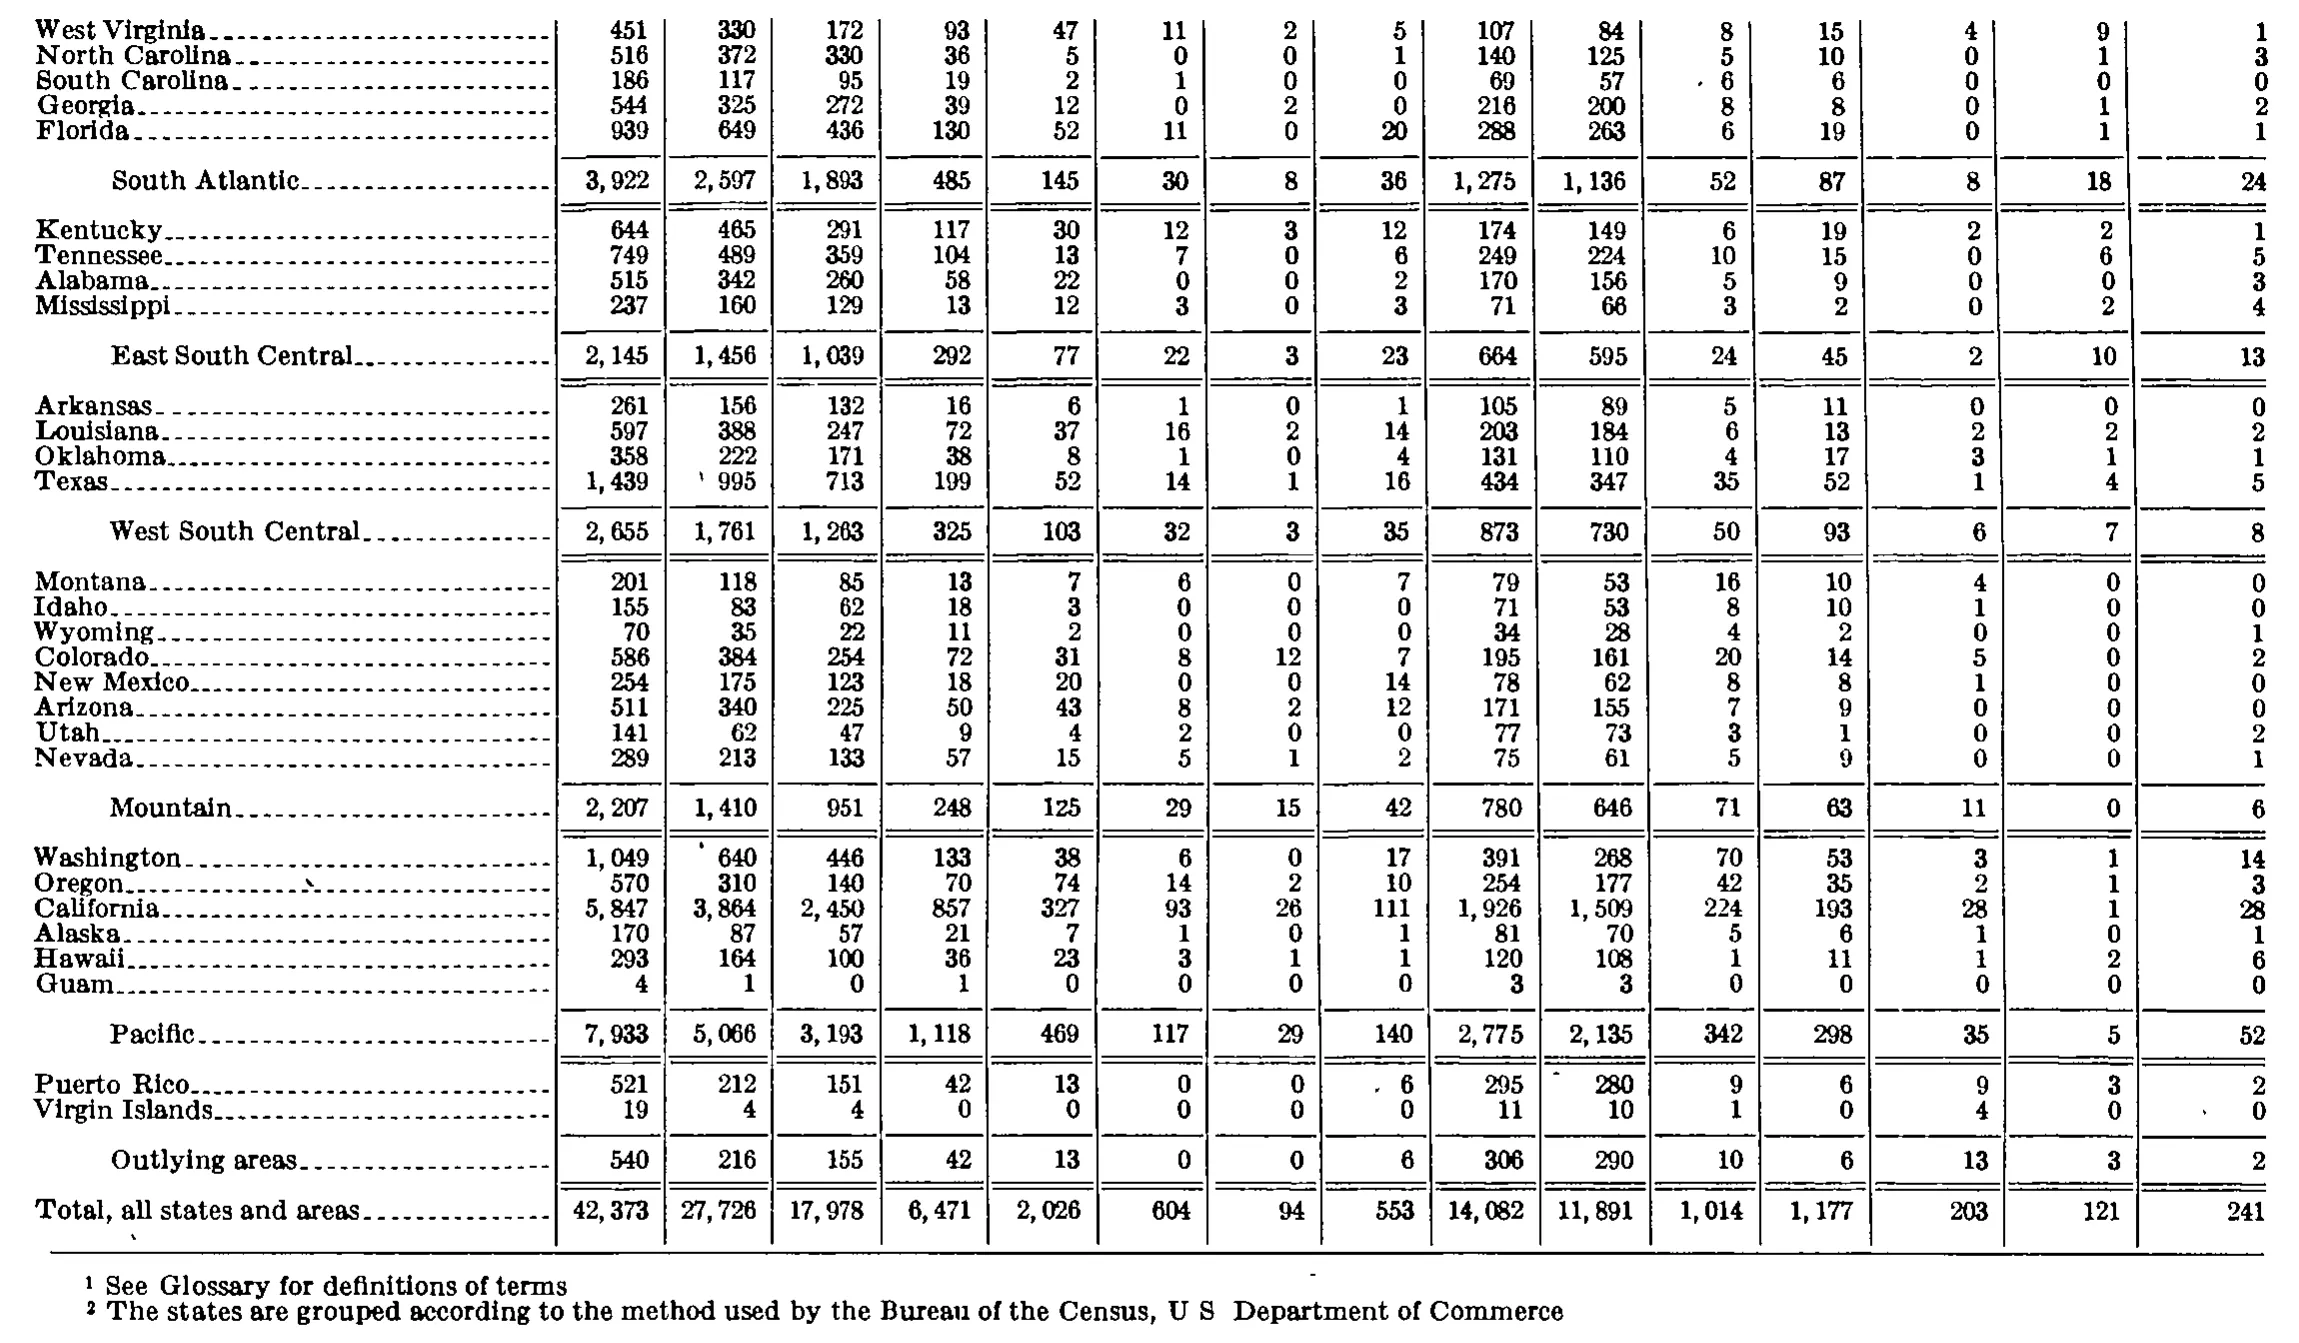
| West Virginia | 451 | 330 | 172 | 93 | 47 | 11 | 2 | 5 | 107 | 84 | 8 | 15 | 4 | 9 | 1 |
| North Carolina | 516 | 372 | 330 | 36 | 5 | 0 | 0 | 1 | 140 | 125 | 5 | 10 | 0 | 1 | 3 |
| South Carolina | 186 | 117 | 95 | 19 | 2 | 1 | 0 | 0 | 69 | 57 | 6 | 6 | 0 | 0 | 0 |
| Georgia | 544 | 325 | 272 | 39 | 12 | 0 | 2 | 0 | 216 | 200 | 8 | 8 | 0 | 1 | 2 |
| Florida | 939 | 649 | 436 | 130 | 52 | 11 | 0 | 20 | 288 | 263 | 6 | 19 | 0 | 1 | 1 |
| South Atlantic | 3,922 | 2,597 | 1,893 | 485 | 145 | 30 | 8 | 36 | 1,275 | 1,136 | 52 | 87 | 8 | 18 | 24 |
| Kentucky | 644 | 465 | 291 | 117 | 30 | 12 | 3 | 12 | 174 | 149 | 6 | 19 | 2 | 2 | 1 |
| Tennessee | 749 | 489 | 359 | 104 | 13 | 7 | 0 | 6 | 249 | 224 | 10 | 15 | 0 | 6 | 5 |
| Alabama | 515 | 342 | 260 | 58 | 22 | 0 | 0 | 2 | 170 | 156 | 5 | 9 | 0 | 0 | 3 |
| Mississippi | 237 | 160 | 129 | 13 | 12 | 3 | 0 | 3 | 71 | 66 | 3 | 2 | 0 | 2 | 4 |
| East South Central | 2,145 | 1,456 | 1,039 | 292 | 77 | 22 | 3 | 23 | 664 | 595 | 24 | 45 | 2 | 10 | 13 |
| Arkansas | 261 | 156 | 132 | 16 | 6 | 1 | 0 | 1 | 105 | 89 | 5 | 11 | 0 | 0 | 0 |
| Louisiana | 597 | 388 | 247 | 72 | 37 | 16 | 2 | 14 | 203 | 184 | 6 | 13 | 2 | 2 | 2 |
| Oklahoma | 358 | 222 | 171 | 38 | 8 | 1 | 0 | 4 | 131 | 110 | 4 | 17 | 3 | 1 | 1 |
| Texas | 1,439 | 995 | 713 | 199 | 52 | 14 | 1 | 16 | 434 | 347 | 35 | 52 | 1 | 4 | 5 |
| West South Central | 2,655 | 1,761 | 1,263 | 325 | 103 | 32 | 3 | 35 | 873 | 730 | 50 | 93 | 6 | 7 | 8 |
| Montana | 201 | 118 | 85 | 13 | 7 | 6 | 0 | 7 | 79 | 53 | 16 | 10 | 4 | 0 | 0 |
| Idaho | 155 | 83 | 62 | 18 | 3 | 0 | 0 | 0 | 71 | 53 | 8 | 10 | 1 | 0 | 0 |
| Wyoming | 70 | 35 | 22 | 11 | 2 | 0 | 0 | 0 | 34 | 28 | 4 | 2 | 0 | 0 | 1 |
| Colorado | 586 | 384 | 254 | 72 | 31 | 8 | 12 | 7 | 195 | 161 | 20 | 14 | 5 | 0 | 2 |
| New Mexico | 254 | 175 | 123 | 18 | 20 | 0 | 0 | 14 | 78 | 62 | 8 | 8 | 1 | 0 | 0 |
| Arizona | 511 | 340 | 225 | 50 | 43 | 8 | 2 | 12 | 171 | 155 | 7 | 9 | 0 | 0 | 0 |
| Utah | 141 | 62 | 47 | 9 | 4 | 2 | 0 | 0 | 77 | 73 | 3 | 1 | 0 | 0 | 2 |
| Nevada | 289 | 213 | 133 | 57 | 15 | 5 | 1 | 2 | 75 | 61 | 5 | 9 | 0 | 0 | 1 |
| Mountain | 2,207 | 1,410 | 951 | 248 | 125 | 29 | 15 | 42 | 780 | 646 | 71 | 63 | 11 | 0 | 6 |
| Washington | 1,049 | 640 | 446 | 133 | 38 | 6 | 0 | 17 | 391 | 268 | 70 | 53 | 3 | 1 | 14 |
| Oregon | 570 | 310 | 140 | 70 | 74 | 14 | 2 | 10 | 254 | 177 | 42 | 35 | 2 | 1 | 3 |
| California | 5,847 | 3,864 | 2,450 | 857 | 327 | 93 | 26 | 111 | 1,926 | 1,509 | 224 | 193 | 28 | 1 | 28 |
| Alaska | 170 | 87 | 57 | 21 | 7 | 1 | 0 | 1 | 81 | 70 | 5 | 6 | 1 | 0 | 1 |
| Hawaii | 293 | 164 | 100 | 36 | 23 | 3 | 1 | 1 | 120 | 108 | 1 | 11 | 1 | 2 | 6 |
| Guam | 4 | 1 | 0 | 1 | 0 | 0 | 0 | 0 | 3 | 3 | 0 | 0 | 0 | 2 | 0 |
| Pacific | 7,933 | 5,066 | 3,193 | 1,118 | 469 | 117 | 29 | 140 | 2,775 | 2,135 | 342 | 298 | 35 | 5 | 52 |
| Puerto Rico | 521 | 212 | 151 | 42 | 13 | 0 | 0 | 6 | 295 | 280 | 9 | 6 | 9 | 3 | 2 |
| Virgin Islands | 19 | 4 | 4 | 0 | 0 | 0 | 0 | 0 | 11 | 10 | 1 | 0 | 4 | 0 | 0 |
| Outlying areas | 540 | 216 | 155 | 42 | 13 | 0 | 0 | 6 | 306 | 290 | 10 | 6 | 13 | 3 | 2 |
| Total, all states and areas | 42,373 | 27,726 | 17,978 | 6,471 | 2,026 | 604 | 94 | 553 | 14,082 | 11,891 | 1,014 | 1,177 | 203 | 121 | 241 |
- 1 See Glossary for definitions of terms
- 2 The states are grouped according to the method used by the Bureau of the Census, U S Department of Commerce
853 of 854 figures sit in a row or column sum that works out. 2 cells break a sum: 'Guam', column 2: prints 4, the subtotals in columns 3 to 16 add to 6; 'Pacific', column 15: prints 5, rows 'Washington' to 'Guam' add to 7.
Reader’s notes
p. 219. The crop is the first page of the table and cuts off mid-body: the last transcribed row is Virginia, and the South Atlantic division (and all remaining divisions, states and the grand total) continue below/on the following page. No footnote texts are printed within the crop, so `footnotes` is empty even though markers appear (the caption carries a raised 1 and the stub heading a raised digit). Stub heading marker: the raised character after "Division and State" is small and slightly broken in the scan; it reads most plausibly as a 2 (the caption uses 1), but a 3 cannot be fully excluded. Transcribed as "Division and State^2". Division rows (New England, Middle Atlantic, East North Central, West North Central) are the printed subtotal lines for the states above them and are kept in place as data rows. Arithmetic check (not applied to the cells, which are as printed): every state row's CA+CB+CC+CD+CE+CP equals its "All C cases", RC+RM+RD equals its "All R cases", and All C + All R + UD + AC + UC equals "All cases"; each division subtotal equals the sum of its states in all 15 numeric columns. No discrepancies were found, which supports the column assignment.
p. 220. Continuation page: no column headings are printed on this crop, so header_rows is empty. The caption, the heading block and the earlier body rows (New England through the first South Atlantic states) are on the preceding page and are not visible here. The grid has 16 columns: the stub plus 15 numeric columns, the last of which is set off by a wider double rule. DOUBTFUL CELL - Guam, numeric column 14 (second from the right): a glyph that reads as "2" sits in that position and is transcribed as printed, but it fails two independent arithmetic checks, so it may be a stray mark or show-through rather than a printed digit. (a) Guam's row total 4 already equals column 2 (1) + column 9 (3), leaving 0 for the final three columns; (b) the Pacific subtotal in that column, 5, equals Washington 1 + Oregon 1 + California 1 + Alaska 0 + Hawaii 2, leaving 0 for Guam. A reader reconciling the table should probably treat this cell as 0 or blank. Every other cell on the page reconciles: for all 36 rows, column 2 = sum of columns 3-8 and column 9 = sum of columns 10-12, and column 1 = column 2 + column 9 + columns 13-15; and the East South Central, West South Central, Mountain, Pacific and Outlying areas subtotals equal the sum of their member rows in all 15 columns. (The South Atlantic subtotal could not be checked because some of its states are on the previous page.) The scan carries several stray specks and short marks printed just to the left of or above values - before Texas 995, before Washington 640, before South Carolina 6 (column 11), before Puerto Rico 6 (column 8), above Puerto Rico 280 (column 10), and before Virgin Islands 0 (column 15), plus a mark under the stub near the Total row. All of those values are confirmed by the arithmetic checks above, so the marks are scan noise, not footnote markers or digits, and were not transcribed. In footnote 2 "U S" is printed without clearly visible periods (they appear lost in the scan); transcribed as it reads. Neither footnote ends with a period as printed. The superscript markers 1 and 2 attach to the caption and column headings on the preceding page, which are not in this crop.
Source image
Source data: U.S. NLRB Annual Reports (public domain). Reconstruction by NLRB Stats Archive. Read by claude-opus-5 (effort max, prompt extract_v1) from the 300-dpi scan; stitched by page. Updated October 2026.