NLRB Stats Archive › Annual Reports › FY1973 › Size of Units in Representation Election Cases Closed, Fiscal Year 1973
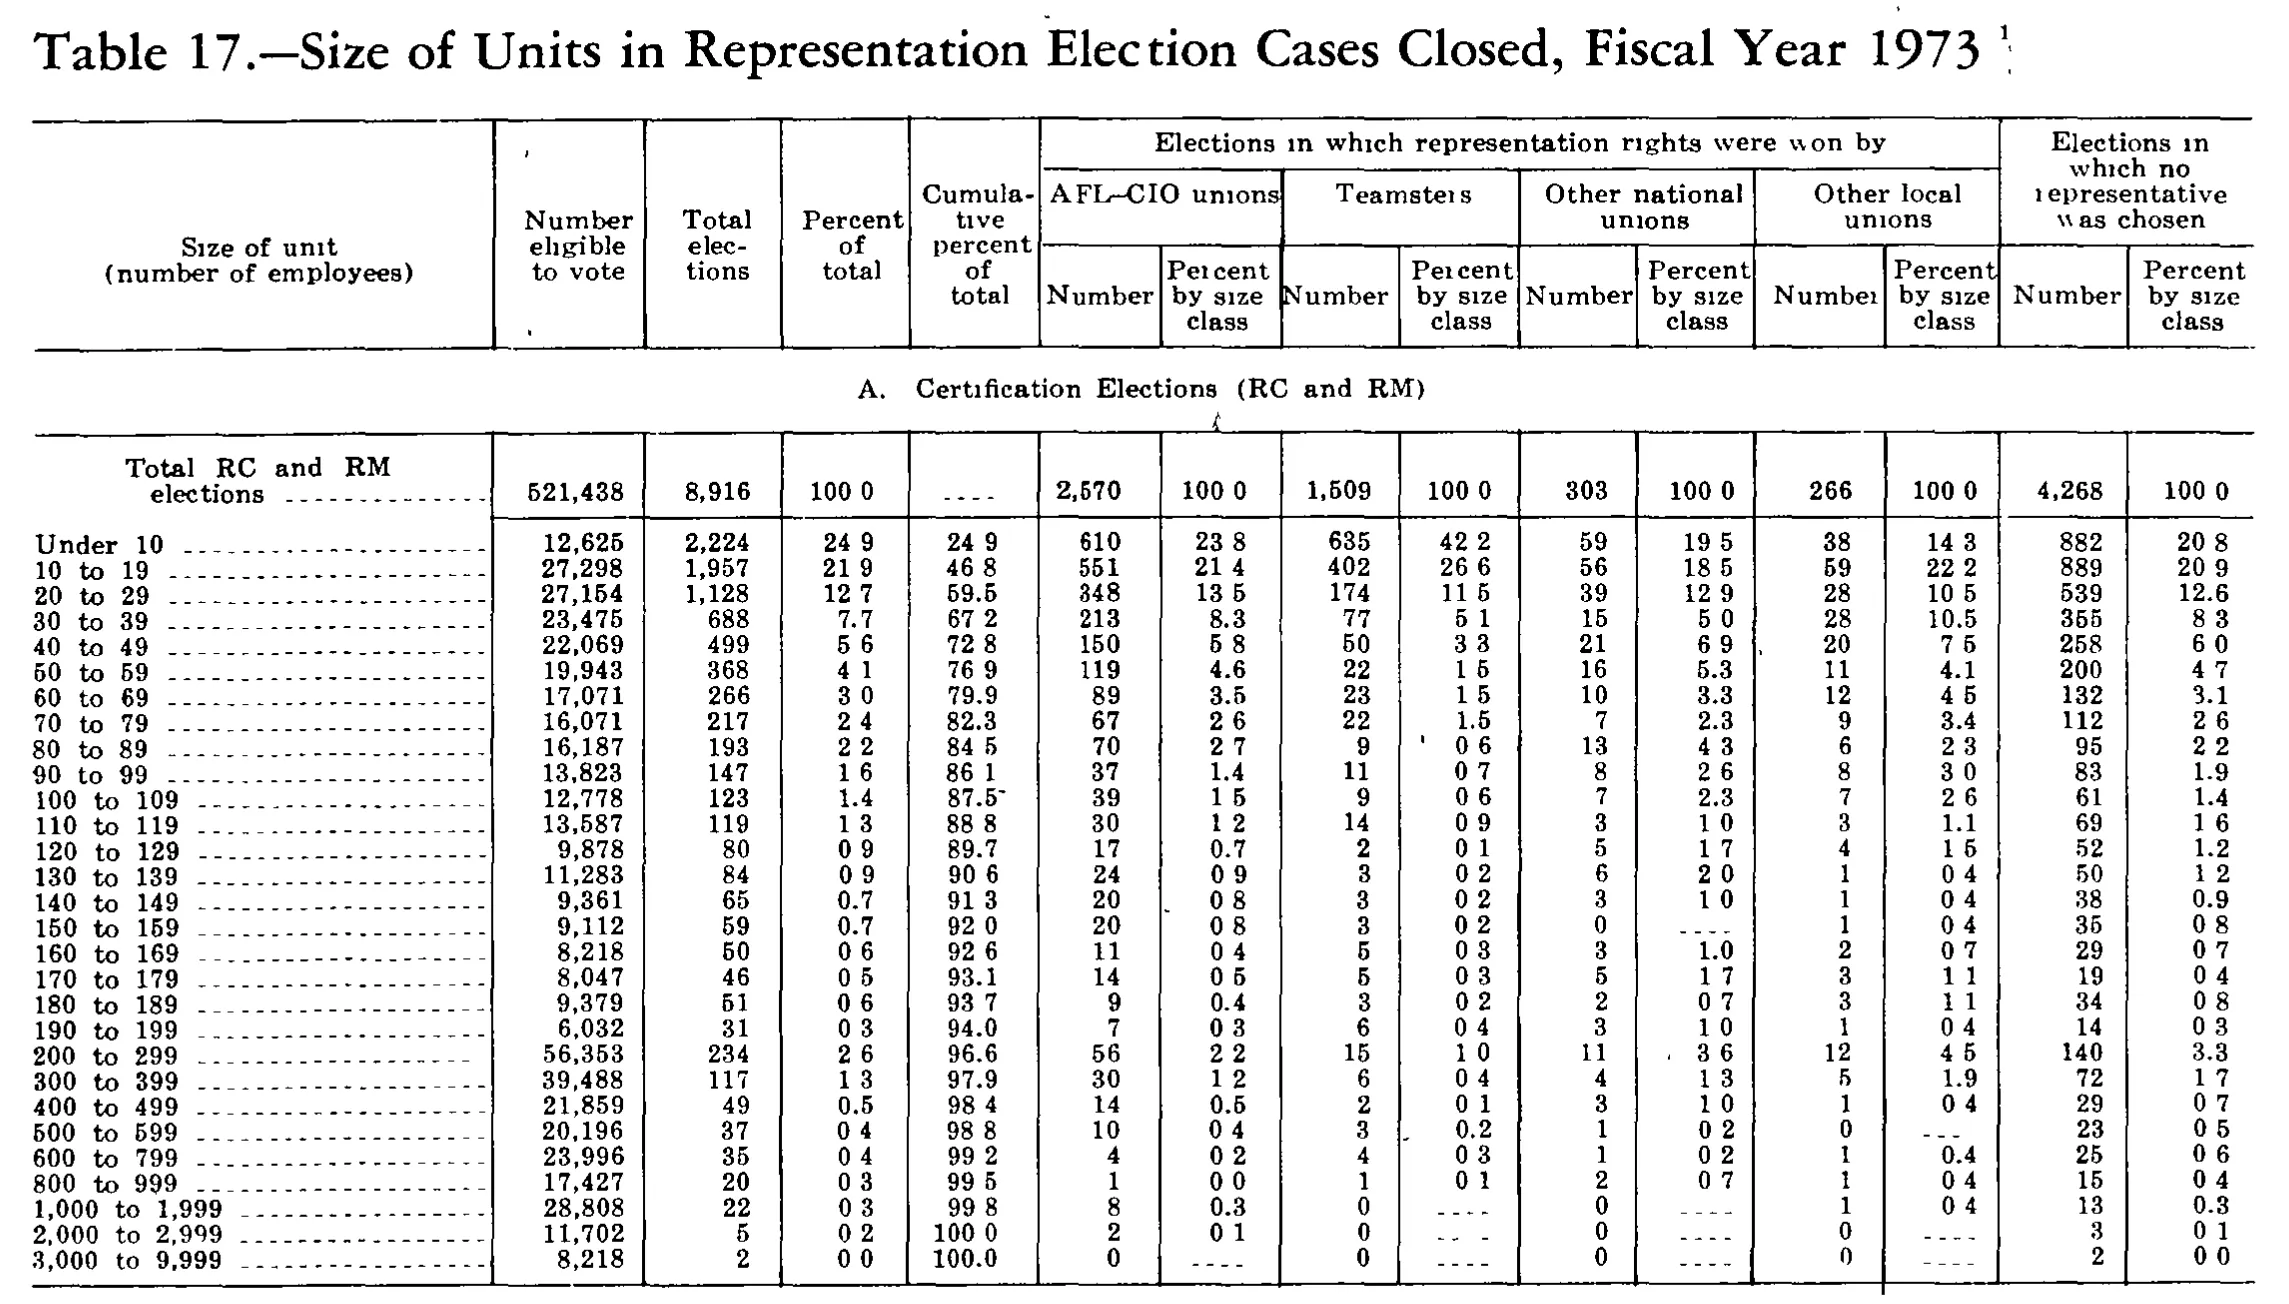
Size of Units in Representation Election Cases Closed, Fiscal Year 1973
Stitched from pp. 259–260.
| Size of unit (number of employees) | Number eligible to vote | Total elections | Percent of total | Cumulative percent of total | Elections in which representation rights were won by | Elections in which no representative was chosen | ||||||||
|---|---|---|---|---|---|---|---|---|---|---|---|---|---|---|
| Size of unit (number of employees) | Number eligible to vote | Total elections | Percent of total | Cumulative percent of total | AFL-CIO unions | Teamsters | Other national unions | Other local unions | Elections in which no representative was chosen | |||||
| Size of unit (number of employees) | Number eligible to vote | Total elections | Percent of total | Cumulative percent of total | Number | Percent by size class | Number | Percent by size class | Number | Percent by size class | Number | Percent by size class | Number | Percent by size class |
| A. Certification Elections (RC and RM) | ||||||||||||||
| Total RC and RM elections | 521,438 | 8,916 | 100.0 | 2,570 | 100.0 | 1,509 | 100.0 | 303 | 100.0 | 266 | 100.0 | 4,268 | 100.0 | |
| Under 10 | 12,625 | 2,224 | 24.9 | 24.9 | 610 | 23.8 | 635 | 42.2 | 59 | 19.5 | 38 | 14.3 | 882 | 20.8 |
| 10 to 19 | 27,298 | 1,957 | 21.9 | 46.8 | 551 | 21.4 | 402 | 26.6 | 56 | 18.5 | 59 | 22.2 | 889 | 20.9 |
| 20 to 29 | 27,154 | 1,128 | 12.7 | 59.5 | 348 | 13.5 | 174 | 11.5 | 39 | 12.9 | 28 | 10.5 | 539 | 12.6 |
| 30 to 39 | 23,475 | 688 | 7.7 | 67.2 | 213 | 8.3 | 77 | 5.1 | 15 | 5.0 | 28 | 10.5 | 355 | 8.3 |
| 40 to 49 | 22,069 | 499 | 5.6 | 72.8 | 150 | 5.8 | 50 | 3.3 | 21 | 6.9 | 20 | 7.5 | 258 | 6.0 |
| 50 to 59 | 19,943 | 368 | 4.1 | 76.9 | 119 | 4.6 | 22 | 1.5 | 16 | 5.3 | 11 | 4.1 | 200 | 4.7 |
| 60 to 69 | 17,071 | 266 | 3.0 | 79.9 | 89 | 3.5 | 23 | 1.5 | 10 | 3.3 | 12 | 4.5 | 132 | 3.1 |
| 70 to 79 | 16,071 | 217 | 2.4 | 82.3 | 67 | 2.6 | 22 | 1.5 | 7 | 2.3 | 9 | 3.4 | 112 | 2.6 |
| 80 to 89 | 16,187 | 193 | 2.2 | 84.5 | 70 | 2.7 | 9 | 0.6 | 13 | 4.3 | 6 | 2.3 | 95 | 2.2 |
| 90 to 99 | 13,823 | 147 | 1.6 | 86.1 | 37 | 1.4 | 11 | 0.7 | 8 | 2.6 | 8 | 3.0 | 83 | 1.9 |
| 100 to 109 | 12,778 | 123 | 1.4 | 87.5 | 39 | 1.5 | 9 | 0.6 | 7 | 2.3 | 7 | 2.6 | 61 | 1.4 |
| 110 to 119 | 13,587 | 119 | 1.3 | 88.8 | 30 | 1.2 | 14 | 0.9 | 3 | 1.0 | 3 | 1.1 | 69 | 1.6 |
| 120 to 129 | 9,878 | 80 | 0.9 | 89.7 | 17 | 0.7 | 2 | 0.1 | 5 | 1.7 | 4 | 1.5 | 52 | 1.2 |
| 130 to 139 | 11,283 | 84 | 0.9 | 90.6 | 24 | 0.9 | 3 | 0.2 | 6 | 2.0 | 1 | 0.4 | 50 | 1.2 |
| 140 to 149 | 9,361 | 65 | 0.7 | 91.3 | 20 | 0.8 | 3 | 0.2 | 3 | 1.0 | 1 | 0.4 | 38 | 0.9 |
| 150 to 159 | 9,112 | 59 | 0.7 | 92.0 | 20 | 0.8 | 3 | 0.2 | 0 | 1 | 0.4 | 35 | 0.8 | |
| 160 to 169 | 8,218 | 50 | 0.6 | 92.6 | 11 | 0.4 | 5 | 0.3 | 3 | 1.0 | 2 | 0.7 | 29 | 0.7 |
| 170 to 179 | 8,047 | 46 | 0.5 | 93.1 | 14 | 0.5 | 5 | 0.3 | 5 | 1.7 | 3 | 1.1 | 19 | 0.4 |
| 180 to 189 | 9,379 | 51 | 0.6 | 93.7 | 9 | 0.4 | 3 | 0.2 | 2 | 0.7 | 3 | 1.1 | 34 | 0.8 |
| 190 to 199 | 6,032 | 31 | 0.3 | 94.0 | 7 | 0.3 | 6 | 0.4 | 3 | 1.0 | 1 | 0.4 | 14 | 0.3 |
| 200 to 299 | 56,353 | 234 | 2.6 | 96.6 | 56 | 2.2 | 15 | 1.0 | 11 | 3.6 | 12 | 4.5 | 140 | 3.3 |
| 300 to 399 | 39,488 | 117 | 1.3 | 97.9 | 30 | 1.2 | 6 | 0.4 | 4 | 1.3 | 5 | 1.9 | 72 | 1.7 |
| 400 to 499 | 21,859 | 49 | 0.5 | 98.4 | 14 | 0.5 | 2 | 0.1 | 3 | 1.0 | 1 | 0.4 | 29 | 0.7 |
| 500 to 599 | 20,196 | 37 | 0.4 | 98.8 | 10 | 0.4 | 3 | 0.2 | 1 | 0.2 | 0 | 23 | 0.5 | |
| 600 to 799 | 23,996 | 35 | 0.4 | 99.2 | 4 | 0.2 | 4 | 0.3 | 1 | 0.2 | 1 | 0.4 | 25 | 0.6 |
| 800 to 999 | 17,427 | 20 | 0.3 | 99.5 | 1 | 0.0 | 1 | 0.1 | 2 | 0.7 | 1 | 0.4 | 15 | 0.4 |
| 1,000 to 1,999 | 28,808 | 22 | 0.3 | 99.8 | 8 | 0.3 | 0 | 0 | 1 | 0.4 | 13 | 0.3 | ||
| 2,000 to 2,999 | 11,702 | 5 | 0.2 | 100.0 | 2 | 0.1 | 0 | 0 | 0 | 3 | 0.1 | |||
| 3,000 to 9,999 | 8,218 | 2 | 0.0 | 100.0 | 0 | 0 | 0 | 0 | 2 | 0.0 | ||||
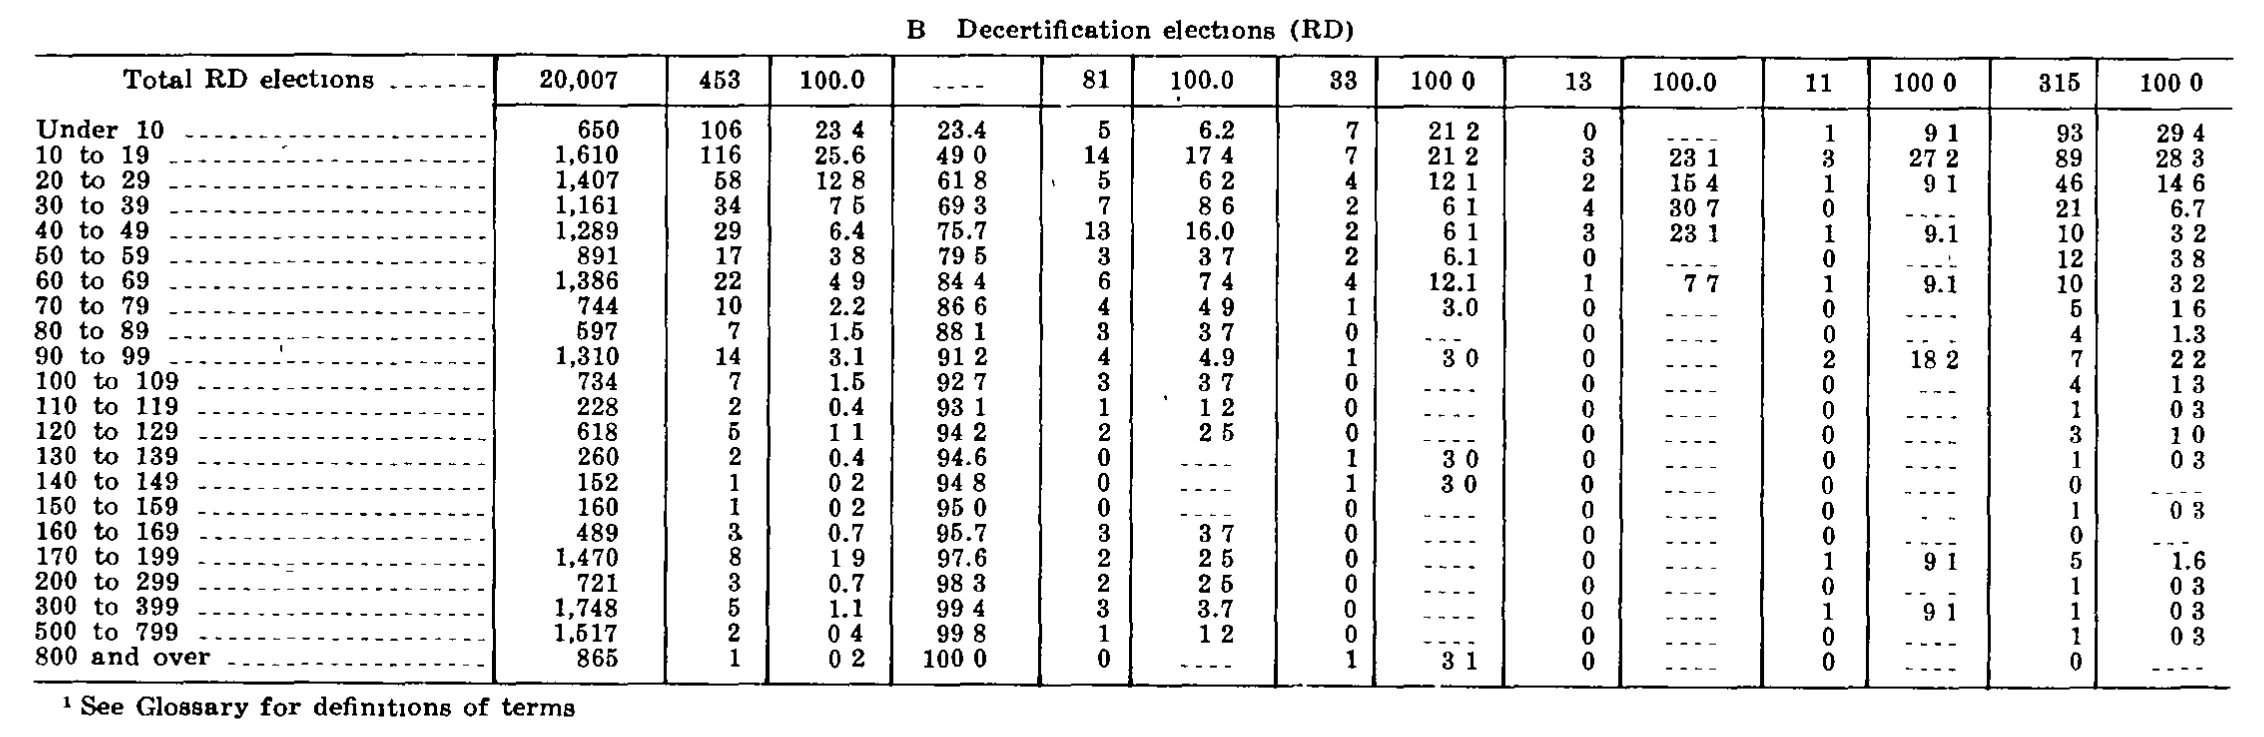
| B Decertification elections (RD) | ||||||||||||||
| Total RD elections | 20,007 | 453 | 100.0 | 81 | 100.0 | 33 | 100.0 | 13 | 100.0 | 11 | 100.0 | 315 | 100.0 | |
| Under 10 | 650 | 106 | 23.4 | 23.4 | 5 | 6.2 | 7 | 21.2 | 0 | 1 | 9.1 | 93 | 29.4 | |
| 10 to 19 | 1,610 | 116 | 25.6 | 49.0 | 14 | 17.4 | 7 | 21.2 | 3 | 23.1 | 3 | 27.2 | 89 | 28.3 |
| 20 to 29 | 1,407 | 58 | 12.8 | 61.8 | 5 | 6.2 | 4 | 12.1 | 2 | 15.4 | 1 | 9.1 | 46 | 14.6 |
| 30 to 39 | 1,161 | 34 | 7.5 | 69.3 | 7 | 8.6 | 2 | 6.1 | 4 | 30.7 | 0 | 21 | 6.7 | |
| 40 to 49 | 1,289 | 29 | 6.4 | 75.7 | 13 | 16.0 | 2 | 6.1 | 3 | 23.1 | 1 | 9.1 | 10 | 3.2 |
| 50 to 59 | 891 | 17 | 3.8 | 79.5 | 3 | 3.7 | 2 | 6.1 | 0 | 0 | 12 | 3.8 | ||
| 60 to 69 | 1,386 | 22 | 4.9 | 84.4 | 6 | 7.4 | 4 | 12.1 | 1 | 7.7 | 1 | 9.1 | 10 | 3.2 |
| 70 to 79 | 744 | 10 | 2.2 | 86.6 | 4 | 4.9 | 1 | 3.0 | 0 | 0 | 5 | 1.6 | ||
| 80 to 89 | 597 | 7 | 1.5 | 88.1 | 3 | 3.7 | 0 | 0 | 0 | 4 | 1.3 | |||
| 90 to 99 | 1,310 | 14 | 3.1 | 91.2 | 4 | 4.9 | 1 | 3.0 | 0 | 2 | 18.2 | 7 | 2.2 | |
| 100 to 109 | 734 | 7 | 1.5 | 92.7 | 3 | 3.7 | 0 | 0 | 0 | 4 | 1.3 | |||
| 110 to 119 | 228 | 2 | 0.4 | 93.1 | 1 | 1.2 | 0 | 0 | 0 | 1 | 0.3 | |||
| 120 to 129 | 618 | 5 | 1.1 | 94.2 | 2 | 2.5 | 0 | 0 | 0 | 3 | 1.0 | |||
| 130 to 139 | 260 | 2 | 0.4 | 94.6 | 0 | 1 | 3.0 | 0 | 0 | 1 | 0.3 | |||
| 140 to 149 | 152 | 1 | 0.2 | 94.8 | 0 | 1 | 3.0 | 0 | 0 | 0 | ||||
| 150 to 159 | 160 | 1 | 0.2 | 95.0 | 0 | 0 | 0 | 0 | 1 | 0.3 | ||||
| 160 to 169 | 489 | 3 | 0.7 | 95.7 | 3 | 3.7 | 0 | 0 | 0 | 0 | ||||
| 170 to 199 | 1,470 | 8 | 1.9 | 97.6 | 2 | 2.5 | 0 | 0 | 1 | 9.1 | 5 | 1.6 | ||
| 200 to 299 | 721 | 3 | 0.7 | 98.3 | 2 | 2.5 | 0 | 0 | 0 | 1 | 0.3 | |||
| 300 to 399 | 1,748 | 5 | 1.1 | 99.4 | 3 | 3.7 | 0 | 0 | 1 | 9.1 | 1 | 0.3 | ||
| 500 to 799 | 1,517 | 2 | 0.4 | 99.8 | 1 | 1.2 | 0 | 0 | 0 | 1 | 0.3 | |||
| 800 and over | 865 | 1 | 0.2 | 100.0 | 0 | 1 | 3.1 | 0 | 0 | 0 | ||||
- 1 See Glossary for definitions of terms
312 of 312 figures sit in a row or column sum that works out.
Reader’s notes
p. 259. Decimal points: this is a coarse 1-bit scan in which the period in many decimal values has dropped out, so cells print as e.g. "100 0", "24 9", "42 2". The surviving dots in the same columns ("59.5", "87.5", "92.0", "100.0", "1.5") show the intended format is one decimal place throughout, so every such value is transcribed with its decimal point restored (space -> "."). No digits were changed. This reading was checked arithmetically and is fully self-consistent: the 29 size-class rows sum exactly to each printed total (521,438 / 8,916 / 2,570 / 1,509 / 303 / 266 / 4,268); each row's five outcome counts sum to its "Total elections"; each of the five "Percent by size class" columns sums to exactly 100.0; and the "Cumulative percent of total" column equals the running sum of the "Percent of total" column. A few printed percentages differ by one unit in the last place from an exact recomputation, but they are printed that way (and are what makes the columns balance to 100.0): "Percent of total" for 800 to 999 is 0.3 (2,224-style exact value 0.22) and for 2,000 to 2,999 is 0.2; Teamsters "Under 10" is 42.2 (exact 42.1); "no representative" for Under 10 and 10 to 19 are 20.8 and 20.9 (exact 20.7 and 20.8); Other national unions for 500 to 599 and 600 to 799 are both 0.2 (exact 0.3). Transcribed as printed, not corrected. Cells holding only a dash rule ("- - - -") are given as "". This applies to the Total row's "Cumulative percent of total" cell and to the percent cells of zero counts. The caption (excluded per instructions) carries a superscript footnote marker 1, but no footnote text appears within this crop; the footnote presumably sits at the foot of the page or after the table's remaining panels, so `footnotes` is empty. The crop shows only panel "A. Certification Elections (RC and RM)"; the table almost certainly continues with a further section (decertification elections) below or on the following page, and no bottom rule is visible. Panel A itself is complete, as confirmed by the exact column sums. Minor legibility notes: stray ink specks sit in the stub column near the top rule and beside the Other national unions cell for "200 to 299" and the Teamsters cell for "80 to 89"; they are print noise, not footnote markers. "AFL-CIO" in the heading is printed with an en-dash-like rule between AFL and CIO and is given as a hyphen.
p. 260. Crop shows only part B of a table continued from the previous page: no column headings are printed on this image, so header_rows is empty. Fifteen columns were counted from the vertical rules (stub + 14 data columns); the data columns alternate count / percent, with column 4 a cumulative percent belonging to the column-2/3 pair. The centered line "B Decertification elections (RD)" sits above the top rule and is carried as a section row with empty value cells. A period after "B" is not legible in the scan, so it is transcribed without one; it is probably "B." with the period lost. This scan drops most decimal points (printed as "100 0", "23 4", "9 1", etc.). They have been restored. Arithmetic confirms both the restoration and the digits: column 1 sums to 20,007, column 2 to 453, column 5 to 81, column 7 to 33, column 9 to 13, column 11 to 11, column 13 to 315 — each matching its printed total exactly — every percent column sums to exactly 100.0, and the running sum of column 3 reproduces column 4 (the cumulative percent) line for line. Printed figures that depart slightly from a straight recomputation are left exactly as printed: "10 to 19" percent-of-81 is 17.4 (14/81 = 17.3); "Under 10" percent-of-315 is 29.4 (93/315 = 29.5); "30 to 39" percent-of-13 is 30.7 (4/13 = 30.8); "10 to 19" percent-of-11 is 27.2 (3/11 = 27.3); "800 and over" percent-of-33 is 3.1 (1/33 = 3.0). In each case the printed value is what makes the column total exactly 100.0, so these look like deliberate rounding adjustments rather than errors. No "400 to 499" size class is printed between "300 to 399" and "500 to 799"; the column totals confirm no row is missing from this transcription, so the class is simply absent from the printed panel. A few stray ink specks appear in the body (left of the "20 to 29" count column and above the "110 to 119" percent column); they are print noise, not digits or footnote markers.
Source image
Source data: U.S. NLRB Annual Reports (public domain). Reconstruction by NLRB Stats Archive. Read by claude-opus-5 (effort max, prompt extract_v1) from the 300-dpi scan; stitched by page. Updated October 2026.