NLRB Stats Archive › Annual Reports › FY1973 › Standard Federal Administrative Regional Distribution of Representation Elections Held in Cases Closed, Fiscal Year 1973
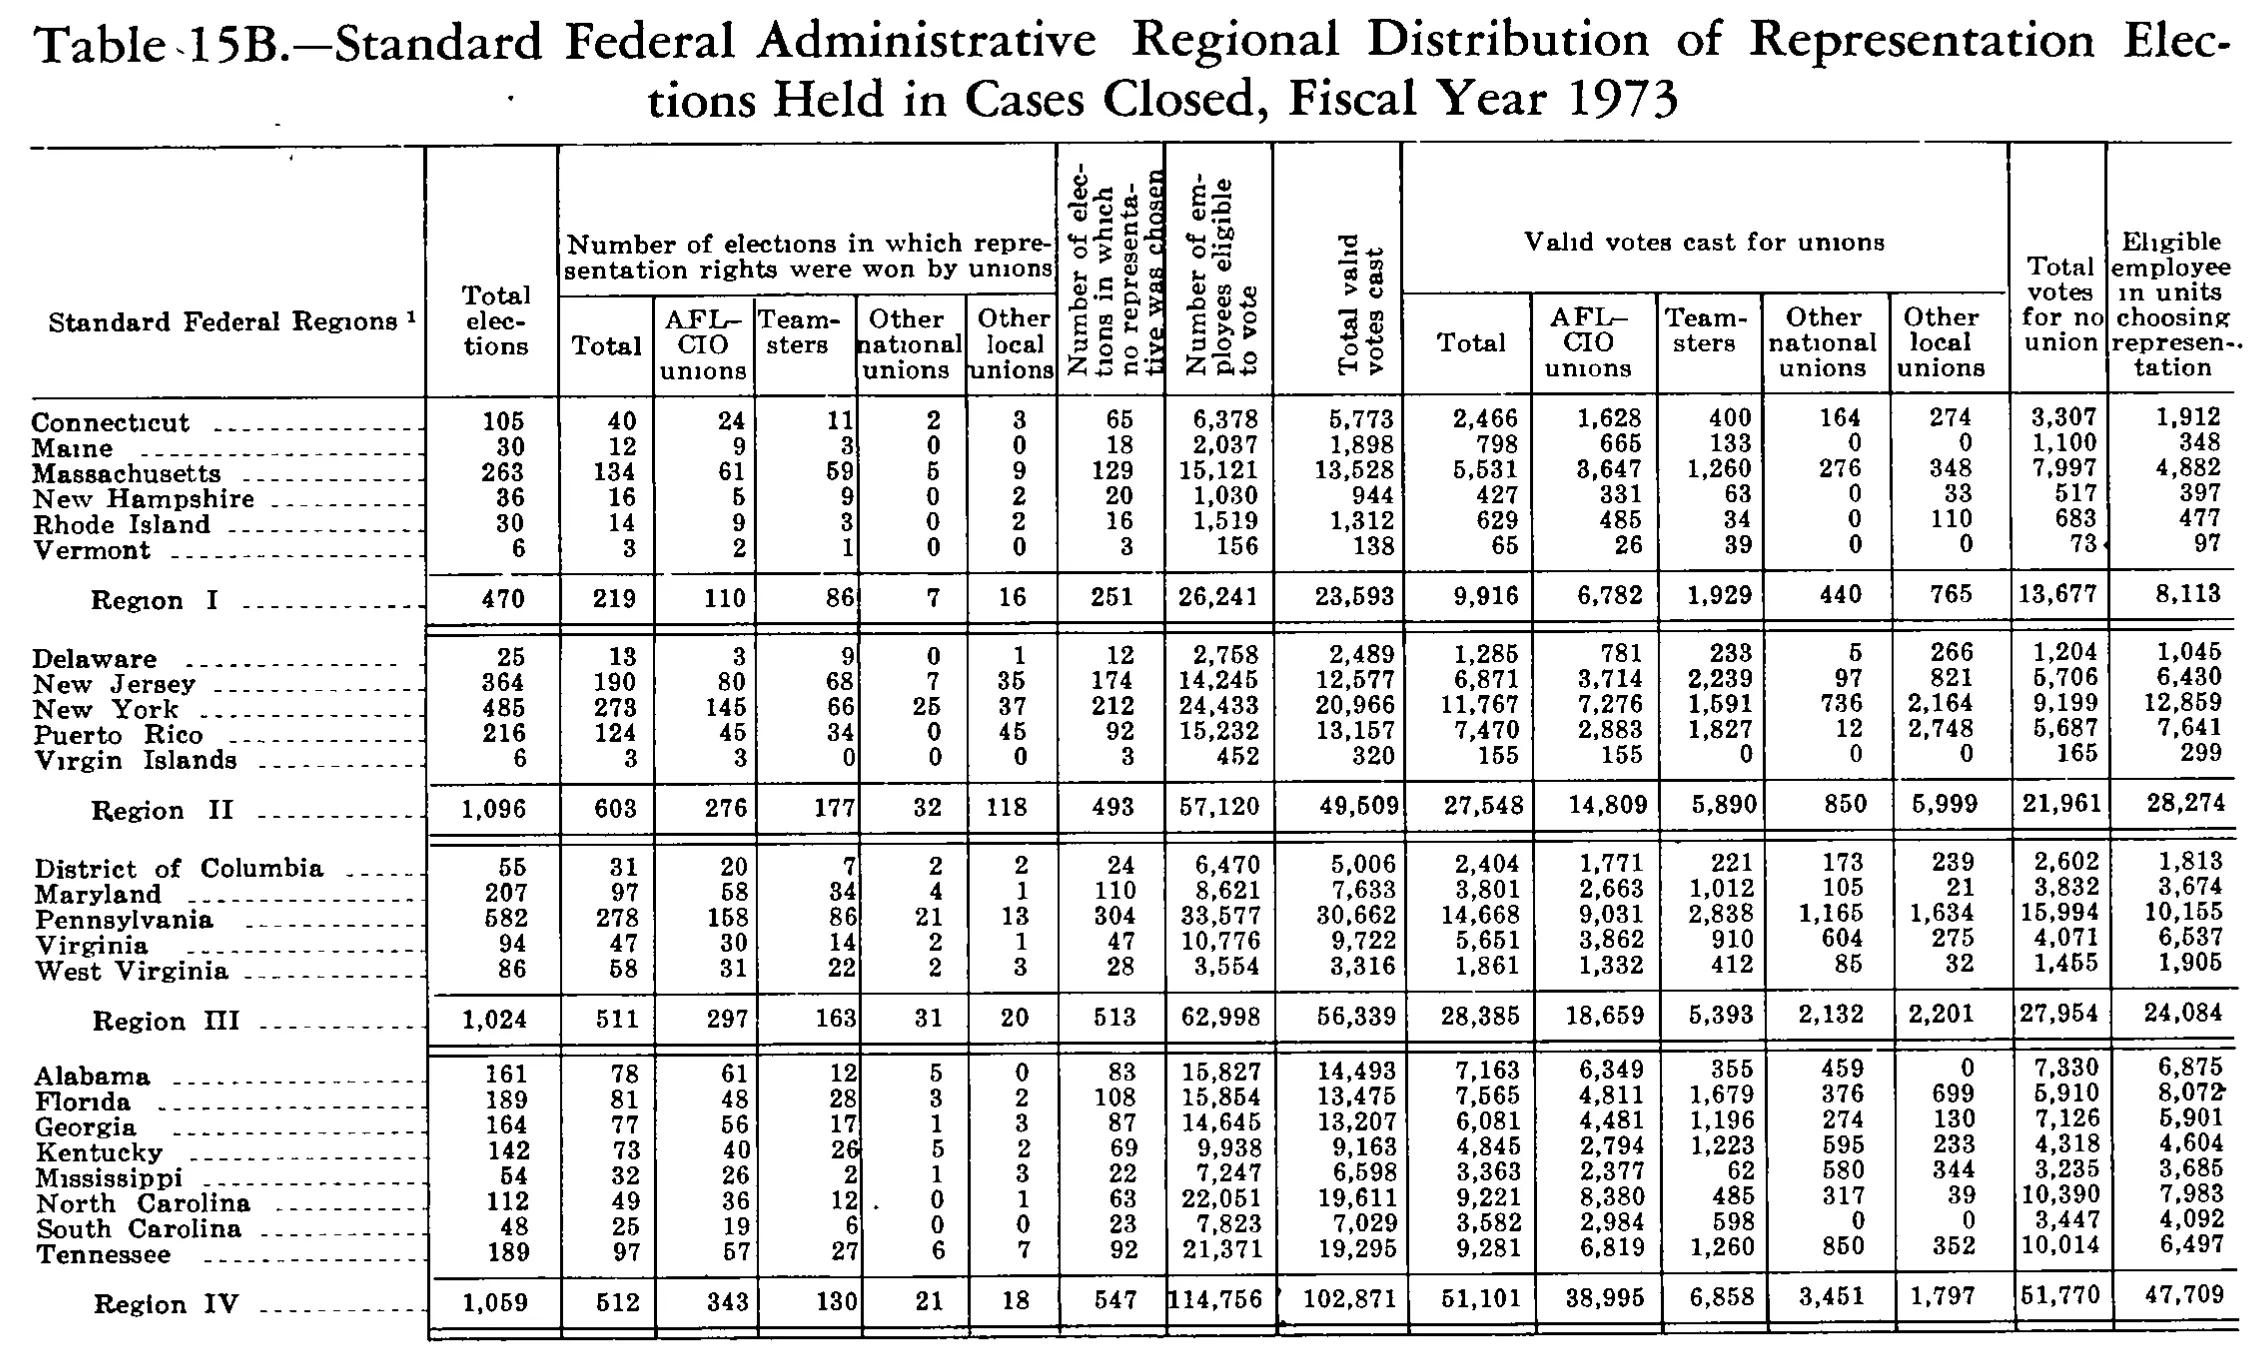
Standard Federal Administrative Regional Distribution of Representation Elections Held in Cases Closed, Fiscal Year 1973
Stitched from pp. 255–256.
| Standard Federal Regions | Total elections | Number of elections in which representation rights were won by unions | Number of elections in which no representative was chosen | Number of employees eligible to vote | Total valid votes cast | Valid votes cast for unions | Total votes for no union | Eligible employee in units choosing representation | ||||||||
|---|---|---|---|---|---|---|---|---|---|---|---|---|---|---|---|---|
| Standard Federal Regions | Total elections | Total | AFL-CIO unions | Teamsters | Other national unions | Other local unions | Number of elections in which no representative was chosen | Number of employees eligible to vote | Total valid votes cast | Total | AFL-CIO unions | Teamsters | Other national unions | Other local unions | Total votes for no union | Eligible employee in units choosing representation |
| Connecticut | 105 | 40 | 24 | 11 | 2 | 3 | 65 | 6,378 | 5,773 | 2,466 | 1,628 | 400 | 164 | 274 | 3,307 | 1,912 |
| Maine | 30 | 12 | 9 | 3 | 0 | 0 | 18 | 2,037 | 1,898 | 798 | 665 | 133 | 0 | 0 | 1,100 | 348 |
| Massachusetts | 263 | 134 | 61 | 59 | 5 | 9 | 129 | 15,121 | 13,528 | 5,531 | 3,647 | 1,260 | 276 | 348 | 7,997 | 4,882 |
| New Hampshire | 36 | 16 | 5 | 9 | 0 | 2 | 20 | 1,030 | 944 | 427 | 331 | 63 | 0 | 33 | 517 | 397 |
| Rhode Island | 30 | 14 | 9 | 3 | 0 | 2 | 16 | 1,519 | 1,312 | 629 | 485 | 34 | 0 | 110 | 683 | 477 |
| Vermont | 6 | 3 | 2 | 1 | 0 | 0 | 3 | 156 | 138 | 65 | 26 | 39 | 0 | 0 | 73 | 97 |
| Region I | 470 | 219 | 110 | 86 | 7 | 16 | 251 | 26,241 | 23,593 | 9,916 | 6,782 | 1,929 | 440 | 765 | 13,677 | 8,113 |
| Delaware | 25 | 13 | 3 | 9 | 0 | 1 | 12 | 2,758 | 2,489 | 1,285 | 781 | 233 | 5 | 266 | 1,204 | 1,045 |
| New Jersey | 364 | 190 | 80 | 68 | 7 | 35 | 174 | 14,245 | 12,577 | 6,871 | 3,714 | 2,239 | 97 | 821 | 5,706 | 6,430 |
| New York | 485 | 273 | 145 | 66 | 25 | 37 | 212 | 24,433 | 20,966 | 11,767 | 7,276 | 1,591 | 736 | 2,164 | 9,199 | 12,859 |
| Puerto Rico | 216 | 124 | 45 | 34 | 0 | 45 | 92 | 15,232 | 13,157 | 7,470 | 2,883 | 1,827 | 12 | 2,748 | 5,687 | 7,641 |
| Virgin Islands | 6 | 3 | 3 | 0 | 0 | 0 | 3 | 452 | 320 | 155 | 155 | 0 | 0 | 0 | 165 | 299 |
| Region II | 1,096 | 603 | 276 | 177 | 32 | 118 | 493 | 57,120 | 49,509 | 27,548 | 14,809 | 5,890 | 850 | 5,999 | 21,961 | 28,274 |
| District of Columbia | 55 | 31 | 20 | 7 | 2 | 2 | 24 | 6,470 | 5,006 | 2,404 | 1,771 | 221 | 173 | 239 | 2,602 | 1,813 |
| Maryland | 207 | 97 | 58 | 34 | 4 | 1 | 110 | 8,621 | 7,633 | 3,801 | 2,663 | 1,012 | 105 | 21 | 3,832 | 3,674 |
| Pennsylvania | 582 | 278 | 158 | 86 | 21 | 13 | 304 | 33,577 | 30,662 | 14,668 | 9,031 | 2,838 | 1,165 | 1,634 | 15,994 | 10,155 |
| Virginia | 94 | 47 | 30 | 14 | 2 | 1 | 47 | 10,776 | 9,722 | 5,651 | 3,862 | 910 | 604 | 275 | 4,071 | 6,537 |
| West Virginia | 86 | 58 | 31 | 22 | 2 | 3 | 28 | 3,554 | 3,316 | 1,861 | 1,332 | 412 | 85 | 32 | 1,455 | 1,905 |
| Region III | 1,024 | 511 | 297 | 163 | 31 | 20 | 513 | 62,998 | 56,339 | 28,385 | 18,659 | 5,393 | 2,132 | 2,201 | 27,954 | 24,084 |
| Alabama | 161 | 78 | 61 | 12 | 5 | 0 | 83 | 15,827 | 14,493 | 7,163 | 6,349 | 355 | 459 | 0 | 7,330 | 6,875 |
| Florida | 189 | 81 | 48 | 28 | 3 | 2 | 108 | 15,854 | 13,475 | 7,565 | 4,811 | 1,679 | 376 | 699 | 5,910 | 8,072 |
| Georgia | 164 | 77 | 56 | 17 | 1 | 3 | 87 | 14,645 | 13,207 | 6,081 | 4,481 | 1,196 | 274 | 130 | 7,126 | 5,901 |
| Kentucky | 142 | 73 | 40 | 26 | 5 | 2 | 69 | 9,938 | 9,163 | 4,845 | 2,794 | 1,223 | 595 | 233 | 4,318 | 4,604 |
| Mississippi | 54 | 32 | 26 | 2 | 1 | 3 | 22 | 7,247 | 6,598 | 3,363 | 2,377 | 62 | 580 | 344 | 3,235 | 3,685 |
| North Carolina | 112 | 49 | 36 | 12 | 0 | 1 | 63 | 22,051 | 19,611 | 9,221 | 8,380 | 485 | 317 | 39 | 10,390 | 7,983 |
| South Carolina | 48 | 25 | 19 | 6 | 0 | 0 | 23 | 7,823 | 7,029 | 3,582 | 2,984 | 598 | 0 | 0 | 3,447 | 4,092 |
| Tennessee | 189 | 97 | 57 | 27 | 6 | 7 | 92 | 21,371 | 19,295 | 9,281 | 6,819 | 1,260 | 850 | 352 | 10,014 | 6,497 |
| Region IV | 1,059 | 512 | 343 | 130 | 21 | 18 | 547 | 114,756 | 102,871 | 51,101 | 38,995 | 6,858 | 3,451 | 1,797 | 51,770 | 47,709 |
| Illinois | 407 | 204 | 107 | 61 | 22 | 14 | 203 | 24,071 | 21,200 | 10,404 | 5,048 | 1,914 | 2,746 | 696 | 10,796 | 8,647 |
| Indiana | 315 | 171 | 88 | 62 | 17 | 4 | 144 | 18,955 | 17,060 | 9,160 | 5,457 | 1,672 | 1,710 | 321 | 7,900 | 9,643 |
| Michigan | 504 | 249 | 100 | 81 | 58 | 10 | 255 | 24,842 | 21,813 | 10,378 | 5,090 | 1,630 | 3,437 | 221 | 11,435 | 8,934 |
| Minnesota | 206 | 120 | 60 | 41 | 17 | 2 | 86 | 7,086 | 6,290 | 3,229 | 1,777 | 910 | 469 | 73 | 3,061 | 3,391 |
| Ohio | 626 | 342 | 191 | 112 | 25 | 14 | 284 | 30,031 | 27,235 | 14,897 | 7,095 | 2,671 | 3,357 | 1,774 | 12,338 | 14,076 |
| Wisconsin | 299 | 154 | 82 | 56 | 11 | 5 | 145 | 14,829 | 12,755 | 6,135 | 3,790 | 1,258 | 662 | 425 | 6,620 | 5,553 |
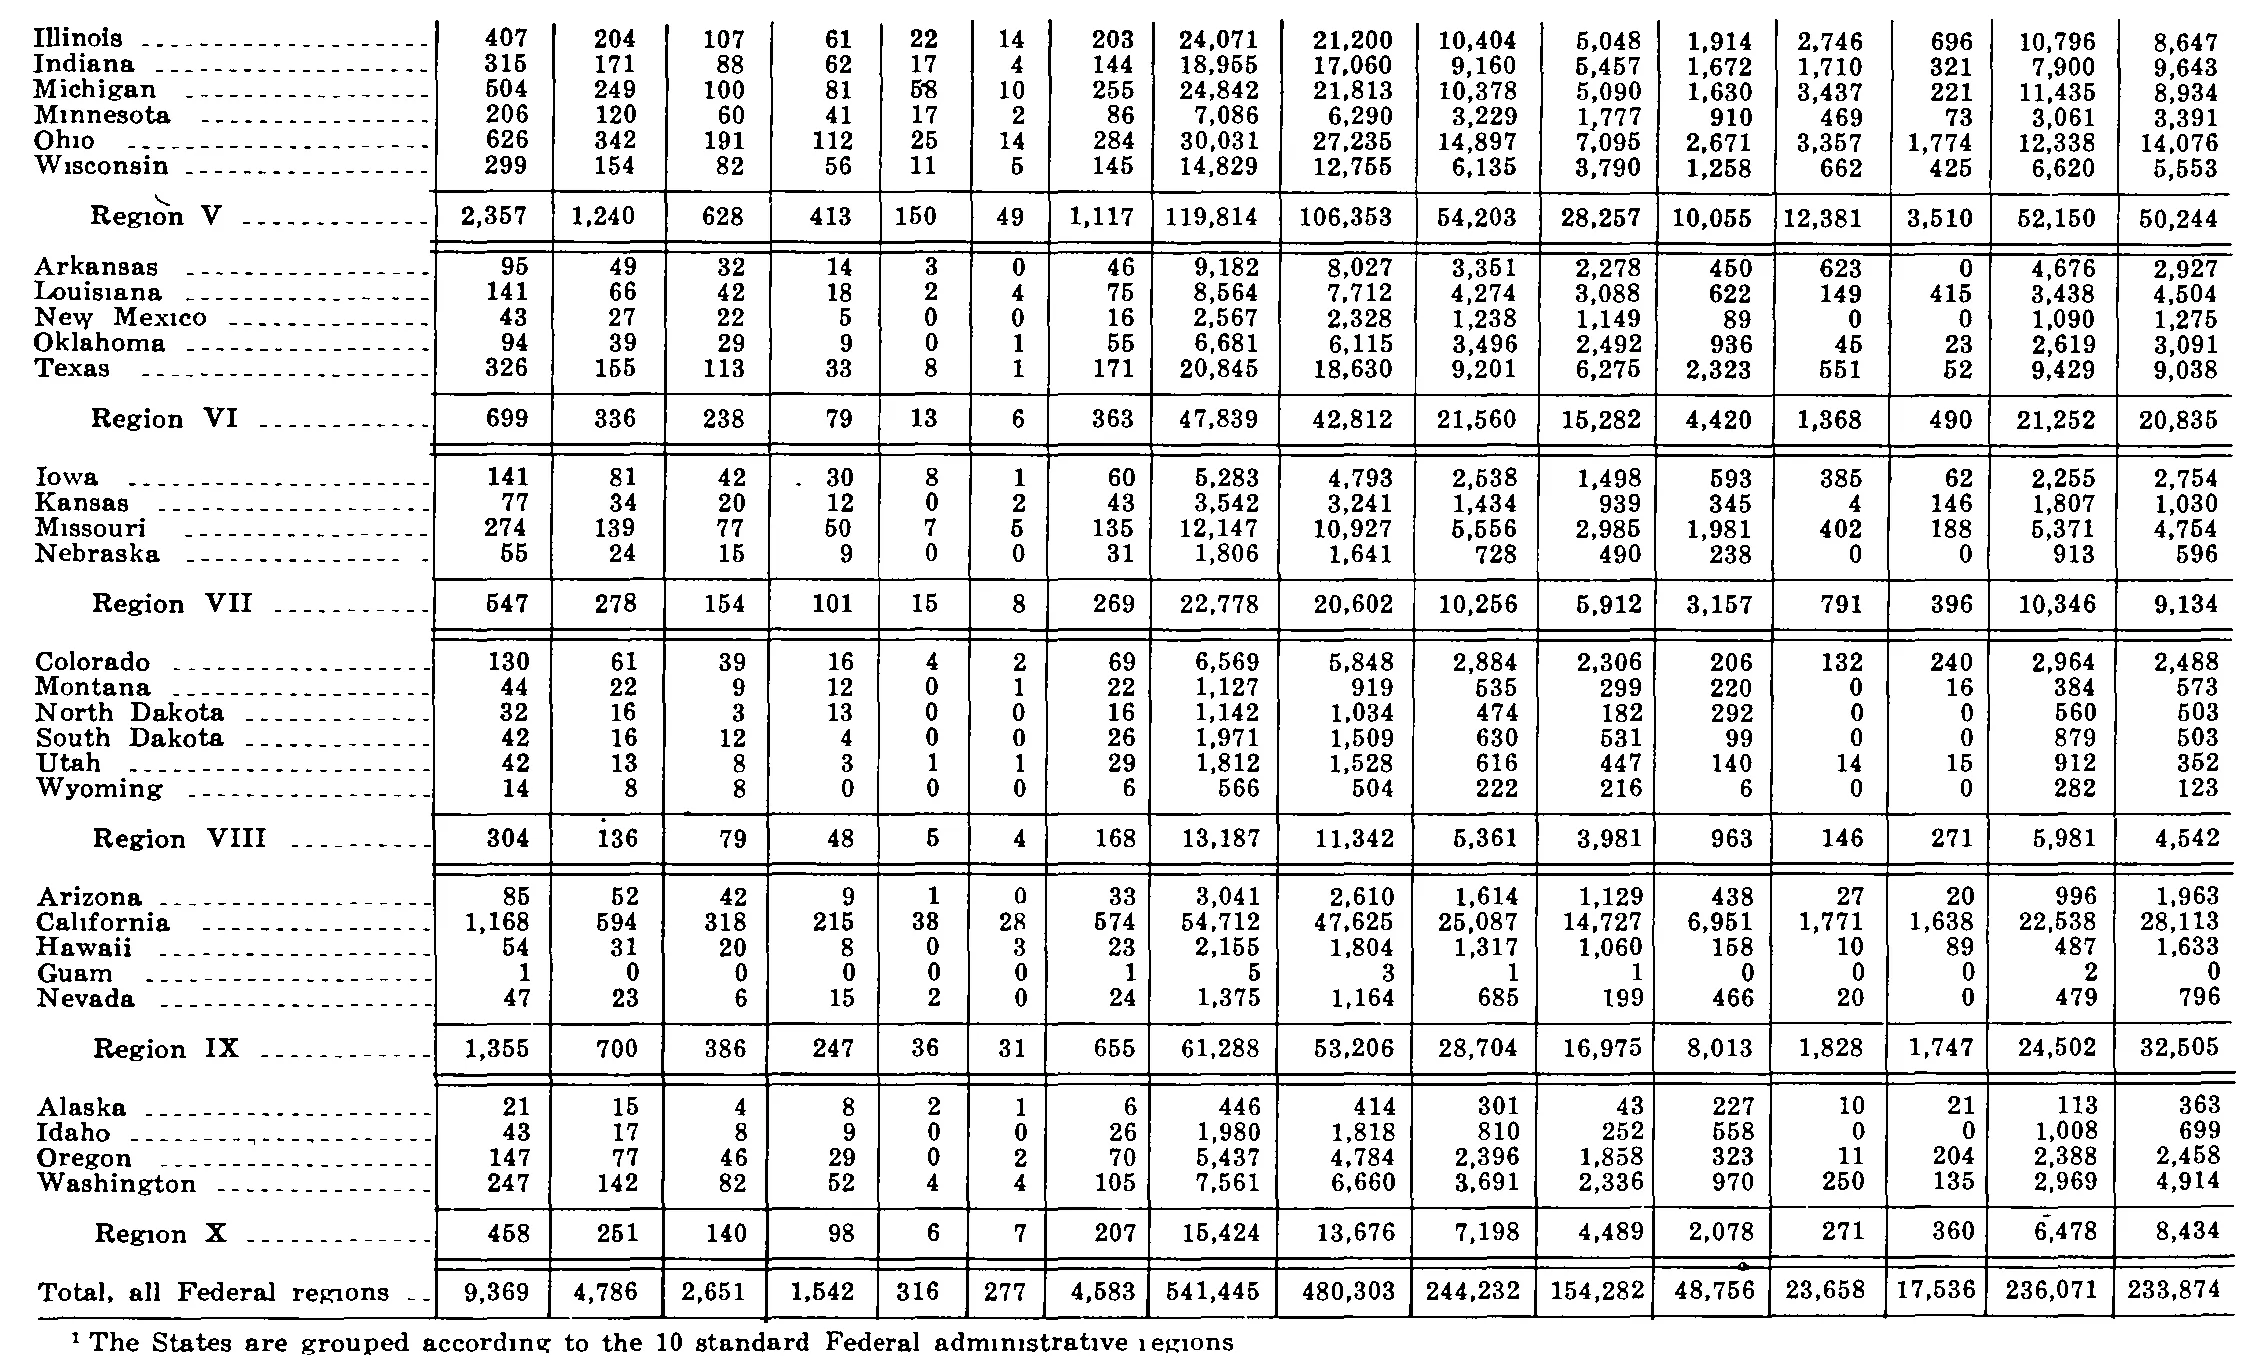
| Region V | 2,357 | 1,240 | 628 | 413 | 150 | 49 | 1,117 | 119,814 | 106,353 | 54,203 | 28,257 | 10,055 | 12,381 | 3,510 | 52,150 | 50,244 |
| Arkansas | 95 | 49 | 32 | 14 | 3 | 0 | 46 | 9,182 | 8,027 | 3,351 | 2,278 | 450 | 623 | 0 | 4,676 | 2,927 |
| Louisiana | 141 | 66 | 42 | 18 | 2 | 4 | 75 | 8,564 | 7,712 | 4,274 | 3,088 | 622 | 149 | 415 | 3,438 | 4,504 |
| New Mexico | 43 | 27 | 22 | 5 | 0 | 0 | 16 | 2,567 | 2,328 | 1,238 | 1,149 | 89 | 0 | 0 | 1,090 | 1,275 |
| Oklahoma | 94 | 39 | 29 | 9 | 0 | 1 | 55 | 6,681 | 6,115 | 3,496 | 2,492 | 936 | 45 | 23 | 2,619 | 3,091 |
| Texas | 326 | 155 | 113 | 33 | 8 | 1 | 171 | 20,845 | 18,630 | 9,201 | 6,275 | 2,323 | 551 | 52 | 9,429 | 9,038 |
| Region VI | 699 | 336 | 238 | 79 | 13 | 6 | 363 | 47,839 | 42,812 | 21,560 | 15,282 | 4,420 | 1,368 | 490 | 21,252 | 20,835 |
| Iowa | 141 | 81 | 42 | 30 | 8 | 1 | 60 | 5,283 | 4,793 | 2,538 | 1,498 | 593 | 385 | 62 | 2,255 | 2,754 |
| Kansas | 77 | 34 | 20 | 12 | 0 | 2 | 43 | 3,542 | 3,241 | 1,434 | 939 | 345 | 4 | 146 | 1,807 | 1,030 |
| Missouri | 274 | 139 | 77 | 50 | 7 | 5 | 135 | 12,147 | 10,927 | 5,556 | 2,985 | 1,981 | 402 | 188 | 5,371 | 4,754 |
| Nebraska | 55 | 24 | 15 | 9 | 0 | 0 | 31 | 1,806 | 1,641 | 728 | 490 | 238 | 0 | 0 | 913 | 596 |
| Region VII | 547 | 278 | 154 | 101 | 15 | 8 | 269 | 22,778 | 20,602 | 10,256 | 5,912 | 3,157 | 791 | 396 | 10,346 | 9,134 |
| Colorado | 130 | 61 | 39 | 16 | 4 | 2 | 69 | 6,569 | 5,848 | 2,884 | 2,306 | 206 | 132 | 240 | 2,964 | 2,488 |
| Montana | 44 | 22 | 9 | 12 | 0 | 1 | 22 | 1,127 | 919 | 535 | 299 | 220 | 0 | 16 | 384 | 573 |
| North Dakota | 32 | 16 | 3 | 13 | 0 | 0 | 16 | 1,142 | 1,034 | 474 | 182 | 292 | 0 | 0 | 560 | 503 |
| South Dakota | 42 | 16 | 12 | 4 | 0 | 0 | 26 | 1,971 | 1,509 | 630 | 531 | 99 | 0 | 0 | 879 | 503 |
| Utah | 42 | 13 | 8 | 3 | 1 | 1 | 29 | 1,812 | 1,528 | 616 | 447 | 140 | 14 | 15 | 912 | 352 |
| Wyoming | 14 | 8 | 8 | 0 | 0 | 0 | 6 | 566 | 504 | 222 | 216 | 6 | 0 | 0 | 282 | 123 |
| Region VIII | 304 | 136 | 79 | 48 | 5 | 4 | 168 | 13,187 | 11,342 | 5,361 | 3,981 | 963 | 146 | 271 | 5,981 | 4,542 |
| Arizona | 85 | 52 | 42 | 9 | 1 | 0 | 33 | 3,041 | 2,610 | 1,614 | 1,129 | 438 | 27 | 20 | 996 | 1,963 |
| California | 1,168 | 594 | 318 | 215 | 38 | 28 | 574 | 54,712 | 47,625 | 25,087 | 14,727 | 6,951 | 1,771 | 1,638 | 22,538 | 28,113 |
| Hawaii | 54 | 31 | 20 | 8 | 0 | 3 | 23 | 2,155 | 1,804 | 1,317 | 1,060 | 158 | 10 | 89 | 487 | 1,633 |
| Guam | 1 | 0 | 0 | 0 | 0 | 0 | 1 | 5 | 3 | 1 | 1 | 0 | 0 | 0 | 2 | 0 |
| Nevada | 47 | 23 | 6 | 15 | 2 | 0 | 24 | 1,375 | 1,164 | 685 | 199 | 466 | 20 | 0 | 479 | 796 |
| Region IX | 1,355 | 700 | 386 | 247 | 36 | 31 | 655 | 61,288 | 53,206 | 28,704 | 16,975 | 8,013 | 1,828 | 1,747 | 24,502 | 32,505 |
| Alaska | 21 | 15 | 4 | 8 | 2 | 1 | 6 | 446 | 414 | 301 | 43 | 227 | 10 | 21 | 113 | 363 |
| Idaho | 43 | 17 | 8 | 9 | 0 | 0 | 26 | 1,980 | 1,818 | 810 | 252 | 558 | 0 | 0 | 1,008 | 699 |
| Oregon | 147 | 77 | 46 | 29 | 0 | 2 | 70 | 5,437 | 4,784 | 2,396 | 1,858 | 323 | 11 | 204 | 2,388 | 2,458 |
| Washington | 247 | 142 | 82 | 52 | 4 | 4 | 105 | 7,561 | 6,660 | 3,691 | 2,336 | 970 | 250 | 135 | 2,969 | 4,914 |
| Region X | 458 | 251 | 140 | 98 | 6 | 7 | 207 | 15,424 | 13,676 | 7,198 | 4,489 | 2,078 | 271 | 360 | 6,478 | 8,434 |
| Total, all Federal regions | 9,369 | 4,786 | 2,651 | 1,542 | 316 | 277 | 4,583 | 541,445 | 480,303 | 244,232 | 154,282 | 48,756 | 23,658 | 17,536 | 236,071 | 233,874 |
- 1 The States are grouped according to the 10 standard Federal administrative regions
966 of 968 figures sit in a row or column sum that works out. 5 cells break a sum: 'California', column 3: prints 594, columns 4 to 7 add to 599; 'Region IX', column 11: prints 28,704, columns 12 to 15 add to 28,563; 'Region IX', column 6: prints 36, rows 'Arizona' to 'Nevada' add to 41; 'Region IX', column 12: prints 16,975, rows 'Arizona' to 'Nevada' add to 17,116; 'Total, all Federal regions', column 12: prints 154,282, the subtotals in rows 'Region I' to 'Region X' add to 154,141.
Reader’s notes
p. 255. 17 columns. The crop ends just below the Region IV subtotal rule; the table itself continues (Regions V onward) on the following page, and no footnote text is printed on this image, so `footnotes` is empty even though the stub heading carries a raised 1 ("Standard Federal Regions^1"). Four of the headings are set vertically (rotated) in narrow columns: "Number of elections in which no representative was chosen", "Number of employees eligible to vote", "Total valid votes cast", and "Total votes for no union"; each is a tall single heading occupying both heading levels, so it is repeated in both header rows. The last heading is printed "Eligible employee in units choosing representa- tion" (end-of-line hyphen repaired to "representation"); "employee" is singular as printed, which may be a misprint for "employees". "AFL–CIO unions" is printed with a dash between AFL and CIO; transcribed as "AFL-CIO". Every row and subtotal was checked arithmetically and is internally consistent: for each state, won + no-representative = total elections; the four union categories sum to the "won" total and to the "valid votes cast for unions" total; union votes + no-union votes = total valid votes; and all four Region subtotals equal the sums of their member rows in all 16 numeric columns. No discrepancies found. All cells were legible; the one slightly faint cell was New Hampshire / AFL-CIO unions (elections won) = 5, confirmed by the row sum 5+9+0+2 = 16.
p. 256. This is a continuation page: no column headings are printed on the crop, and the table's caption and the first four Federal regions (Regions I-IV) appear on the preceding page, so header_rows is empty. The grid has 17 columns (stub plus 16 numeric columns), read off the vertical column rules. I verified the transcription arithmetically. Two internal relations hold across the table: column 2 = columns 3+4+5+6 and column 1 = column 2 + column 7; and column 10 = columns 11+12+13+14. Every state row, and the regional totals for Regions V, VI, VII, VIII and X, reconcile exactly under both relations and under straight column addition, as does the "Total, all Federal regions" row. Two cells are exceptions: 1. California, column 5 (the column where Region V shows 150): I read the printed digits as "38" on two passes and have transcribed 38 as printed, but two independent checks both fail by exactly 5 and both would succeed with 33. California's own row sum gives 318+215+38+28 = 599 against the printed 594 in column 2, and the Region IX column 5 total of 36 requires 1+33+0+0+2. This is either a printing error in the source or a misread of a 3 as an 8 at this scan resolution; I could not resolve it further without magnification. Treat this cell as doubtful. 2. Region IX, column 11 (the column where the grand total is 154,282): printed 16,975. This is inconsistent with the rest of the table and appears to be a misprint rather than a misread, since the surrounding digits are clear and no plausible single-digit confusion reconciles it. The five member rows sum to 1,129+14,727+1,060+1+199 = 17,116, and the Region IX column 10 total of 28,704 requires 17,116+8,013+1,828+1,747. All four of the component state values are confirmed by their own row relations (each state's columns 11+12+13+14 equal its printed column 10). Transcribed as printed. Minor scan artifacts, none transcribed as content: a stray speck sits just left of "30" in the Iowa row (column 4), a speck above the "Region VIII" label, and a small mark above the "48,756" cell in the "Total, all Federal regions" row. The mark above 48,756 is a dust speck sitting on the horizontal rule rather than a raised footnote marker, as no corresponding footnote is printed and the other grand-total cells carry no markers. The footnote marker "1" is printed as a superscript on the footnote line itself; no footnote reference marker is visible on any row label or value within this crop, as the referencing marker falls on the caption or stub heading on the preceding page.
Source image
Source data: U.S. NLRB Annual Reports (public domain). Reconstruction by NLRB Stats Archive. Read by claude-opus-5 (effort max, prompt extract_v1) from the 300-dpi scan; stitched by page. Updated October 2026.