NLRB Stats Archive › Annual Reports › FY1973 › Analysis of Methods of Disposition of Representation and Union Deauthorization Cases Closed, Fiscal Year 1973
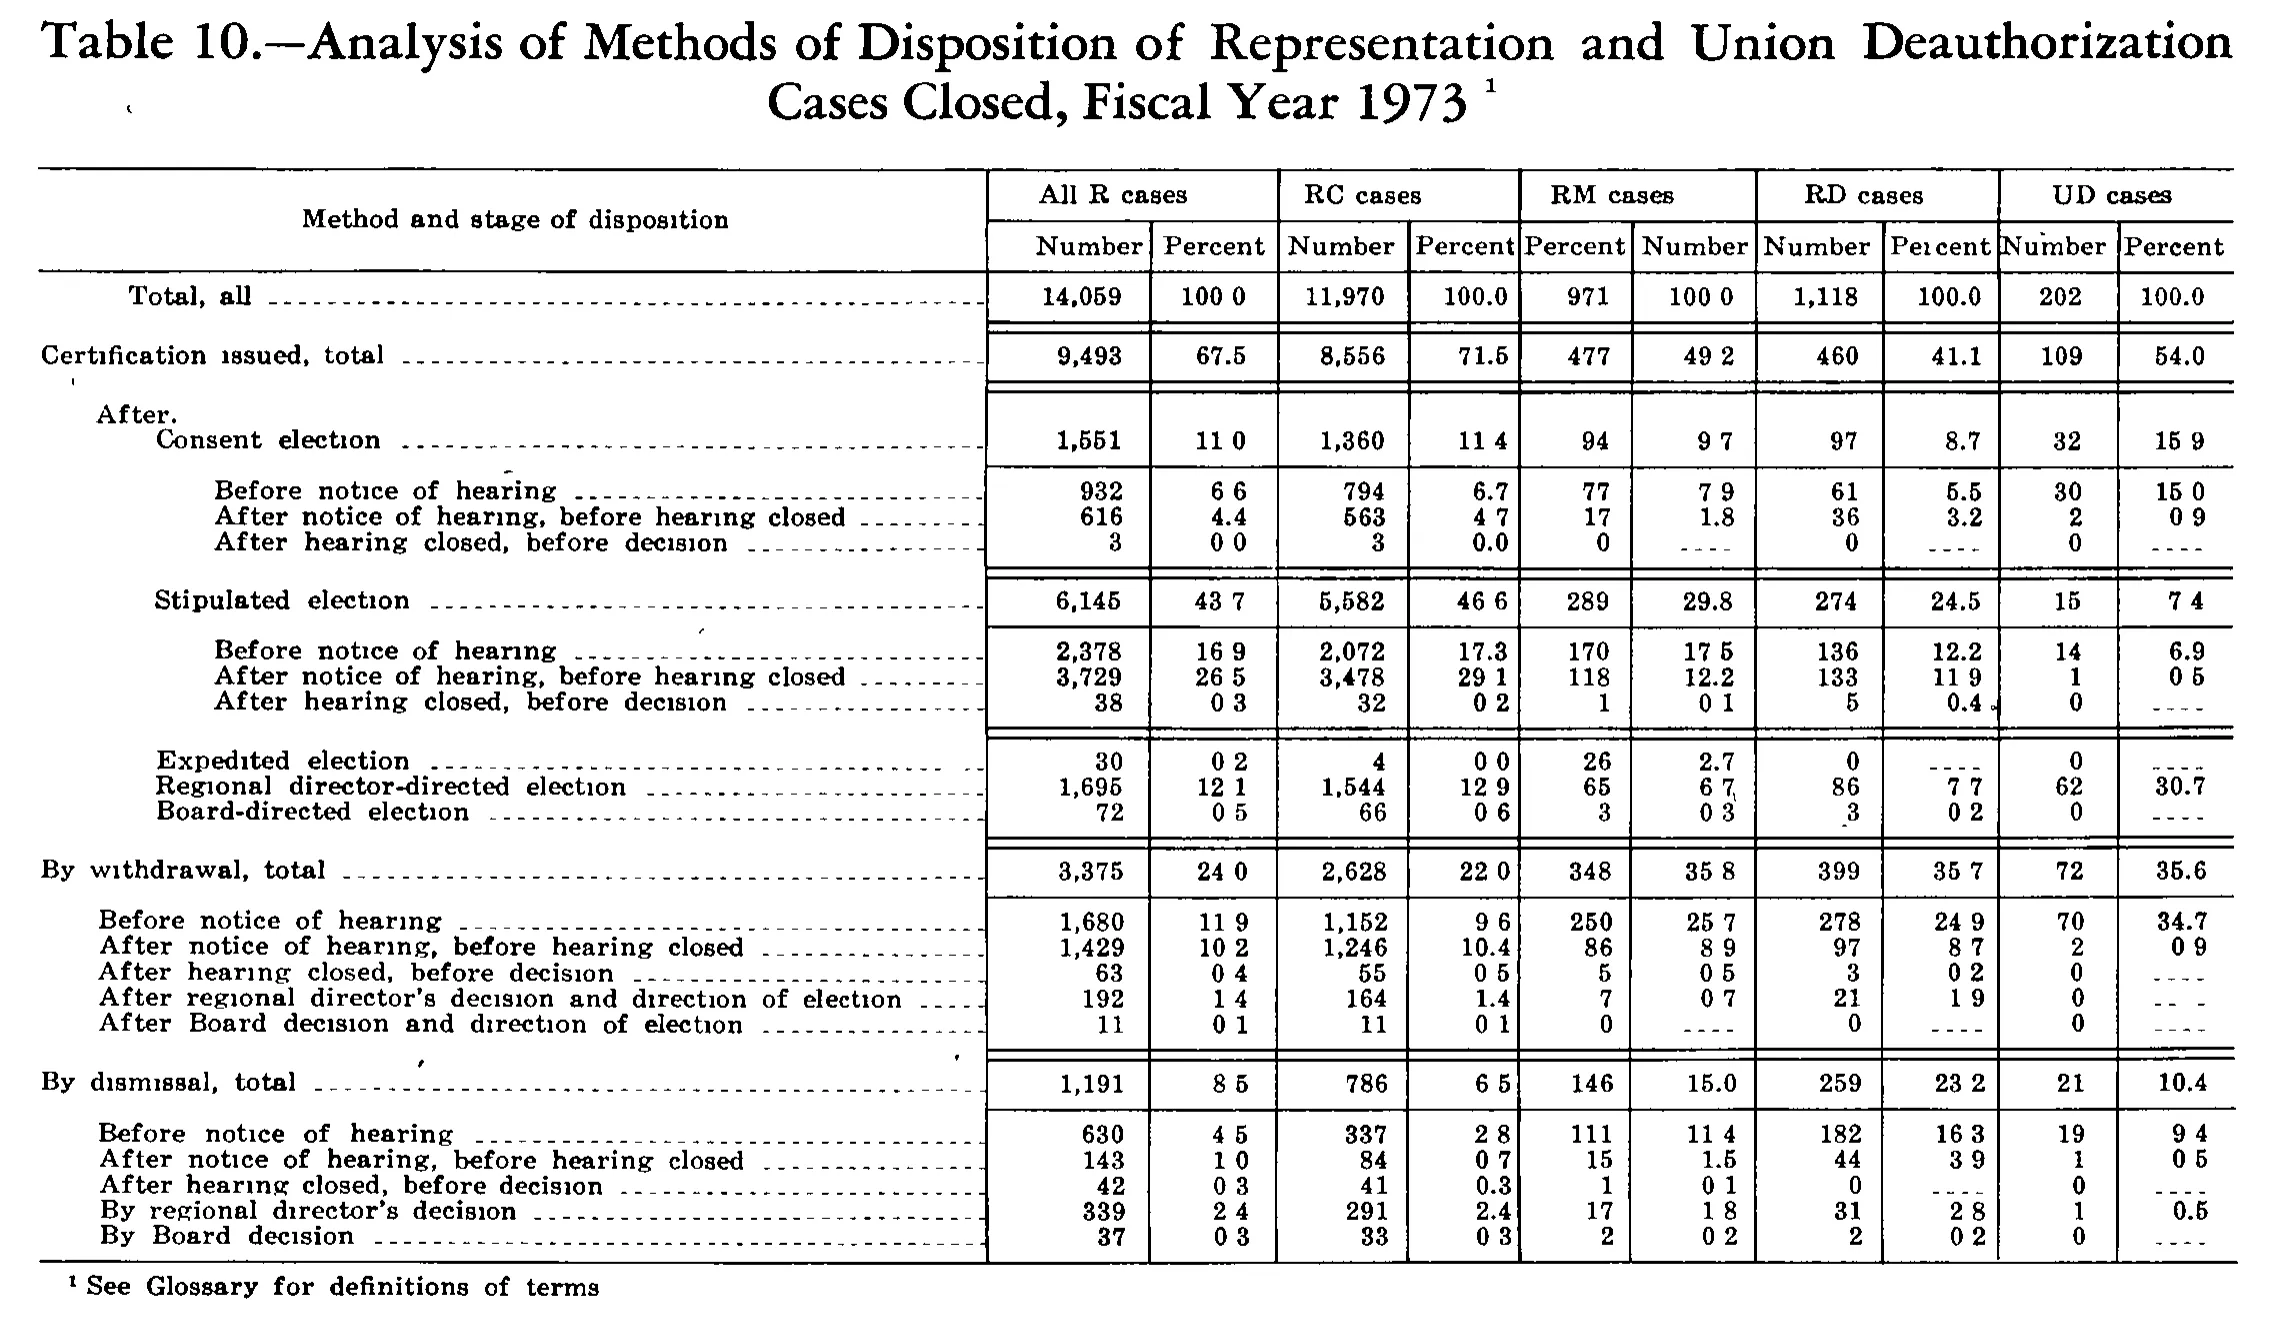
Analysis of Methods of Disposition of Representation and Union Deauthorization Cases Closed, Fiscal Year 1973
| Method and stage of disposition | All R cases | RC cases | RM cases | RD cases | UD cases | |||||
|---|---|---|---|---|---|---|---|---|---|---|
| Method and stage of disposition | Number | Percent | Number | Percent | Percent | Number | Number | Percent | Number | Percent |
| Total, all | 14,059 | 100.0 | 11,970 | 100.0 | 971 | 100.0 | 1,118 | 100.0 | 202 | 100.0 |
| Certification issued, total | 9,493 | 67.5 | 8,556 | 71.5 | 477 | 49.2 | 460 | 41.1 | 109 | 54.0 |
| After. | ||||||||||
| Consent election | 1,551 | 11.0 | 1,360 | 11.4 | 94 | 9.7 | 97 | 8.7 | 32 | 15.9 |
| Before notice of hearing | 932 | 6.6 | 794 | 6.7 | 77 | 7.9 | 61 | 5.5 | 30 | 15.0 |
| After notice of hearing, before hearing closed | 616 | 4.4 | 563 | 4.7 | 17 | 1.8 | 36 | 3.2 | 2 | 0.9 |
| After hearing closed, before decision | 3 | 0.0 | 3 | 0.0 | 0 | 0 | 0 | |||
| Stipulated election | 6,145 | 43.7 | 5,582 | 46.6 | 289 | 29.8 | 274 | 24.5 | 15 | 7.4 |
| Before notice of hearing | 2,378 | 16.9 | 2,072 | 17.3 | 170 | 17.5 | 136 | 12.2 | 14 | 6.9 |
| After notice of hearing, before hearing closed | 3,729 | 26.5 | 3,478 | 29.1 | 118 | 12.2 | 133 | 11.9 | 1 | 0.5 |
| After hearing closed, before decision | 38 | 0.3 | 32 | 0.2 | 1 | 0.1 | 5 | 0.4 | 0 | |
| Expedited election | 30 | 0.2 | 4 | 0.0 | 26 | 2.7 | 0 | 0 | ||
| Regional director-directed election | 1,695 | 12.1 | 1,544 | 12.9 | 65 | 6.7 | 86 | 7.7 | 62 | 30.7 |
| Board-directed election | 72 | 0.5 | 66 | 0.6 | 3 | 0.3 | 3 | 0.2 | 0 | |
| By withdrawal, total | 3,375 | 24.0 | 2,628 | 22.0 | 348 | 35.8 | 399 | 35.7 | 72 | 35.6 |
| Before notice of hearing | 1,680 | 11.9 | 1,152 | 9.6 | 250 | 25.7 | 278 | 24.9 | 70 | 34.7 |
| After notice of hearing, before hearing closed | 1,429 | 10.2 | 1,246 | 10.4 | 86 | 8.9 | 97 | 8.7 | 2 | 0.9 |
| After hearing closed, before decision | 63 | 0.4 | 55 | 0.5 | 5 | 0.5 | 3 | 0.2 | 0 | |
| After regional director's decision and direction of election | 192 | 1.4 | 164 | 1.4 | 7 | 0.7 | 21 | 1.9 | 0 | |
| After Board decision and direction of election | 11 | 0.1 | 11 | 0.1 | 0 | 0 | 0 | |||
| By dismissal, total | 1,191 | 8.5 | 786 | 6.5 | 146 | 15.0 | 259 | 23.2 | 21 | 10.4 |
| Before notice of hearing | 630 | 4.5 | 337 | 2.8 | 111 | 11.4 | 182 | 16.3 | 19 | 9.4 |
| After notice of hearing, before hearing closed | 143 | 1.0 | 84 | 0.7 | 15 | 1.5 | 44 | 3.9 | 1 | 0.5 |
| After hearing closed, before decision | 42 | 0.3 | 41 | 0.3 | 1 | 0.1 | 0 | 0 | ||
| By regional director's decision | 339 | 2.4 | 291 | 2.4 | 17 | 1.8 | 31 | 2.8 | 1 | 0.5 |
| By Board decision | 37 | 0.3 | 33 | 0.3 | 2 | 0.2 | 2 | 0.2 | 0 | |
- 1 See Glossary for definitions of terms.
87 of 87 figures sit in a row or column sum that works out.
Reader’s notes
p. 236. COLUMN COUNT: 11 = stub + five two-column panels (All R, RC, RM, RD, UD), each Number/Percent. The table is a single panel set, not side-by-side panels. HEADING ANOMALY (most important caveat): under the "RM cases" spanner the two sub-headings appear printed in the order "Percent" then "Number", reversed relative to the other four panels, which all read "Number" then "Percent". The data beneath them are plainly Number then Percent (Total, all = 971 then 100.0; 477 then 49.2; etc.), matching the other panels, so this looks like a typesetting error in the original. I have transcribed the headings as printed rather than silently reordering them. Because the scan is 1-bit and the words are small, there is some chance this is a misreading of the scan rather than a genuine misprint; a user who needs the headings verbatim should re-check that cell. Column placement of the RM *values* is not in doubt. DECIMAL POINTS RESTORED: this scan drops many faint periods. Numerous percent cells render as e.g. "100 0", "11 0", "49 2", "35 8" with a gap where the decimal point should be, while neighbouring cells in the same column show the point clearly ("100.0", "67.5", "41.1"). Every percent in this table is a one-decimal figure, which I confirmed by recomputing against the column totals (e.g. UD: 62/202 = 30.7, 109/202 = 54.0; All R: 9,493/14,059 = 67.5). I have therefore written the decimal point in every percent cell. No digits were altered, added or recomputed. ARITHMETIC VERIFICATION: all panel subtotals and grand totals reconcile exactly as printed - e.g. All R 9,493 + 3,375 + 1,191 = 14,059; RC consent 794 + 563 + 3 = 1,360; RC total 8,556 + 2,628 + 786 = 11,970; RM 477 + 348 + 146 = 971; RD 460 + 399 + 259 = 1,118; UD 109 + 72 + 21 = 202. This is strong independent evidence that the digits and their column assignments are right. SUSPECTED PRINTED ROUNDING SLIP: RC cases, row "Before notice of hearing" under "Consent election", Percent column reads 6.7, but 794/11,970 = 6.63, i.e. 6.6 (the parallel All R cell prints 6.6 for 932/14,059 = 6.63). Transcribed as printed. A few other percent cells round down where one would expect up (RC "After hearing closed, before decision" under Stipulated prints 0.2 for 0.27; RD "Board-directed election" prints 0.2 for 0.27); these are left exactly as printed. ROW LABEL DOUBT: the section line transcribed as "After." may be printed "After:" - only a single baseline mark is legible and the upper dot of a colon would be the kind of fine detail this scan loses. It is a label-only line; its value cells are empty in the original. OTHER: the "Percent" heading over RD cases renders as "Peicent" in the scan (broken "r"); transcribed as "Percent". Cells printed as a dash rule ("----") are given as "". Printed zeros are kept as "0". Leader dots after row labels dropped. Caption and the footnote reference mark in the caption omitted per instructions. Nothing appears cut off by the crop; the table is complete from heading to footnote.
Source image
Source data: U.S. NLRB Annual Reports (public domain). Reconstruction by NLRB Stats Archive. Read by claude-opus-5 (effort max, prompt extract_v1) from the 300-dpi scan; stitched by page. Updated October 2026.