NLRB Stats Archive › Annual Reports › FY1973 › Geographic Distribution of Cases Received, Fiscal Year 1973
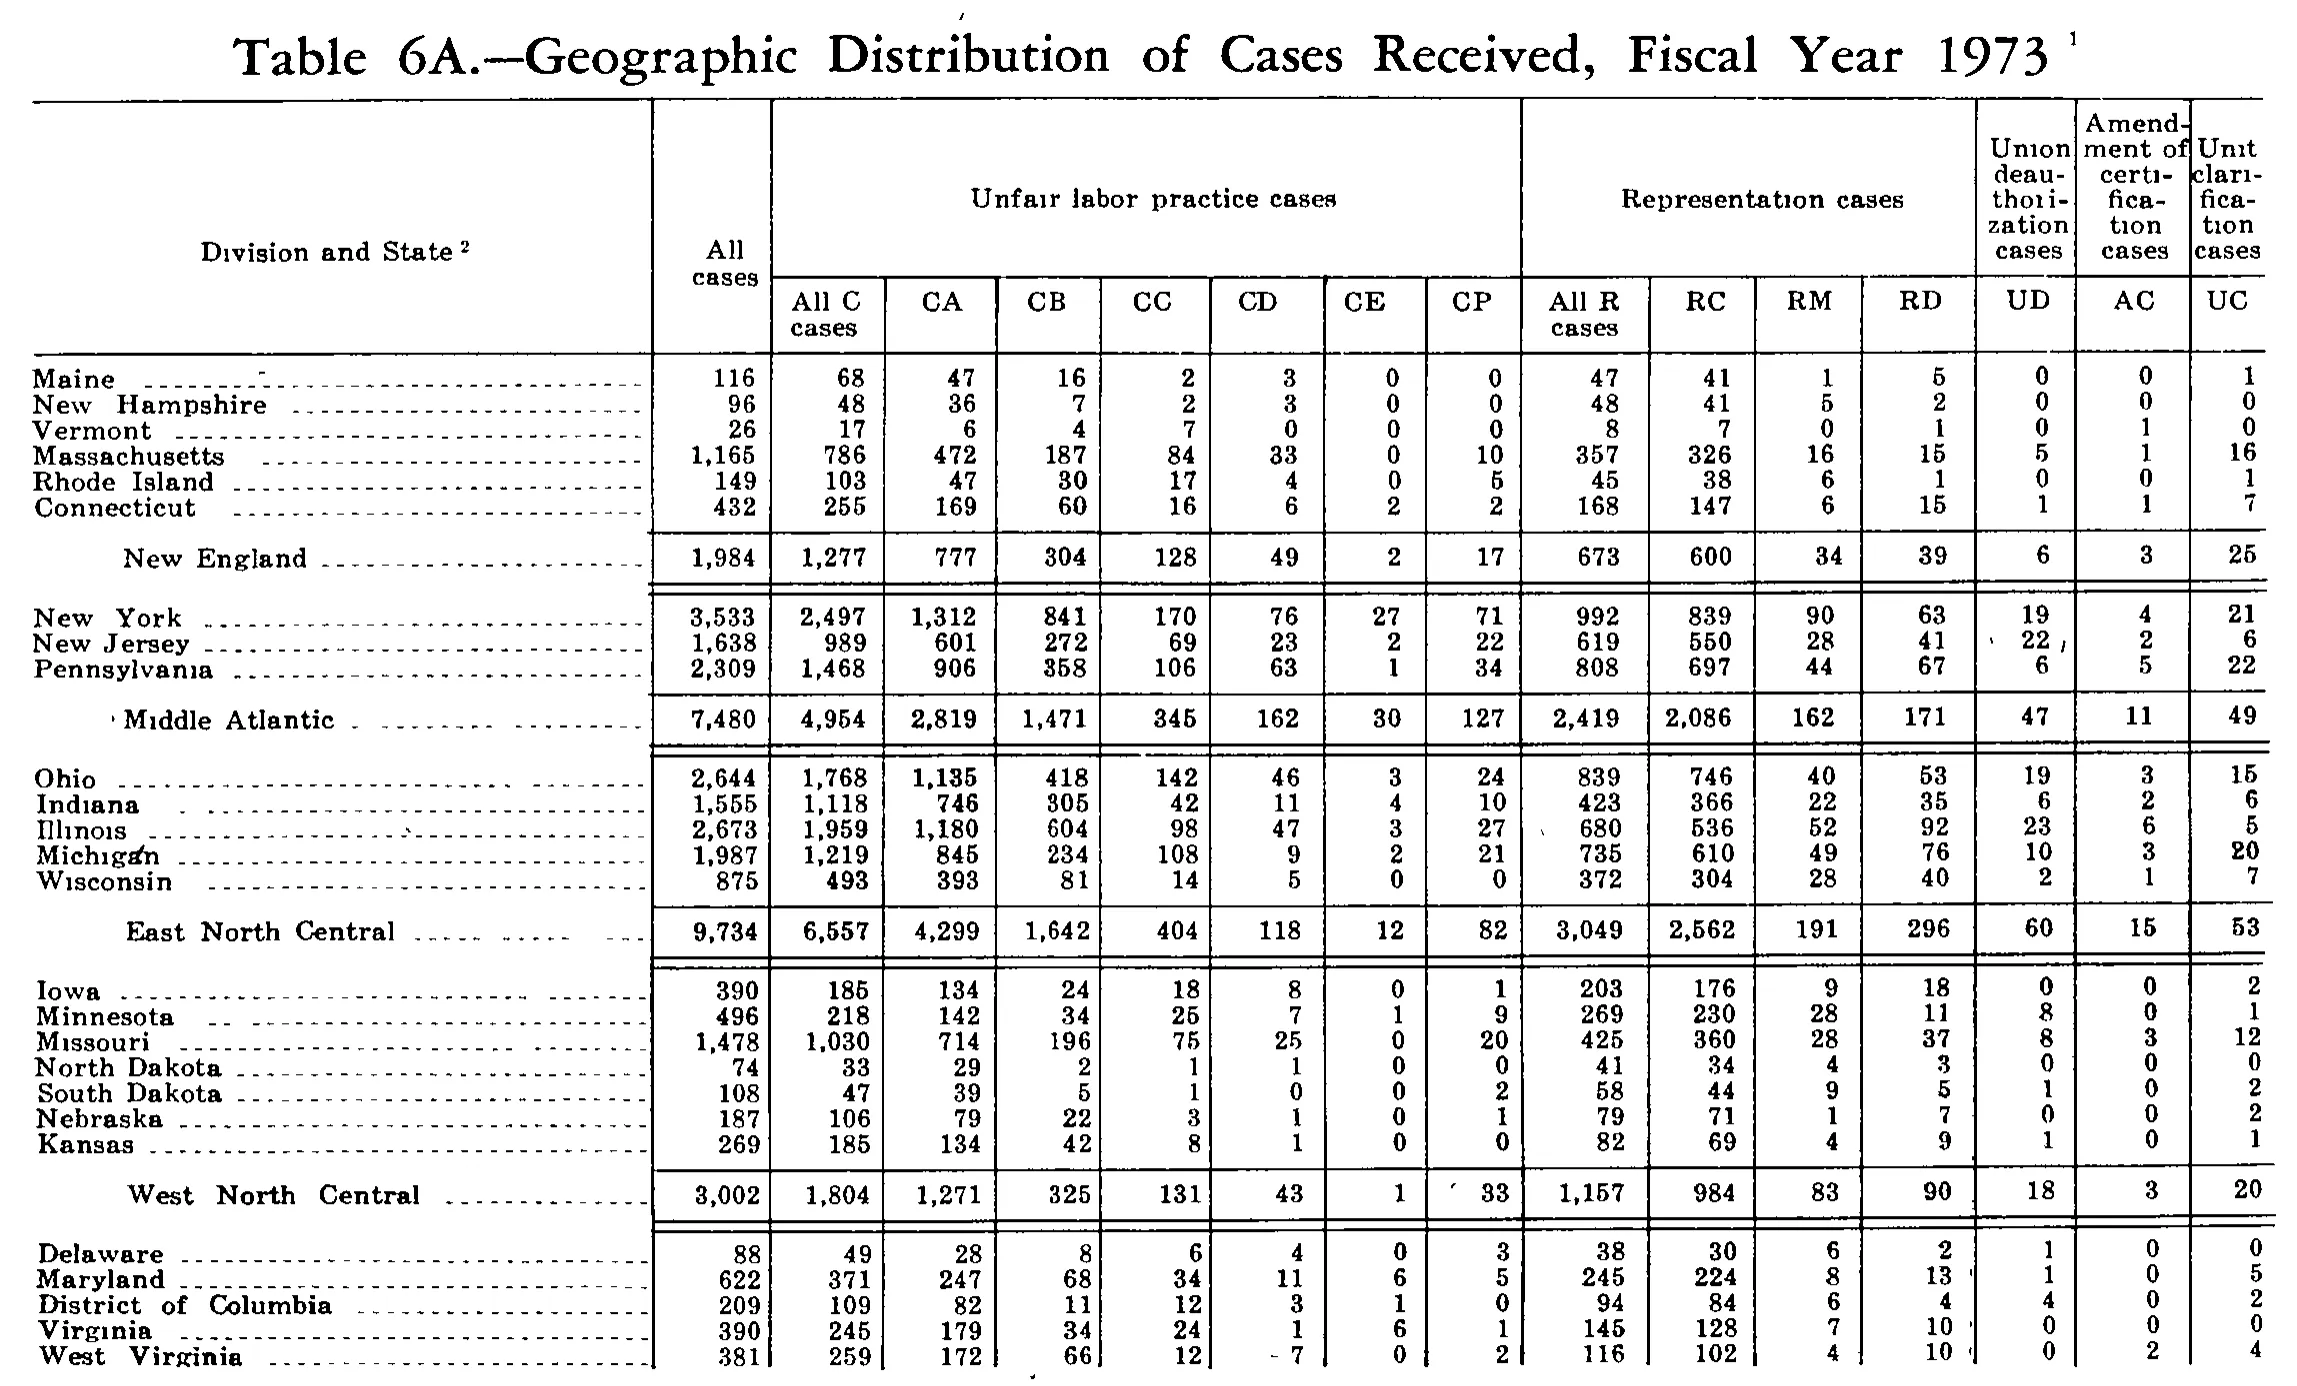
Geographic Distribution of Cases Received, Fiscal Year 1973
Stitched from pp. 227–228.
| Division and State | All cases | Unfair labor practice cases | Representation cases | Union deauthorization cases | Amendment of certification cases | Unit clarification cases | |||||||||
|---|---|---|---|---|---|---|---|---|---|---|---|---|---|---|---|
| Division and State | All cases | All C cases | CA | CB | CC | CD | CE | CP | All R cases | RC | RM | RD | UD | AC | UC |
| Maine | 116 | 68 | 47 | 16 | 2 | 3 | 0 | 0 | 47 | 41 | 1 | 5 | 0 | 0 | 1 |
| New Hampshire | 96 | 48 | 36 | 7 | 2 | 3 | 0 | 0 | 48 | 41 | 5 | 2 | 0 | 0 | 0 |
| Vermont | 26 | 17 | 6 | 4 | 7 | 0 | 0 | 0 | 8 | 7 | 0 | 1 | 0 | 1 | 0 |
| Massachusetts | 1,165 | 786 | 472 | 187 | 84 | 33 | 0 | 10 | 357 | 326 | 16 | 15 | 5 | 1 | 16 |
| Rhode Island | 149 | 103 | 47 | 30 | 17 | 4 | 0 | 5 | 45 | 38 | 6 | 1 | 0 | 0 | 1 |
| Connecticut | 432 | 255 | 169 | 60 | 16 | 6 | 2 | 2 | 168 | 147 | 6 | 15 | 1 | 1 | 7 |
| New England | 1,984 | 1,277 | 777 | 304 | 128 | 49 | 2 | 17 | 673 | 600 | 34 | 39 | 6 | 3 | 25 |
| New York | 3,533 | 2,497 | 1,312 | 841 | 170 | 76 | 27 | 71 | 992 | 839 | 90 | 63 | 19 | 4 | 21 |
| New Jersey | 1,638 | 989 | 601 | 272 | 69 | 23 | 2 | 22 | 619 | 550 | 28 | 41 | 22 | 2 | 6 |
| Pennsylvania | 2,309 | 1,468 | 906 | 358 | 106 | 63 | 1 | 34 | 808 | 697 | 44 | 67 | 6 | 5 | 22 |
| Middle Atlantic | 7,480 | 4,954 | 2,819 | 1,471 | 345 | 162 | 30 | 127 | 2,419 | 2,086 | 162 | 171 | 47 | 11 | 49 |
| Ohio | 2,644 | 1,768 | 1,135 | 418 | 142 | 46 | 3 | 24 | 839 | 746 | 40 | 53 | 19 | 3 | 15 |
| Indiana | 1,555 | 1,118 | 746 | 305 | 42 | 11 | 4 | 10 | 423 | 366 | 22 | 35 | 6 | 2 | 6 |
| Illinois | 2,673 | 1,959 | 1,180 | 604 | 98 | 47 | 3 | 27 | 680 | 536 | 52 | 92 | 23 | 6 | 5 |
| Michigan | 1,987 | 1,219 | 845 | 234 | 108 | 9 | 2 | 21 | 735 | 610 | 49 | 76 | 10 | 3 | 20 |
| Wisconsin | 875 | 493 | 393 | 81 | 14 | 5 | 0 | 0 | 372 | 304 | 28 | 40 | 2 | 1 | 7 |
| East North Central | 9,734 | 6,557 | 4,299 | 1,642 | 404 | 118 | 12 | 82 | 3,049 | 2,562 | 191 | 296 | 60 | 15 | 53 |
| Iowa | 390 | 185 | 134 | 24 | 18 | 8 | 0 | 1 | 203 | 176 | 9 | 18 | 0 | 0 | 2 |
| Minnesota | 496 | 218 | 142 | 34 | 25 | 7 | 1 | 9 | 269 | 230 | 28 | 11 | 8 | 0 | 1 |
| Missouri | 1,478 | 1,030 | 714 | 196 | 75 | 25 | 0 | 20 | 425 | 360 | 28 | 37 | 8 | 3 | 12 |
| North Dakota | 74 | 33 | 29 | 2 | 1 | 1 | 0 | 0 | 41 | 34 | 4 | 3 | 0 | 0 | 0 |
| South Dakota | 108 | 47 | 39 | 5 | 1 | 0 | 0 | 2 | 58 | 44 | 9 | 5 | 1 | 0 | 2 |
| Nebraska | 187 | 106 | 79 | 22 | 3 | 1 | 0 | 1 | 79 | 71 | 1 | 7 | 0 | 0 | 2 |
| Kansas | 269 | 185 | 134 | 42 | 8 | 1 | 0 | 0 | 82 | 69 | 4 | 9 | 1 | 0 | 1 |
| West North Central | 3,002 | 1,804 | 1,271 | 325 | 131 | 43 | 1 | 33 | 1,157 | 984 | 83 | 90 | 18 | 3 | 20 |
| Delaware | 88 | 49 | 28 | 8 | 6 | 4 | 0 | 3 | 38 | 30 | 6 | 2 | 1 | 0 | 0 |
| Maryland | 622 | 371 | 247 | 68 | 34 | 11 | 6 | 5 | 245 | 224 | 8 | 13 | 1 | 0 | 5 |
| District of Columbia | 209 | 109 | 82 | 11 | 12 | 3 | 1 | 0 | 94 | 84 | 6 | 4 | 4 | 0 | 2 |
| Virginia | 390 | 245 | 179 | 34 | 24 | 1 | 6 | 1 | 145 | 128 | 7 | 10 | 0 | 0 | 0 |
| West Virginia | 381 | 259 | 172 | 66 | 12 | 7 | 0 | 2 | 116 | 102 | 4 | 10 | 0 | 2 | 4 |
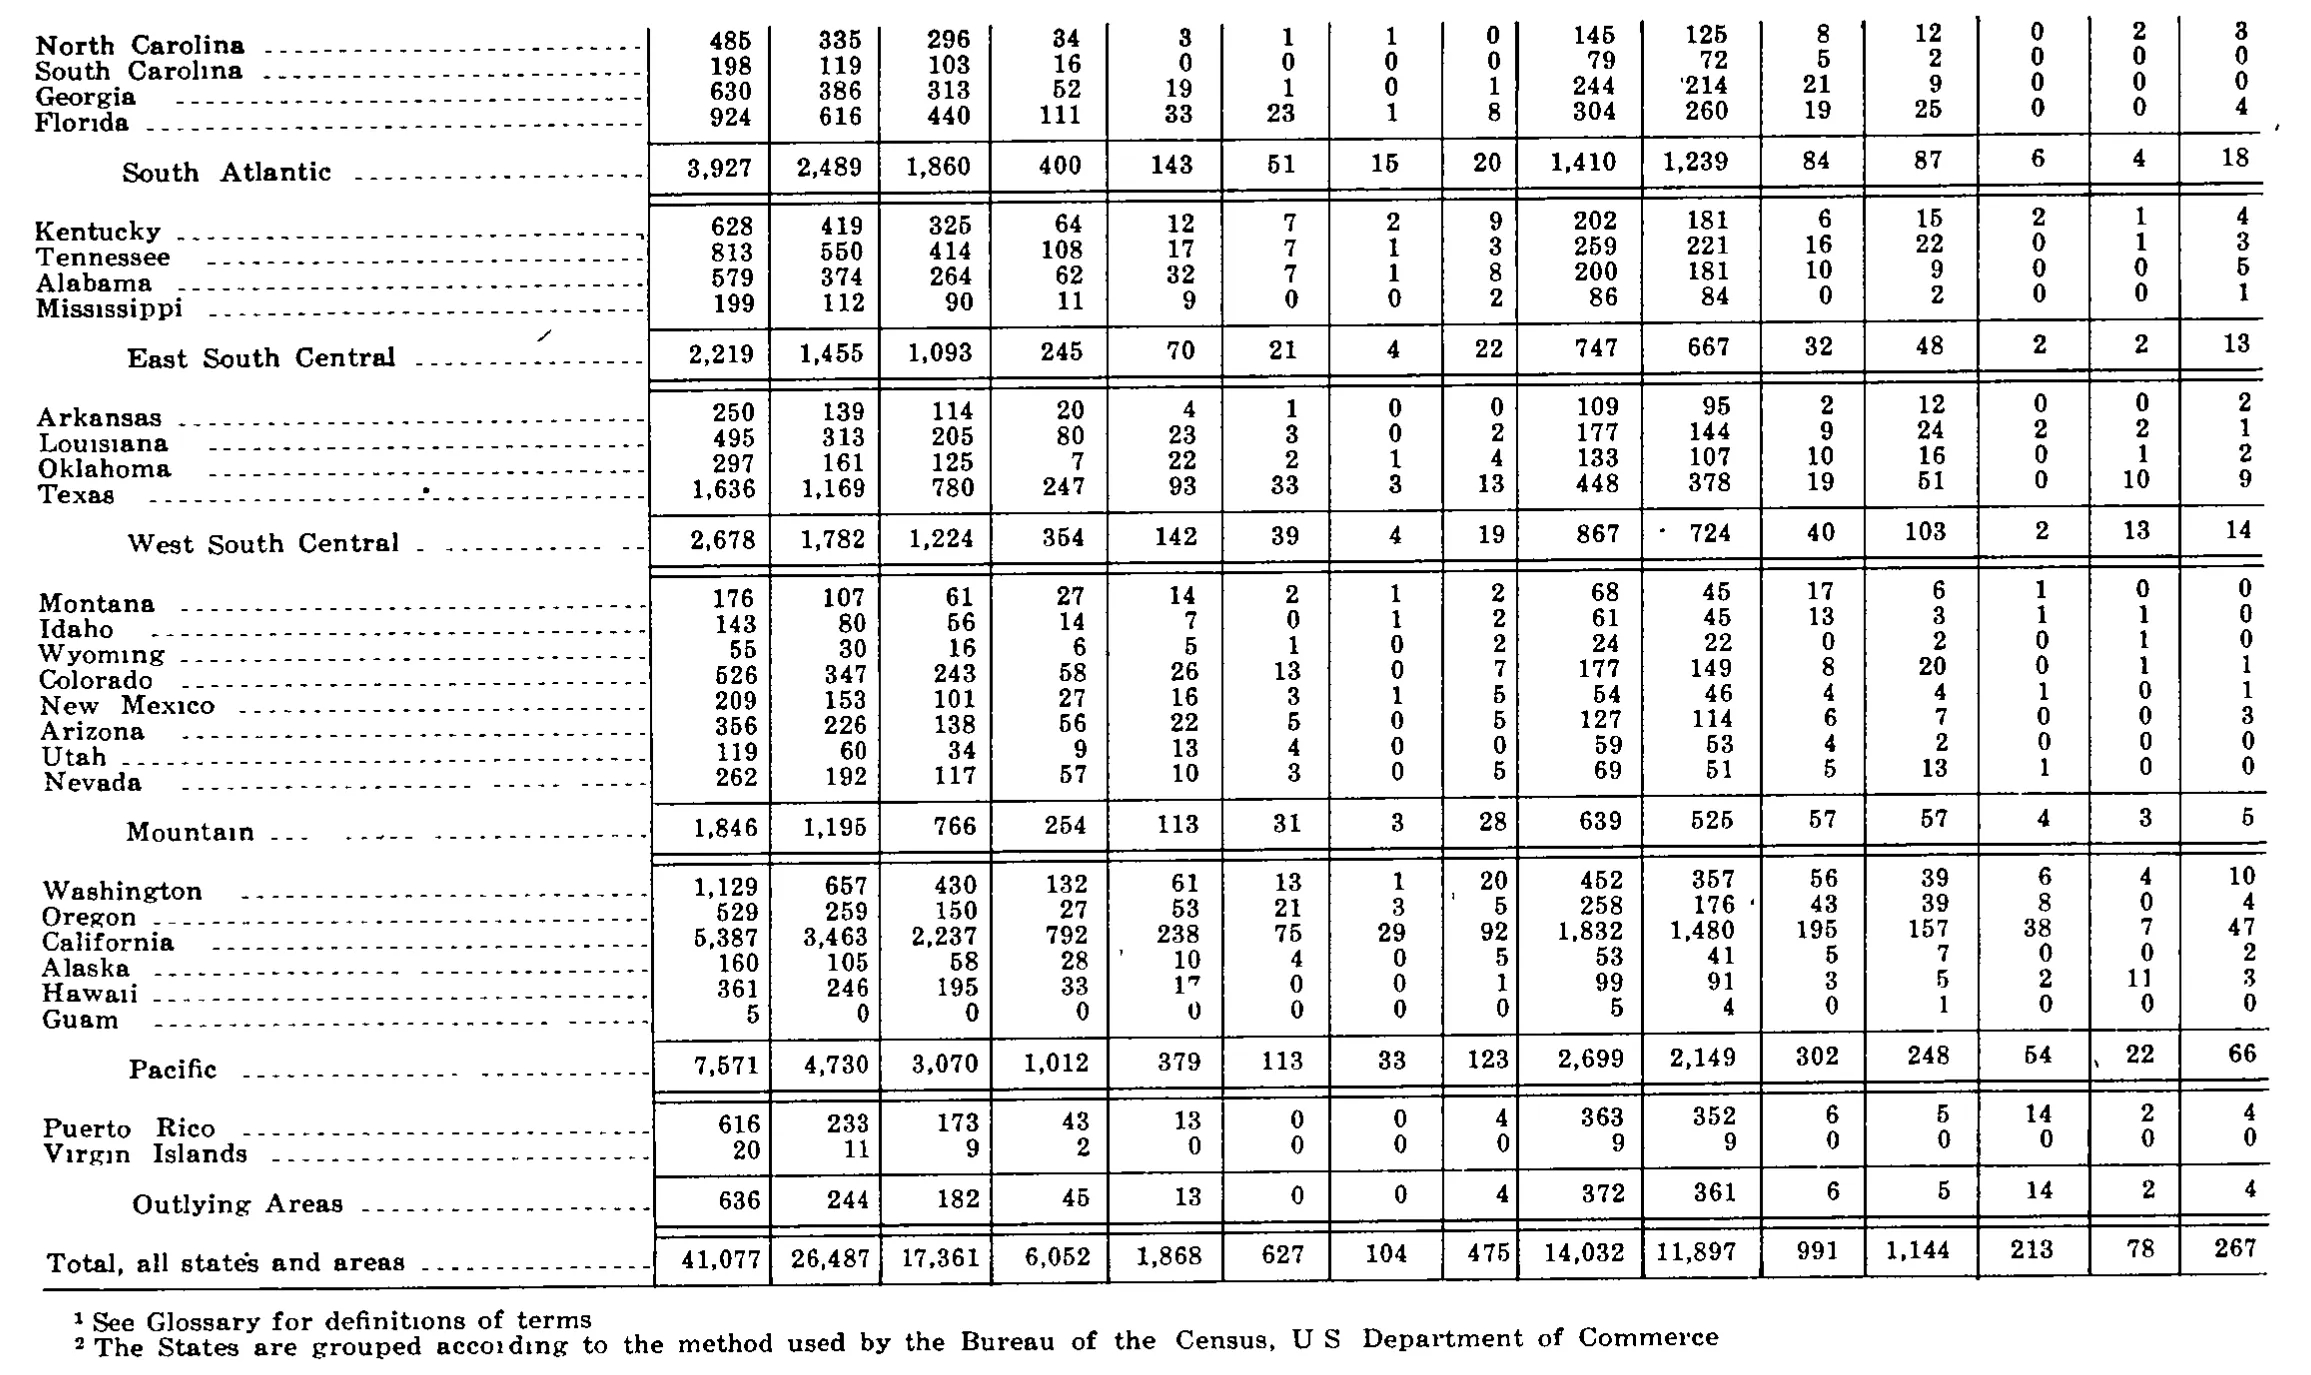
| North Carolina | 485 | 335 | 296 | 34 | 3 | 1 | 1 | 0 | 145 | 125 | 8 | 12 | 0 | 2 | 3 |
| South Carolina | 198 | 119 | 103 | 16 | 0 | 0 | 0 | 0 | 79 | 72 | 5 | 2 | 0 | 0 | 0 |
| Georgia | 630 | 386 | 313 | 52 | 19 | 1 | 0 | 1 | 244 | 214 | 21 | 9 | 0 | 0 | 0 |
| Florida | 924 | 616 | 440 | 111 | 33 | 23 | 1 | 8 | 304 | 260 | 19 | 25 | 0 | 0 | 4 |
| South Atlantic | 3,927 | 2,489 | 1,860 | 400 | 143 | 51 | 15 | 20 | 1,410 | 1,239 | 84 | 87 | 6 | 4 | 18 |
| Kentucky | 628 | 419 | 325 | 64 | 12 | 7 | 2 | 9 | 202 | 181 | 6 | 15 | 2 | 1 | 4 |
| Tennessee | 813 | 550 | 414 | 108 | 17 | 7 | 1 | 3 | 259 | 221 | 16 | 22 | 0 | 1 | 3 |
| Alabama | 579 | 374 | 264 | 62 | 32 | 7 | 1 | 8 | 200 | 181 | 10 | 9 | 0 | 0 | 5 |
| Mississippi | 199 | 112 | 90 | 11 | 9 | 0 | 0 | 2 | 86 | 84 | 0 | 2 | 0 | 0 | 1 |
| East South Central | 2,219 | 1,455 | 1,093 | 245 | 70 | 21 | 4 | 22 | 747 | 667 | 32 | 48 | 2 | 2 | 13 |
| Arkansas | 250 | 139 | 114 | 20 | 4 | 1 | 0 | 0 | 109 | 95 | 2 | 12 | 0 | 0 | 2 |
| Louisiana | 495 | 313 | 205 | 80 | 23 | 3 | 0 | 2 | 177 | 144 | 9 | 24 | 2 | 2 | 1 |
| Oklahoma | 297 | 161 | 125 | 7 | 22 | 2 | 1 | 4 | 133 | 107 | 10 | 16 | 0 | 1 | 2 |
| Texas | 1,636 | 1,169 | 780 | 247 | 93 | 33 | 3 | 13 | 448 | 378 | 19 | 51 | 0 | 10 | 9 |
| West South Central | 2,678 | 1,782 | 1,224 | 354 | 142 | 39 | 4 | 19 | 867 | 724 | 40 | 103 | 2 | 13 | 14 |
| Montana | 176 | 107 | 61 | 27 | 14 | 2 | 1 | 2 | 68 | 45 | 17 | 6 | 1 | 0 | 0 |
| Idaho | 143 | 80 | 56 | 14 | 7 | 0 | 1 | 2 | 61 | 45 | 13 | 3 | 1 | 1 | 0 |
| Wyoming | 55 | 30 | 16 | 6 | 5 | 1 | 0 | 2 | 24 | 22 | 0 | 2 | 0 | 1 | 0 |
| Colorado | 526 | 347 | 243 | 58 | 26 | 13 | 0 | 7 | 177 | 149 | 8 | 20 | 0 | 1 | 1 |
| New Mexico | 209 | 153 | 101 | 27 | 16 | 3 | 1 | 5 | 54 | 46 | 4 | 4 | 1 | 0 | 3 |
| Arizona | 356 | 226 | 138 | 56 | 22 | 5 | 0 | 5 | 127 | 114 | 6 | 7 | 0 | 0 | 1 |
| Utah | 119 | 60 | 34 | 9 | 13 | 4 | 0 | 0 | 59 | 53 | 4 | 2 | 0 | 0 | 0 |
| Nevada | 262 | 192 | 117 | 57 | 10 | 3 | 0 | 5 | 69 | 51 | 5 | 13 | 1 | 0 | 0 |
| Mountain | 1,846 | 1,195 | 766 | 254 | 113 | 31 | 3 | 28 | 639 | 525 | 57 | 57 | 4 | 3 | 5 |
| Washington | 1,129 | 657 | 430 | 132 | 61 | 13 | 1 | 20 | 452 | 357 | 56 | 39 | 6 | 4 | 10 |
| Oregon | 529 | 259 | 150 | 27 | 53 | 21 | 3 | 5 | 258 | 176 | 43 | 39 | 8 | 0 | 4 |
| California | 5,387 | 3,463 | 2,237 | 792 | 238 | 75 | 29 | 92 | 1,832 | 1,480 | 195 | 157 | 38 | 7 | 47 |
| Alaska | 160 | 105 | 58 | 28 | 10 | 4 | 0 | 5 | 53 | 41 | 5 | 7 | 0 | 0 | 2 |
| Hawaii | 361 | 246 | 195 | 33 | 17 | 0 | 0 | 1 | 99 | 91 | 3 | 5 | 2 | 11 | 3 |
| Guam | 5 | 0 | 0 | 0 | 0 | 0 | 0 | 0 | 5 | 4 | 0 | 1 | 0 | 0 | 0 |
| Pacific | 7,571 | 4,730 | 3,070 | 1,012 | 379 | 113 | 33 | 123 | 2,699 | 2,149 | 302 | 248 | 54 | 22 | 66 |
| Puerto Rico | 616 | 233 | 173 | 43 | 13 | 0 | 0 | 4 | 363 | 352 | 6 | 5 | 14 | 2 | 4 |
| Virgin Islands | 20 | 11 | 9 | 2 | 0 | 0 | 0 | 0 | 9 | 9 | 0 | 5 | 0 | 0 | 0 |
| Outlying Areas | 636 | 244 | 182 | 45 | 13 | 0 | 0 | 4 | 372 | 361 | 6 | 5 | 14 | 2 | 4 |
| Total, all states and areas | 41,077 | 26,487 | 17,361 | 6,052 | 1,868 | 627 | 104 | 475 | 14,032 | 11,897 | 991 | 1,144 | 213 | 78 | 267 |
- 1 See Glossary for definitions of terms
- 2 The States are grouped according to the method used by the Bureau of the Census, U S Department of Commerce
842 of 843 figures sit in a row or column sum that works out. 4 cells break a sum: 'Virgin Islands', column 10: prints 9, columns 11 to 13 add to 14; 'New Mexico', column 2: prints 209, the subtotals in columns 3 to 16 add to 211; 'Arizona', column 2: prints 356, the subtotals in columns 3 to 16 add to 354; 'Outlying Areas', column 13: prints 5, rows 'Puerto Rico' to 'Virgin Islands' add to 10.
Reader’s notes
p. 227. The crop is cut off at the bottom: the table continues past the West Virginia row (the South Atlantic division subtotal and all later divisions are not on this image), and no footnote block is visible, so `footnotes` is empty even though markers ^1 (in the caption) and ^2 (on the stub heading) are printed. Column-heading wording as printed with end-of-line hyphens: "Union deau-thori-zation cases", "Amendment of certi-fica-tion cases", "Unit clari-fica-tion cases"; joined here. The scan is faint on a few marks: in the West Virginia row the CD cell is printed as "- 7" (a stray dash/speck before the digit); transcribed as 7, which is consistent with the row's own C-case total (172+66+12+7+0+2 = 259). Similarly a stray tick appears beside New Jersey UD (22), Illinois All R (680) and West North Central CP (33); these were read as plain numbers. All row sums (CA..CP = All C cases; All C + All R + UD + AC + UC = All cases) and the column sums for each division subtotal check out, which supports the digit readings.
p. 228. Continuation page: no column headings are printed on this crop, so header_rows is empty. The grid has 16 cells per row (stub + 15 numeric columns), counted from the column rules; the table begins on the preceding page (the South Atlantic group starts there, so only its last four states appear here and its subtotal line covers states not shown). Doubtful cell: "Virgin Islands", column 12 (the column whose Outlying Areas subtotal is 5 and whose grand total is 1,144). The glyph reads as 5 in every pass, but every other column in this crop foots exactly, and here Puerto Rico 5 + Virgin Islands 5 would give 10 against a printed Outlying Areas subtotal of 5; the printed subtotal is consistent with a Virgin Islands value of 0. Transcribed as seen (5), uncorrected — treat this one cell as unreliable. The Virgin Islands entries in the last columns are also the faintest on the page; the rightmost cell (column 15) is recorded as 0 but could be blank in the original. Checked arithmetic: the East South Central, West South Central, Mountain, Pacific and Outlying Areas subtotals reproduce the member rows exactly in all 15 columns (the single exception being the Virgin Islands cell noted above), which supports the column alignment throughout. Scanning specks, not footnote markers or digits, and excluded from the cells: a tick before Georgia's 214 (col 10); a dot before West South Central's 724 (col 10); a mark after Oregon's 176 (col 10); a tick before Washington's 20 (col 8); stray marks in the Texas, California, Alaska and Pacific rows and a pen-like stroke above the East South Central line in the stub area. Guam's column 5 zero and Hawaii's column 5 value (17) are lightly inked but legible. Footnote 2 is printed with scanner-degraded letterforms ("accoiding" for "according"); rendered as the intended word. Abbreviation periods in "U S Department of Commerce" do not resolve in the scan and are transcribed as printed.
Source image
Source data: U.S. NLRB Annual Reports (public domain). Reconstruction by NLRB Stats Archive. Read by claude-opus-5 (effort max, prompt extract_v1) from the 300-dpi scan; stitched by page. Updated October 2026.