NLRB Stats Archive › Annual Reports › FY1973 › Board case backlog
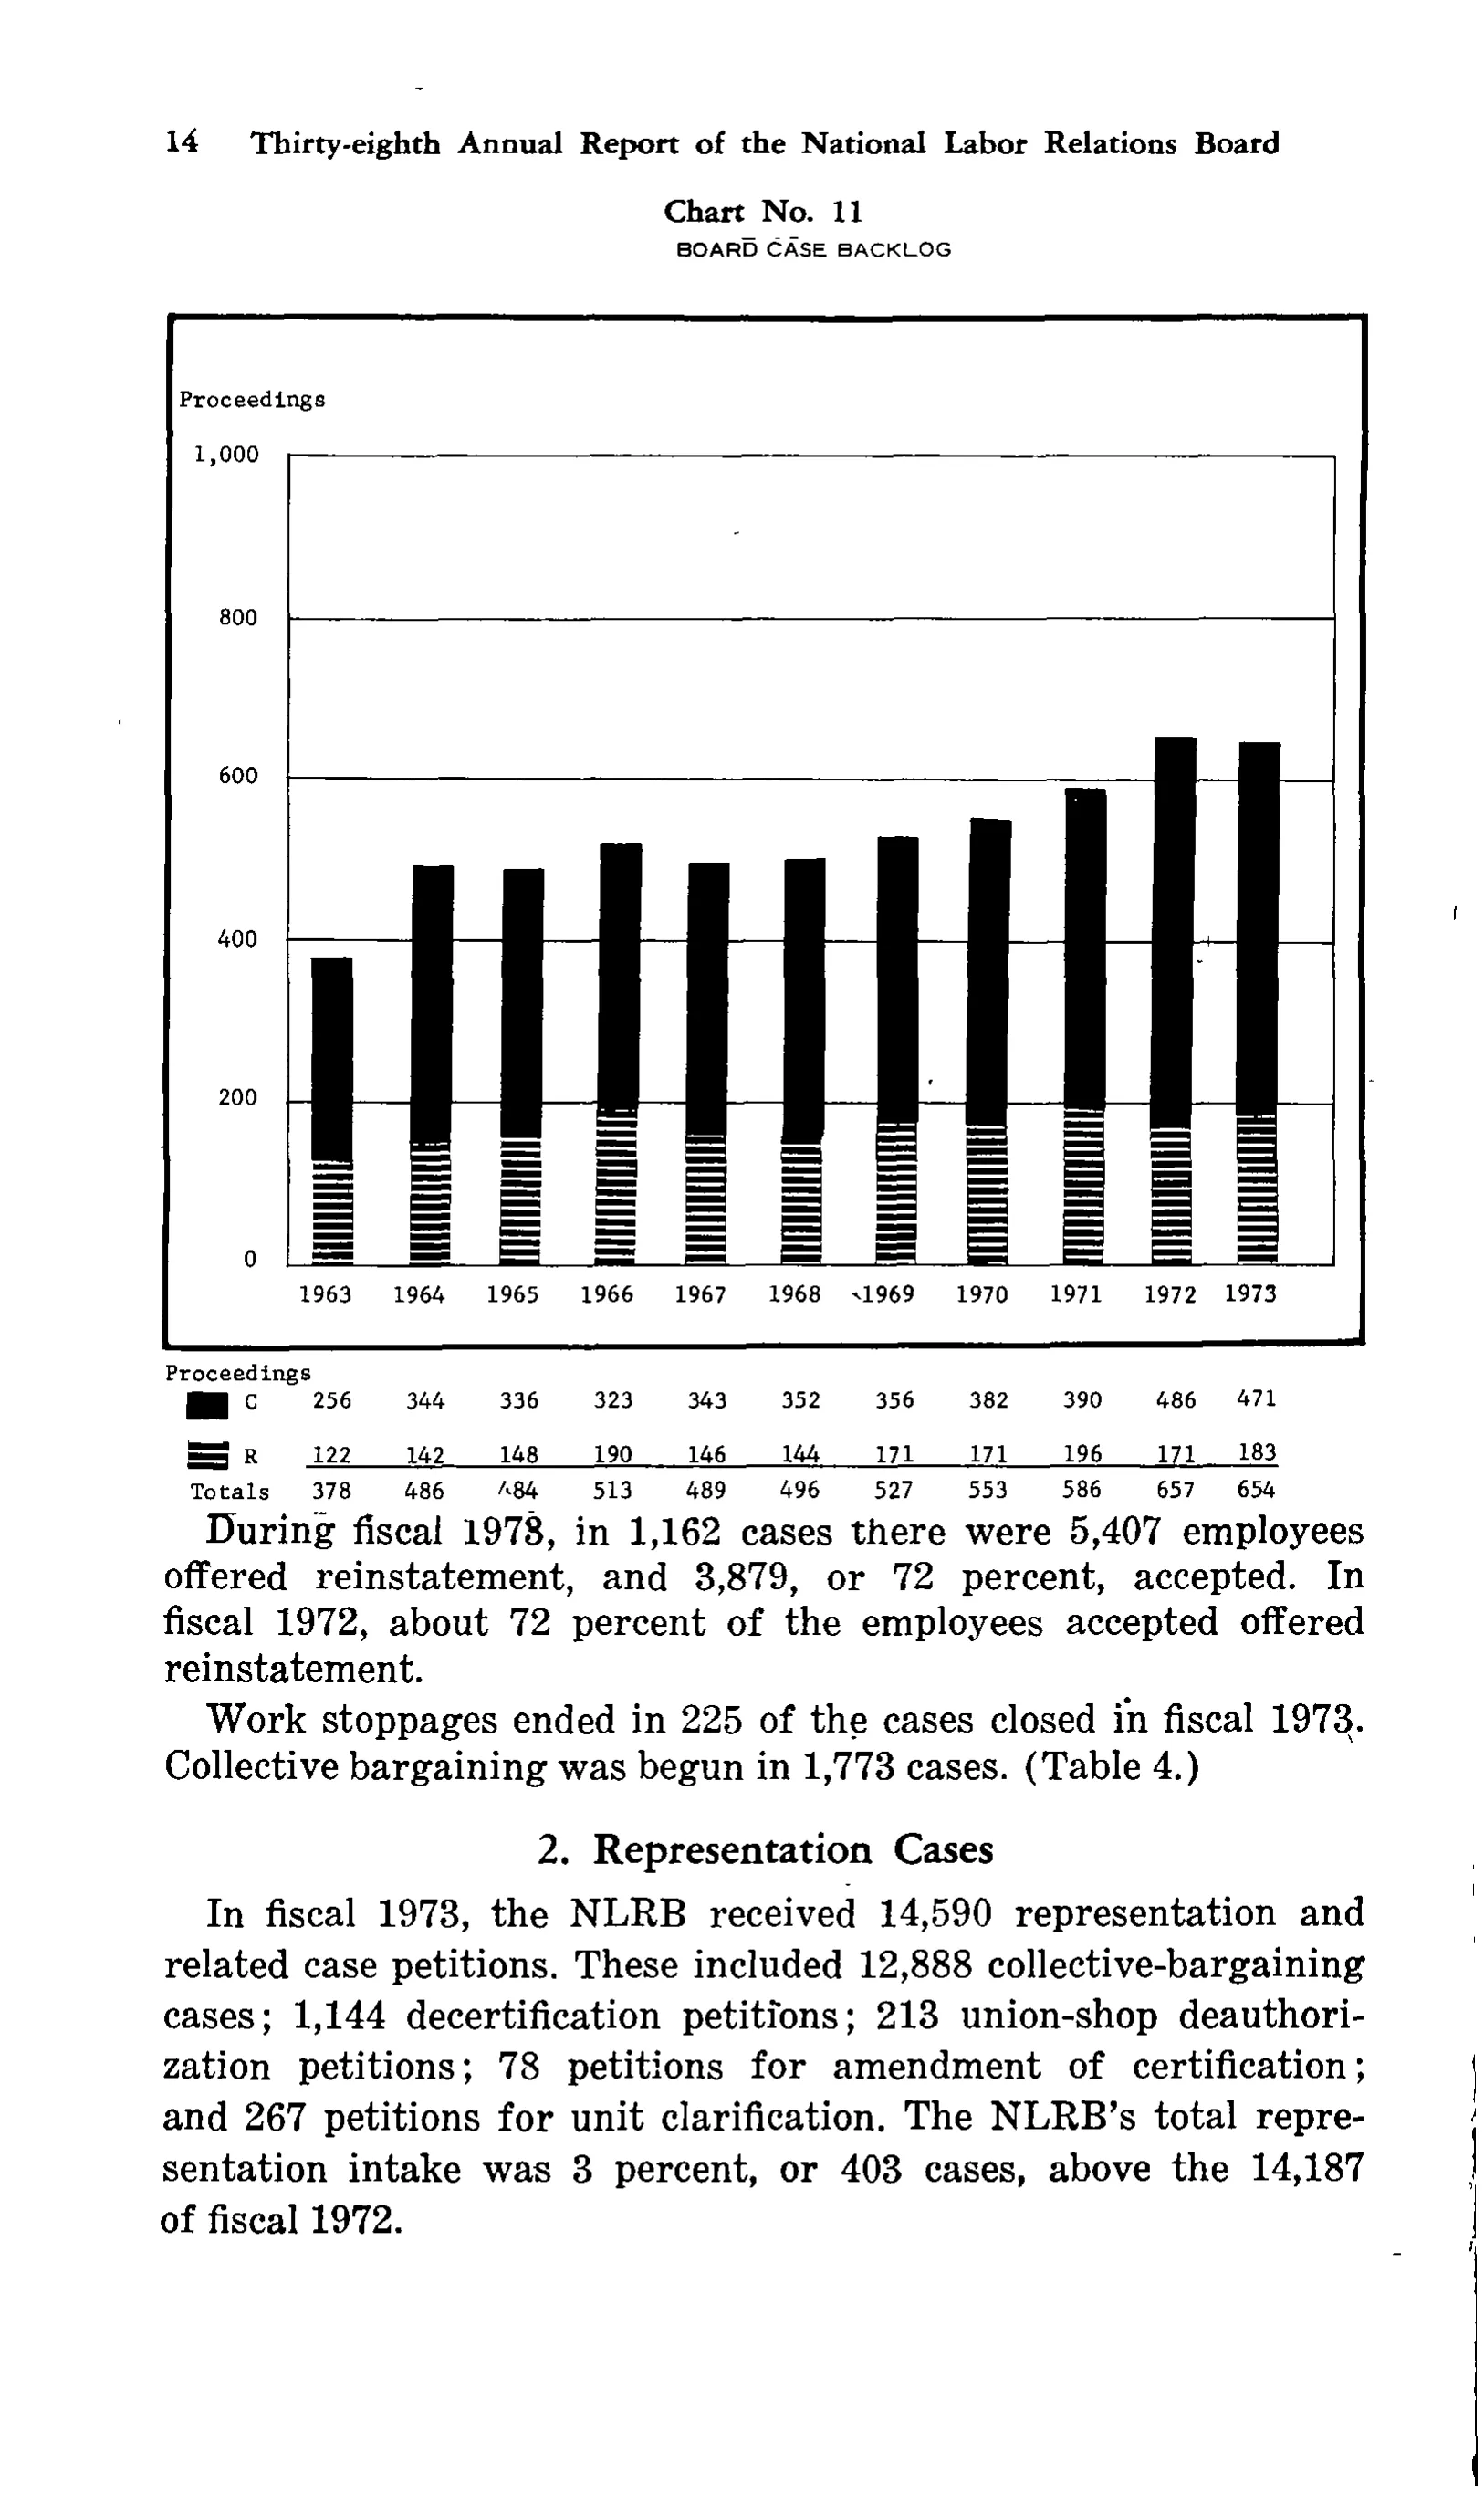
Board case backlog
| Proceedings | 1963 | 1964 | 1965 | 1966 | 1967 | 1968 | 1969 | 1970 | 1971 | 1972 | 1973 |
|---|---|---|---|---|---|---|---|---|---|---|---|
| C | 256 | 344 | 336 | 323 | 343 | 352 | 356 | 382 | 390 | 486 | 471 |
| R | 122 | 142 | 148 | 190 | 146 | 144 | 171 | 171 | 196 | 171 | 183 |
| Totals | 378 | 486 | 484 | 513 | 489 | 496 | 527 | 553 | 586 | 657 | 654 |
33 of 33 figures sit in a row or column sum that works out.
Reader’s notes
p. 27. The crop is a text page whose only tabular matter is the small data block printed under Chart No. 11 ("Board Case Backlog"); the rest of the page is the bar chart itself and running prose, which is not transcribed. The year headings 1963-1973 are printed as the chart's x-axis labels immediately above the data block and serve as its column headings; "Proceedings" is printed above the stub column (and again as the chart's y-axis label inside the plot box). The stub labels "C" and "R" are each preceded by a legend swatch (a solid black bar for C, a horizontally hatched bar for R); the swatches are graphics, not text, and are omitted. A small stray scan mark sits just left of the axis label "1969"; the label itself is clear. In the Totals row, the 1965 cell is damaged in the scan and its leading digit prints like a broken "4" (it reads roughly "/.84"); I transcribe it as 484, which also matches 336 + 148. All eleven columns sum consistently (C + R = Totals) as printed.
Source image
Source data: U.S. NLRB Annual Reports (public domain). Reconstruction by NLRB Stats Archive. Read by claude-opus-5 (effort max, prompt extract_v1) from the 300-dpi scan; stitched by page. Updated October 2026.