NLRB Stats Archive › Annual Reports › FY1973 › Time required to process representation cases
Time required to process representation cases
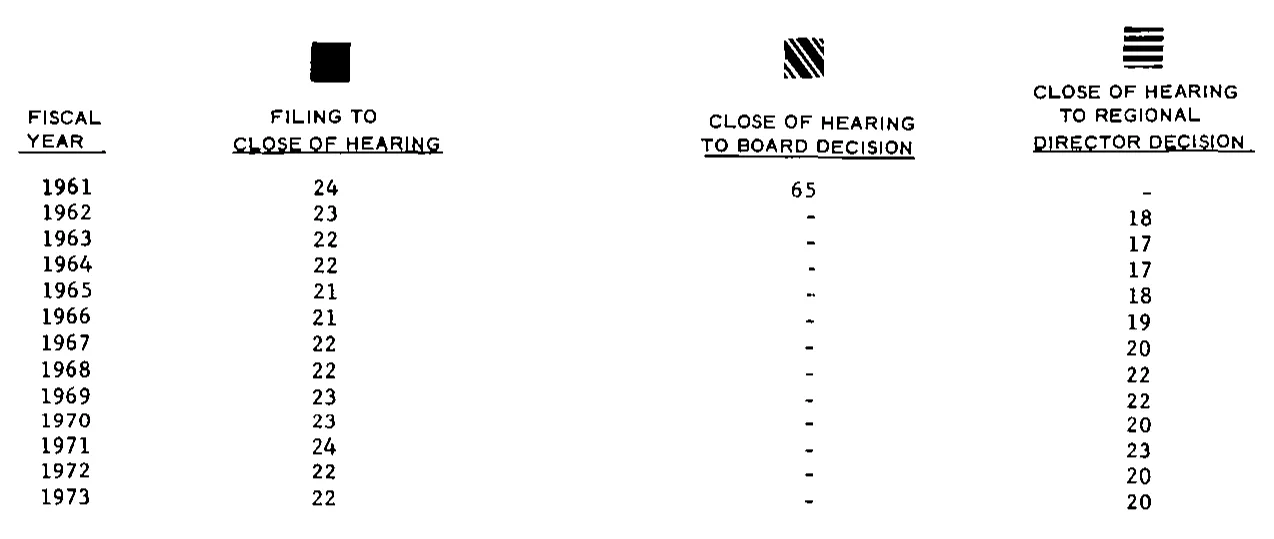
| FISCAL YEAR | FILING TO CLOSE OF HEARING | CLOSE OF HEARING TO BOARD DECISION | CLOSE OF HEARING TO REGIONAL DIRECTOR DECISION |
|---|---|---|---|
| 1961 | 24 | 65 | |
| 1962 | 23 | 18 | |
| 1963 | 22 | 17 | |
| 1964 | 22 | 17 | |
| 1965 | 21 | 18 | |
| 1966 | 21 | 19 | |
| 1967 | 22 | 20 | |
| 1968 | 22 | 22 | |
| 1969 | 23 | 22 | |
| 1970 | 23 | 20 | |
| 1971 | 24 | 23 | |
| 1972 | 22 | 20 | |
| 1973 | 22 | 20 |
0 of 26 figures sit in a row or column sum that works out.
Reader’s notes
p. 26. This crop is the data table printed beneath a bar chart (median days elapsed in representation cases); only the table portion is shown, the chart bars themselves are above/outside the crop. Above each of the three value-column headings is a small graphical legend swatch (solid black, diagonal-hatched, horizontal-striped) keying the column to a chart series; these carry no text and are not transcribed as a heading level. All column headings are printed in full capitals, as transcribed. Every cell rendered as "" in this grid holds a short printed dash rule in the image: the "CLOSE OF HEARING TO BOARD DECISION" column has a dash for 1962 through 1973 (a value, 65, appears only for 1961), and the "CLOSE OF HEARING TO REGIONAL DIRECTOR DECISION" column has a dash for 1961 only. The dashes for 1965 and 1966 in the Board-decision column are faint/broken in the scan but are consistent in position and width with the dashes in the other years, not with digits.
Source image
Source data: U.S. NLRB Annual Reports (public domain). Reconstruction by NLRB Stats Archive. Read by claude-opus-5 (effort max, prompt extract_v1) from the 300-dpi scan; stitched by page. Updated October 2026.