NLRB Stats Archive › Annual Reports › FY1973 › ULP case intake by charges and situations filed
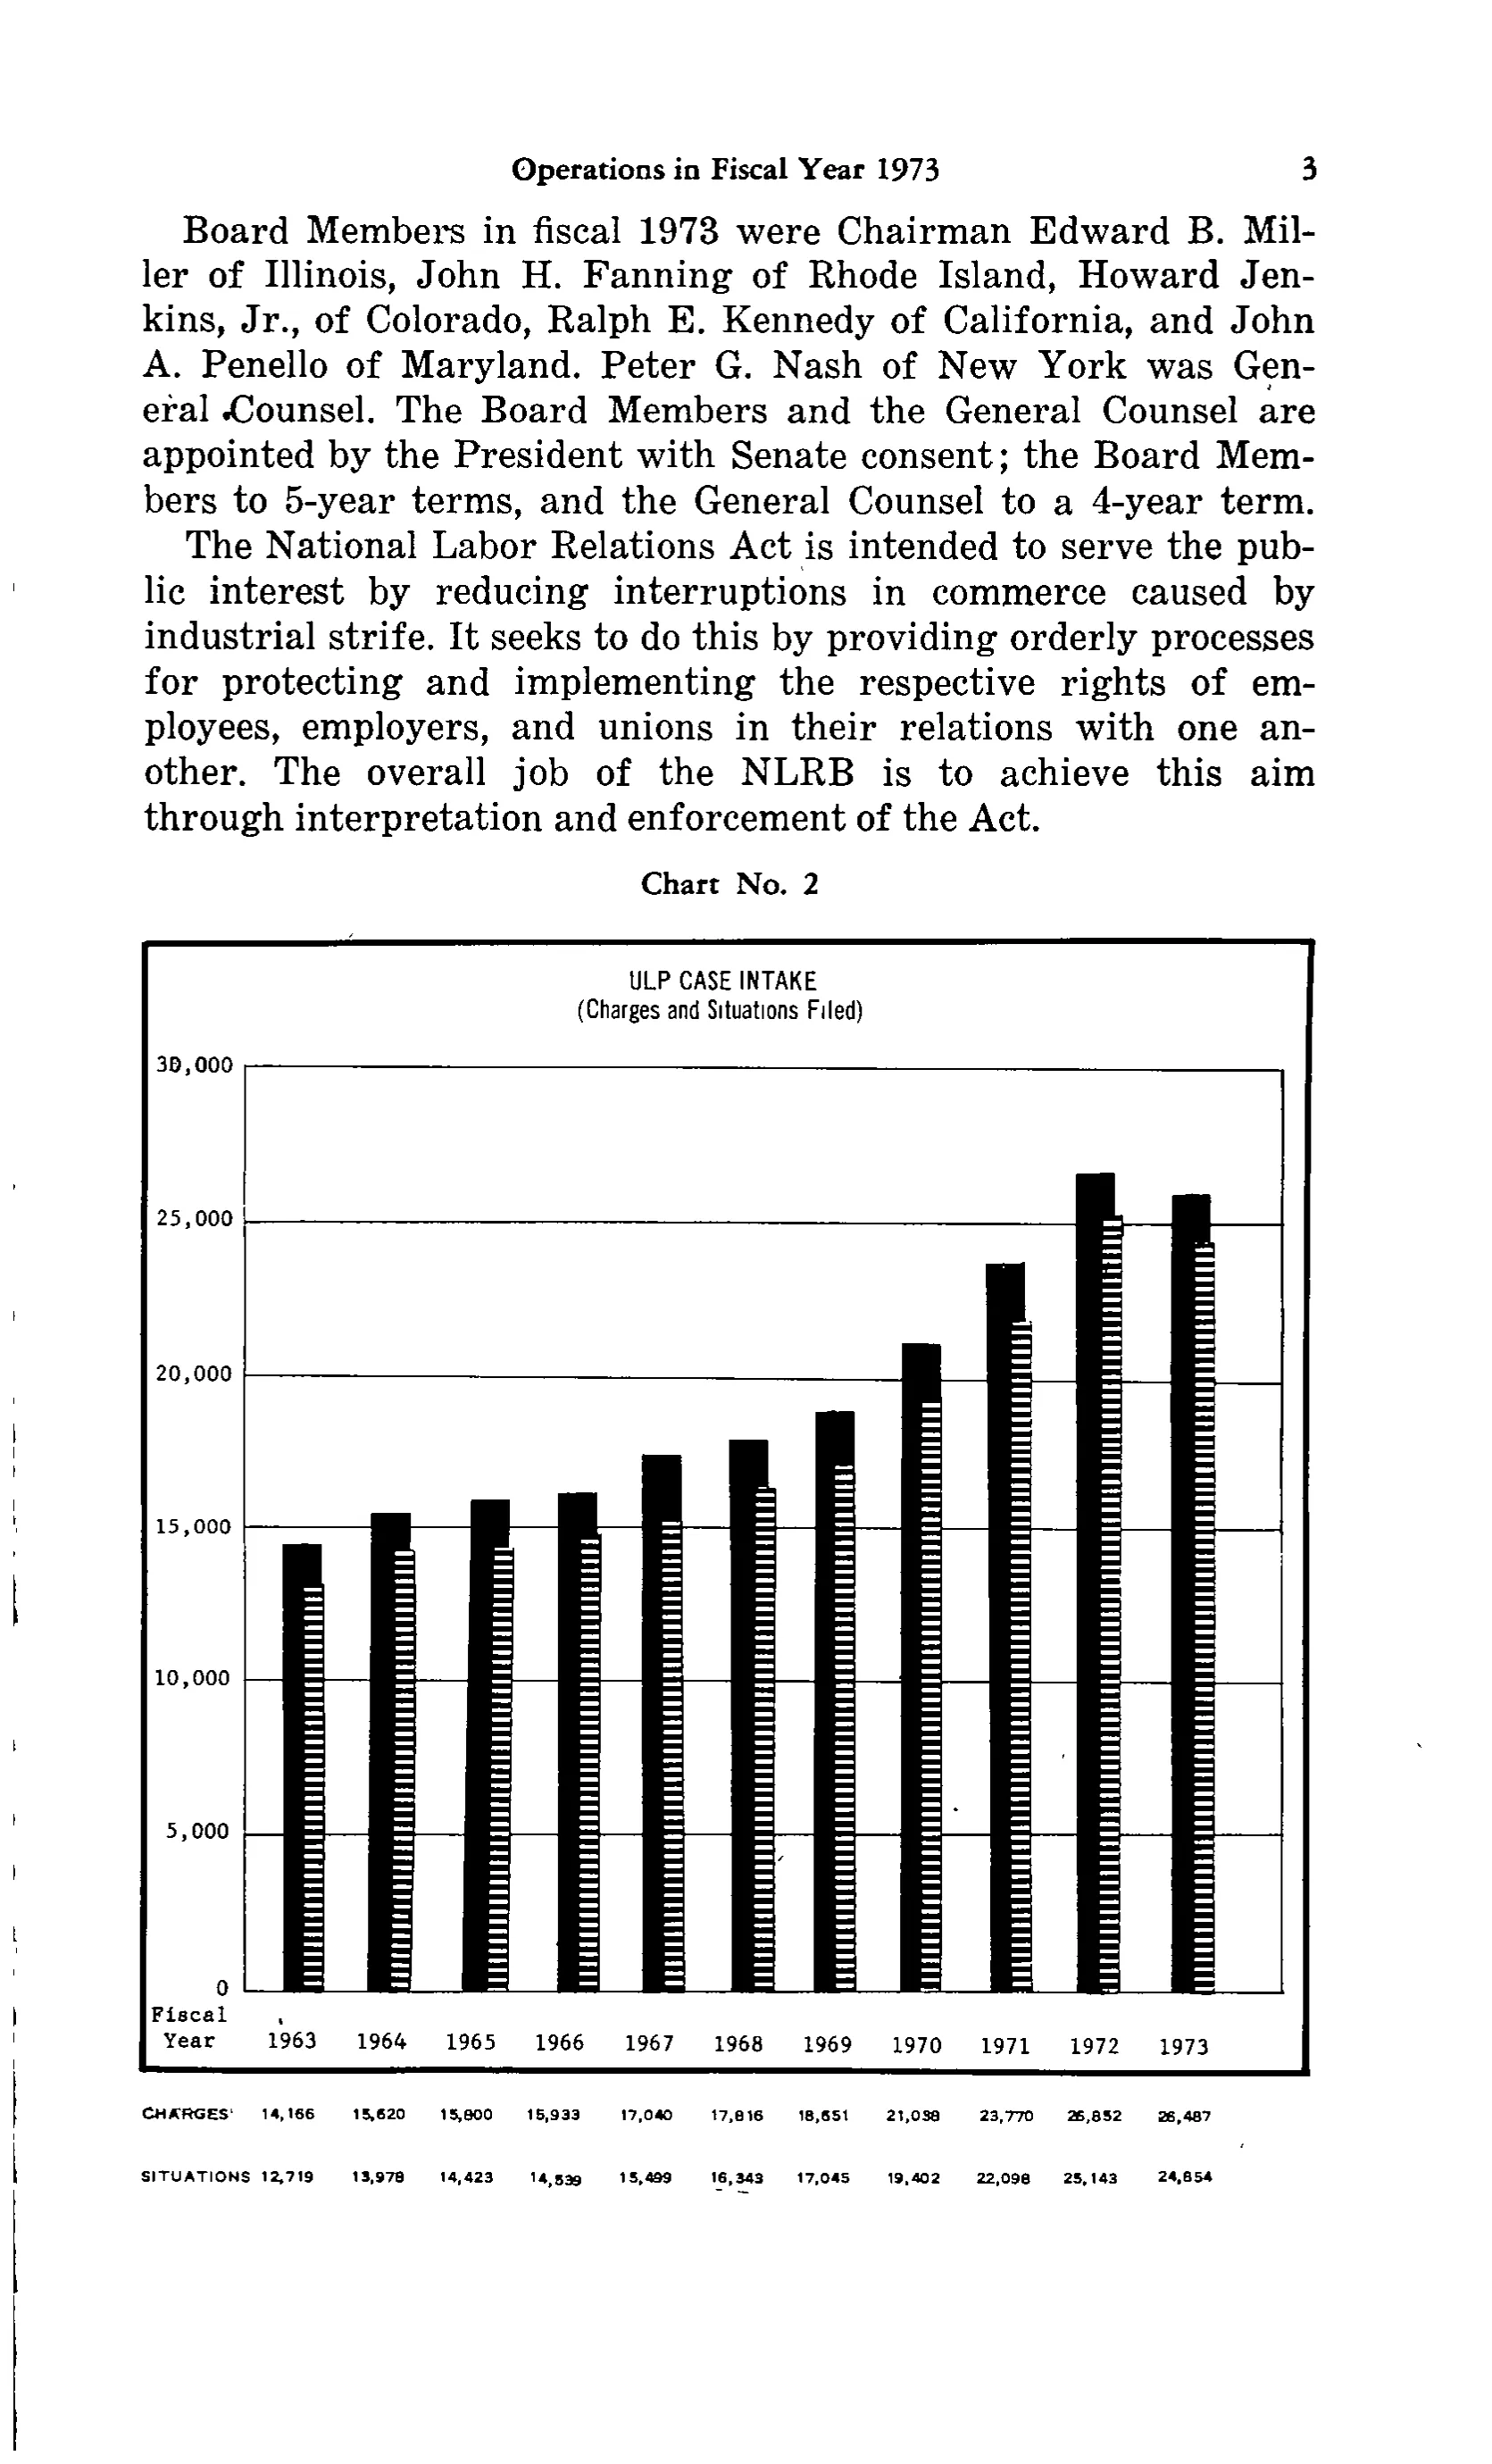
ULP case intake by charges and situations filed
| Fiscal Year | 1963 | 1964 | 1965 | 1966 | 1967 | 1968 | 1969 | 1970 | 1971 | 1972 | 1973 |
|---|---|---|---|---|---|---|---|---|---|---|---|
| CHARGES | 14,166 | 15,620 | 15,800 | 15,933 | 17,040 | 17,816 | 18,651 | 21,038 | 23,770 | 26,852 | 26,487 |
| SITUATIONS | 12,719 | 13,978 | 14,423 | 14,539 | 15,499 | 16,343 | 17,045 | 19,402 | 22,098 | 25,143 | 24,854 |
0 of 22 figures sit in a row or column sum that works out.
Reader’s notes
p. 16. The crop is a full report page (running head "Operations in Fiscal Year 1973", page 3) containing two paragraphs of body text and then "Chart No. 2", a bar chart titled "ULP CASE INTAKE (Charges and Situations Filed)". The only tabular matter is the data strip printed below the chart's plot area: the fiscal-year labels along the axis (stub label "Fiscal Year", set on two lines) and the two value rows CHARGES and SITUATIONS. That strip is what is transcribed here; the chart title and the axis scale labels (0; 5,000 ... 30,000) are not transcribed. Doubtful cells: - CHARGES, 1965: reads as 15,800 but the third digit could be a 9 (15,900). The plotted bar sits a shade below the 1966 bar (15,933), which slightly favors 15,800. - CHARGES, 1972: read as 26,852; the leading pair could be misread as 25,852. The bar height, and the fact that the 1972 bar is clearly the tallest in the series while 1973 is lower, support 26,852 (and the 1971-to-1972 rise of about 3,080 then matches the SITUATIONS rise of about 3,045). - CHARGES, 1973 (26,487) is printed lower than 1972, consistent with the chart and with SITUATIONS falling from 25,143 to 24,854. - The row label CHARGES is followed by a small raised tick in the scan. I read it as a scan artifact / stray speck rather than a footnote marker, since no footnote is printed anywhere on the page; it is therefore not carried into the label. - SITUATIONS, 1966 (14,539) and 1968 (16,343) carry small stray marks under the last digits in the scan; the digits themselves are legible. No footnotes are printed under the chart.
Source image
Source data: U.S. NLRB Annual Reports (public domain). Reconstruction by NLRB Stats Archive. Read by claude-opus-5 (effort max, prompt extract_v1) from the 300-dpi scan; stitched by page. Updated October 2026.