NLRB Stats Archive › Annual Reports › FY1972 › Distribution of Unfair Labor Practice Situations Received, by Number of Employees in Establishments, Fiscal Year 1972
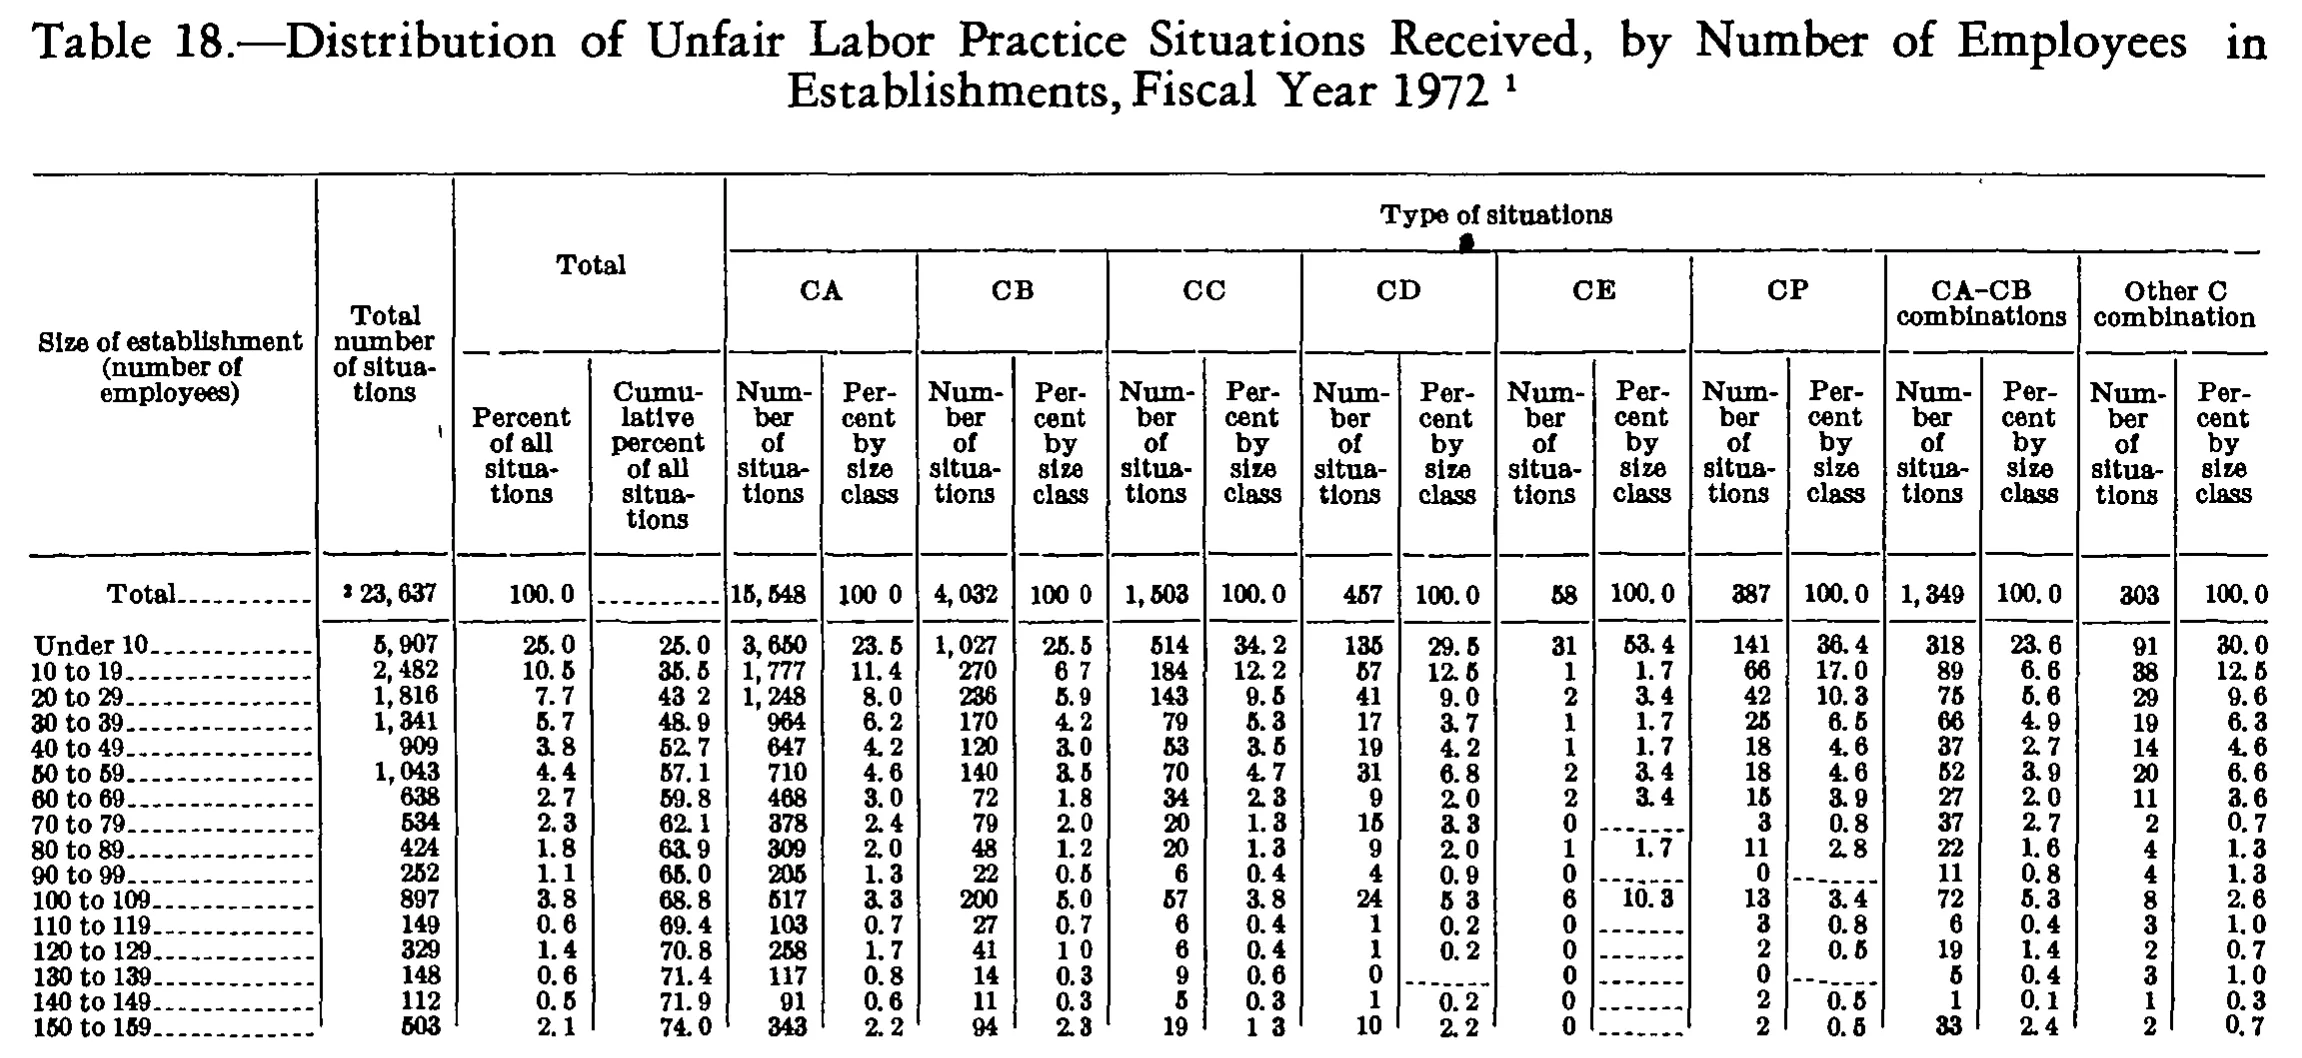
Distribution of Unfair Labor Practice Situations Received, by Number of Employees in Establishments, Fiscal Year 1972
Stitched from pp. 279–280.
| Size of establishment (number of employees) | Total number of situations | Total | Type of situations | ||||||||||||||||
|---|---|---|---|---|---|---|---|---|---|---|---|---|---|---|---|---|---|---|---|
| Size of establishment (number of employees) | Total number of situations | Total | CA | CB | CC | CD | CE | CP | CA-CB combinations | Other C combination | |||||||||
| Size of establishment (number of employees) | Total number of situations | Percent of all situations | Cumulative percent of all situations | Number of situations | Percent by size class | Number of situations | Percent by size class | Number of situations | Percent by size class | Number of situations | Percent by size class | Number of situations | Percent by size class | Number of situations | Percent by size class | Number of situations | Percent by size class | Number of situations | Percent by size class |
| Total | 23,637 | 100.0 | 15,548 | 100.0 | 4,032 | 100.0 | 1,503 | 100.0 | 457 | 100.0 | 58 | 100.0 | 387 | 100.0 | 1,349 | 100.0 | 303 | 100.0 | |
| Under 10 | 5,907 | 25.0 | 25.0 | 3,650 | 23.5 | 1,027 | 25.5 | 514 | 34.2 | 135 | 29.5 | 31 | 53.4 | 141 | 36.4 | 318 | 23.6 | 91 | 30.0 |
| 10 to 19 | 2,482 | 10.5 | 35.5 | 1,777 | 11.4 | 270 | 6.7 | 184 | 12.2 | 57 | 12.5 | 1 | 1.7 | 66 | 17.0 | 89 | 6.6 | 38 | 12.5 |
| 20 to 29 | 1,816 | 7.7 | 43.2 | 1,248 | 8.0 | 236 | 5.9 | 143 | 9.5 | 41 | 9.0 | 2 | 3.4 | 42 | 10.3 | 75 | 5.6 | 29 | 9.6 |
| 30 to 39 | 1,341 | 5.7 | 48.9 | 964 | 6.2 | 170 | 4.2 | 79 | 5.3 | 17 | 3.7 | 1 | 1.7 | 25 | 6.5 | 66 | 4.9 | 19 | 6.3 |
| 40 to 49 | 909 | 3.8 | 52.7 | 647 | 4.2 | 120 | 3.0 | 53 | 3.5 | 19 | 4.2 | 1 | 1.7 | 18 | 4.6 | 37 | 2.7 | 14 | 4.6 |
| 50 to 59 | 1,043 | 4.4 | 57.1 | 710 | 4.6 | 140 | 3.5 | 70 | 4.7 | 31 | 6.8 | 2 | 3.4 | 18 | 4.6 | 52 | 3.9 | 20 | 6.6 |
| 60 to 69 | 638 | 2.7 | 59.8 | 468 | 3.0 | 72 | 1.8 | 34 | 2.3 | 9 | 2.0 | 2 | 3.4 | 15 | 3.9 | 27 | 2.0 | 11 | 3.6 |
| 70 to 79 | 534 | 2.3 | 62.1 | 378 | 2.4 | 79 | 2.0 | 20 | 1.3 | 15 | 3.3 | 0 | 3 | 0.8 | 37 | 2.7 | 2 | 0.7 | |
| 80 to 89 | 424 | 1.8 | 63.9 | 309 | 2.0 | 48 | 1.2 | 20 | 1.3 | 9 | 2.0 | 1 | 1.7 | 11 | 2.8 | 22 | 1.6 | 4 | 1.3 |
| 90 to 99 | 252 | 1.1 | 65.0 | 205 | 1.3 | 22 | 0.5 | 6 | 0.4 | 4 | 0.9 | 0 | 0 | 11 | 0.8 | 4 | 1.3 | ||
| 100 to 109 | 897 | 3.8 | 68.8 | 517 | 3.3 | 200 | 5.0 | 57 | 3.8 | 24 | 5.3 | 6 | 10.3 | 13 | 3.4 | 72 | 5.3 | 8 | 2.6 |
| 110 to 119 | 149 | 0.6 | 69.4 | 103 | 0.7 | 27 | 0.7 | 6 | 0.4 | 1 | 0.2 | 0 | 3 | 0.8 | 6 | 0.4 | 3 | 1.0 | |
| 120 to 129 | 329 | 1.4 | 70.8 | 258 | 1.7 | 41 | 1.0 | 6 | 0.4 | 1 | 0.2 | 0 | 2 | 0.5 | 19 | 1.4 | 2 | 0.7 | |
| 130 to 139 | 148 | 0.6 | 71.4 | 117 | 0.8 | 14 | 0.3 | 9 | 0.6 | 0 | 0 | 0 | 5 | 0.4 | 3 | 1.0 | |||
| 140 to 149 | 112 | 0.5 | 71.9 | 91 | 0.6 | 11 | 0.3 | 5 | 0.3 | 1 | 0.2 | 0 | 2 | 0.5 | 1 | 0.1 | 1 | 0.3 | |
| 150 to 159 | 503 | 2.1 | 74.0 | 343 | 2.2 | 94 | 2.3 | 19 | 1.3 | 10 | 2.2 | 0 | 2 | 0.5 | 33 | 2.4 | 2 | 0.7 | |
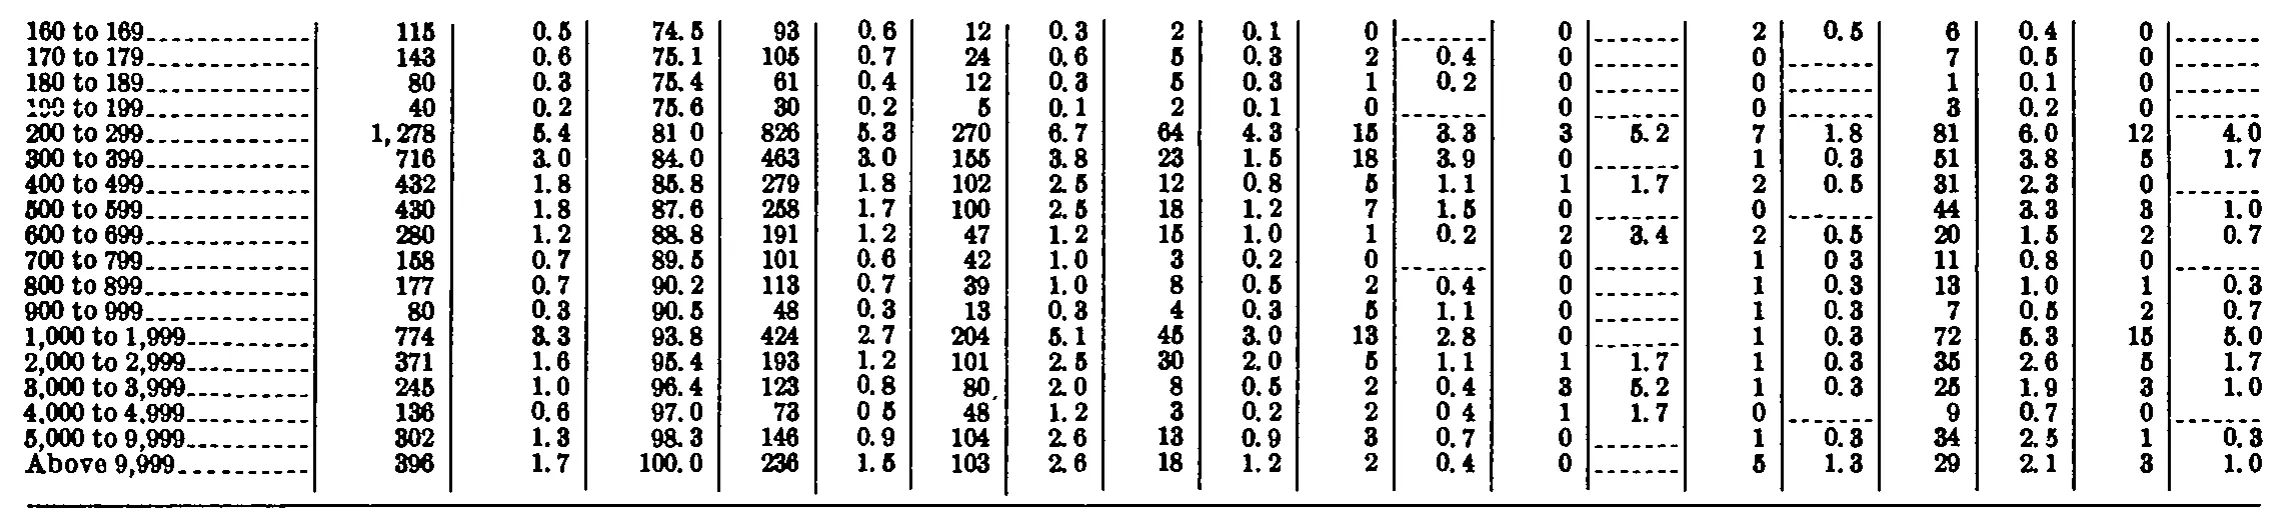
| 160 to 169 | 115 | 0.5 | 74.5 | 93 | 0.6 | 12 | 0.3 | 2 | 0.1 | 0 | 0 | 2 | 0.5 | 6 | 0.4 | 0 | |||
| 170 to 179 | 143 | 0.6 | 75.1 | 105 | 0.7 | 24 | 0.6 | 5 | 0.3 | 2 | 0.4 | 0 | 0 | 0.5 | 7 | 0.5 | 0 | ||
| 180 to 189 | 80 | 0.3 | 75.4 | 61 | 0.4 | 12 | 0.3 | 5 | 0.3 | 1 | 0.2 | 0 | 0 | 1 | 0.1 | 0 | |||
| 190 to 199 | 40 | 0.2 | 75.6 | 30 | 0.2 | 5 | 0.1 | 2 | 0.1 | 0 | 0 | 0 | 3 | 0.2 | 0 | ||||
| 200 to 299 | 1,278 | 5.4 | 81.0 | 826 | 5.3 | 270 | 6.7 | 64 | 4.3 | 15 | 3.3 | 3 | 5.2 | 7 | 1.8 | 81 | 6.0 | 12 | 4.0 |
| 300 to 399 | 716 | 3.0 | 84.0 | 463 | 3.0 | 155 | 3.8 | 23 | 1.5 | 18 | 3.9 | 0 | 1 | 0.3 | 51 | 3.8 | 5 | 1.7 | |
| 400 to 499 | 432 | 1.8 | 85.8 | 279 | 1.8 | 102 | 2.5 | 12 | 0.8 | 5 | 1.1 | 1 | 1.7 | 2 | 0.5 | 31 | 2.3 | 0 | |
| 500 to 599 | 430 | 1.8 | 87.6 | 258 | 1.7 | 100 | 2.5 | 18 | 1.2 | 7 | 1.5 | 0 | 0 | 44 | 3.3 | 3 | 1.0 | ||
| 600 to 699 | 280 | 1.2 | 88.8 | 191 | 1.2 | 47 | 1.2 | 15 | 1.0 | 1 | 0.2 | 2 | 3.4 | 2 | 0.5 | 20 | 1.5 | 2 | 0.7 |
| 700 to 799 | 158 | 0.7 | 89.5 | 101 | 0.6 | 42 | 1.0 | 3 | 0.2 | 0 | 0 | 1 | 0.3 | 11 | 0.8 | 0 | |||
| 800 to 899 | 177 | 0.7 | 90.2 | 113 | 0.7 | 39 | 1.0 | 8 | 0.5 | 2 | 0.4 | 0 | 1 | 0.3 | 13 | 1.0 | 1 | 0.3 | |
| 900 to 999 | 80 | 0.3 | 90.5 | 48 | 0.3 | 13 | 0.3 | 4 | 0.3 | 5 | 1.1 | 0 | 1 | 0.3 | 7 | 0.5 | 2 | 0.7 | |
| 1,000 to 1,999 | 774 | 3.3 | 93.8 | 424 | 2.7 | 204 | 5.1 | 45 | 3.0 | 13 | 2.8 | 0 | 1 | 0.3 | 72 | 5.3 | 15 | 5.0 | |
| 2,000 to 2,999 | 371 | 1.6 | 95.4 | 193 | 1.2 | 101 | 2.5 | 30 | 2.0 | 5 | 1.1 | 1 | 1.7 | 1 | 0.3 | 35 | 2.6 | 5 | 1.7 |
| 3,000 to 3,999 | 245 | 1.0 | 96.4 | 123 | 0.8 | 80 | 2.0 | 8 | 0.5 | 2 | 0.4 | 3 | 5.2 | 1 | 0.3 | 25 | 1.9 | 3 | 1.0 |
| 4,000 to 4,999 | 136 | 0.6 | 97.0 | 73 | 0.5 | 48 | 1.2 | 3 | 0.2 | 2 | 0.4 | 1 | 1.7 | 0 | 9 | 0.7 | 0 | ||
| 5,000 to 9,999 | 302 | 1.3 | 98.3 | 146 | 0.9 | 104 | 2.6 | 13 | 0.9 | 3 | 0.7 | 0 | 1 | 0.3 | 34 | 2.5 | 1 | 0.3 | |
| Above 9,999 | 396 | 1.7 | 100.0 | 236 | 1.5 | 103 | 2.6 | 18 | 1.2 | 2 | 0.4 | 0 | 5 | 1.3 | 29 | 2.1 | 3 | 1.0 | |
278 of 278 figures sit in a row or column sum that works out.
Reader’s notes
p. 279. CROP: the table is cut off at the bottom edge immediately after the "150 to 159" row (its cumulative percent is only 74.0, so further size classes follow on the rest of the page). No footnote block is visible inside the crop, so `footnotes` is empty even though markers 1 (on the caption) and 2 (on the grand total) are referenced. FOOTNOTE MARKER: the grand total in the "Total number of situations" column is printed with a small raised digit before the number; I read it as a 2 and transcribed "23,637^2", but at this scan resolution it could be a 3. FAINT DECIMAL POINTS: the 1-bit scan drops or nearly drops the decimal point in a number of percent cells, which print as e.g. "100 0" (Total row, CA and CB percent columns), "6 7" (10 to 19, CB percent), "43 2" (20 to 29, cumulative percent), "12 5" (10 to 19, CD percent), "3 3" (70 to 79, CD percent), "5 3" (100 to 109, CD percent), "1 0" (120 to 129, CB percent), "1 3" (150 to 159, CC percent). Every percent column in this table is printed to one decimal place and the implied values are arithmetically correct, so I have transcribed these with the decimal point restored; the digits themselves are as printed. SUSPECT CELL: row "20 to 29", column "CP / Percent by size class" reads 10.3 in the image, but the CP count for that row is 42 and the CP total is 387, which gives 10.9. Every other percent in the table reproduces its count/total to the printed decimal, so this is either a 9 misread as a 3 in the scan or a misprint in the original. Transcribed as read (10.3). VERIFICATION: each of the 16 size-class rows sums exactly across the eight type-of-situation "Number of situations" columns to its "Total number of situations" (e.g. 20 to 29: 1,248+236+143+41+2+42+75+29 = 1,816; 150 to 159: 343+94+19+10+0+2+33+2 = 503), and the eight column totals sum to 23,637. The cumulative-percent column also chains exactly from the percent-of-all column. This corroborates the digits and the column each one sits in. ZERO CELLS: in rows where a type count is 0 the matching percent cell is printed either as a dash rule or as blank space; both are transcribed as "". The counts themselves are printed zeros and are kept as "0". ARTIFACT: a small ink blob sits just under the centred "Type of situations" spanner heading. It has no shape of a digit or letter and no matching note is visible, so I have treated it as a scan speck rather than a footnote marker on that heading.
p. 280. CROP SCOPE: this is a continuation fragment — no column headings, caption, footnotes or total row are printed on this image, so header_rows is empty. The grid has 20 columns: the stub plus 19 printed columns, read from the column rules as a number/percent/cumulative-percent triple followed by eight number/percent pairs. All earlier size classes (below 160) and the headings are on the preceding page. A heavy rule closes the body under "Above 9,999"; nothing follows it on this crop. DOUBTFUL CELL — row "170 to 179", columns 14 and 15 (the sixth number/percent pair, the one that reads "2 | 0.5" in the row above): the count glyph reads as 0 while the percent beside it reads 0.5. That is internally inconsistent — every other row in that pair is consistent with a column total near 390, where 0.5% corresponds to a count of 2 (see rows "160 to 169", "400 to 499" and "600 to 699", all printed "2 | 0.5"). I transcribed the characters as they appear (0 and 0.5) rather than reconcile them; a re-check of this one cell at higher magnification is worthwhile, as the count is most likely a degraded "2". DEGRADED 3/8 GLYPHS: the scan thickens the digit 3 so that it can read as 8 at this resolution. Two cells were resolved against the table's own arithmetic and transcribed as 3: - row "1,000 to 1,999", column 2 (percent): transcribed 3.3. The glyph renders like 8.3, but the cumulative column printed immediately to its right runs 90.5 -> 93.8 (a 3.3 step), and 774 of a column total near 23,700 is 3.27%. - row "200 to 299", column 11 (percent of the fourth pair): transcribed 3.3. That pair's column total is near 460 (fixed by the row below, 18 = 3.9%), and 15/460 = 3.3%; 3.8% would require a total near 395, which contradicts the rest of the column. No arithmetic was used to alter any value — only to choose between two readings of one ambiguous glyph. FAINT DECIMAL POINTS: the period is broken or missing in the scan in several percent cells, printed as e.g. "81 0", "0 5", "0 3", "2 0", "1 5". These are decimal values and are transcribed with the point (81.0, 0.5, 0.3, 2.0, 1.5). FAINT ROW LABEL: the stub of the fourth row is partly dropped out by the scan; only "to 199" is clean. It is transcribed as "190 to 199" from the printed sequence (160 to 169 / 170 to 179 / 180 to 189 / ... / 200 to 299). DASH RULES: cells holding only a dash rule are given as "". They always sit in a percent column beside a printed 0 count, so the pairing is unambiguous. CROSS-CHECKS PASSED: the cumulative-percent column advances by exactly the percent printed beside it in all 18 rows (74.5 through 100.0), and every number/percent pair in all eight pair-columns is consistent with a single implied column total. Only the one cell flagged above fails.
Source image
Source data: U.S. NLRB Annual Reports (public domain). Reconstruction by NLRB Stats Archive. Read by claude-opus-5 (effort max, prompt extract_v1) from the 300-dpi scan; stitched by page. Updated October 2026.