NLRB Stats Archive › Annual Reports › FY1972 › Industrial Distribution of Representation Elections Held in Cases Closed, Fiscal Year 1972
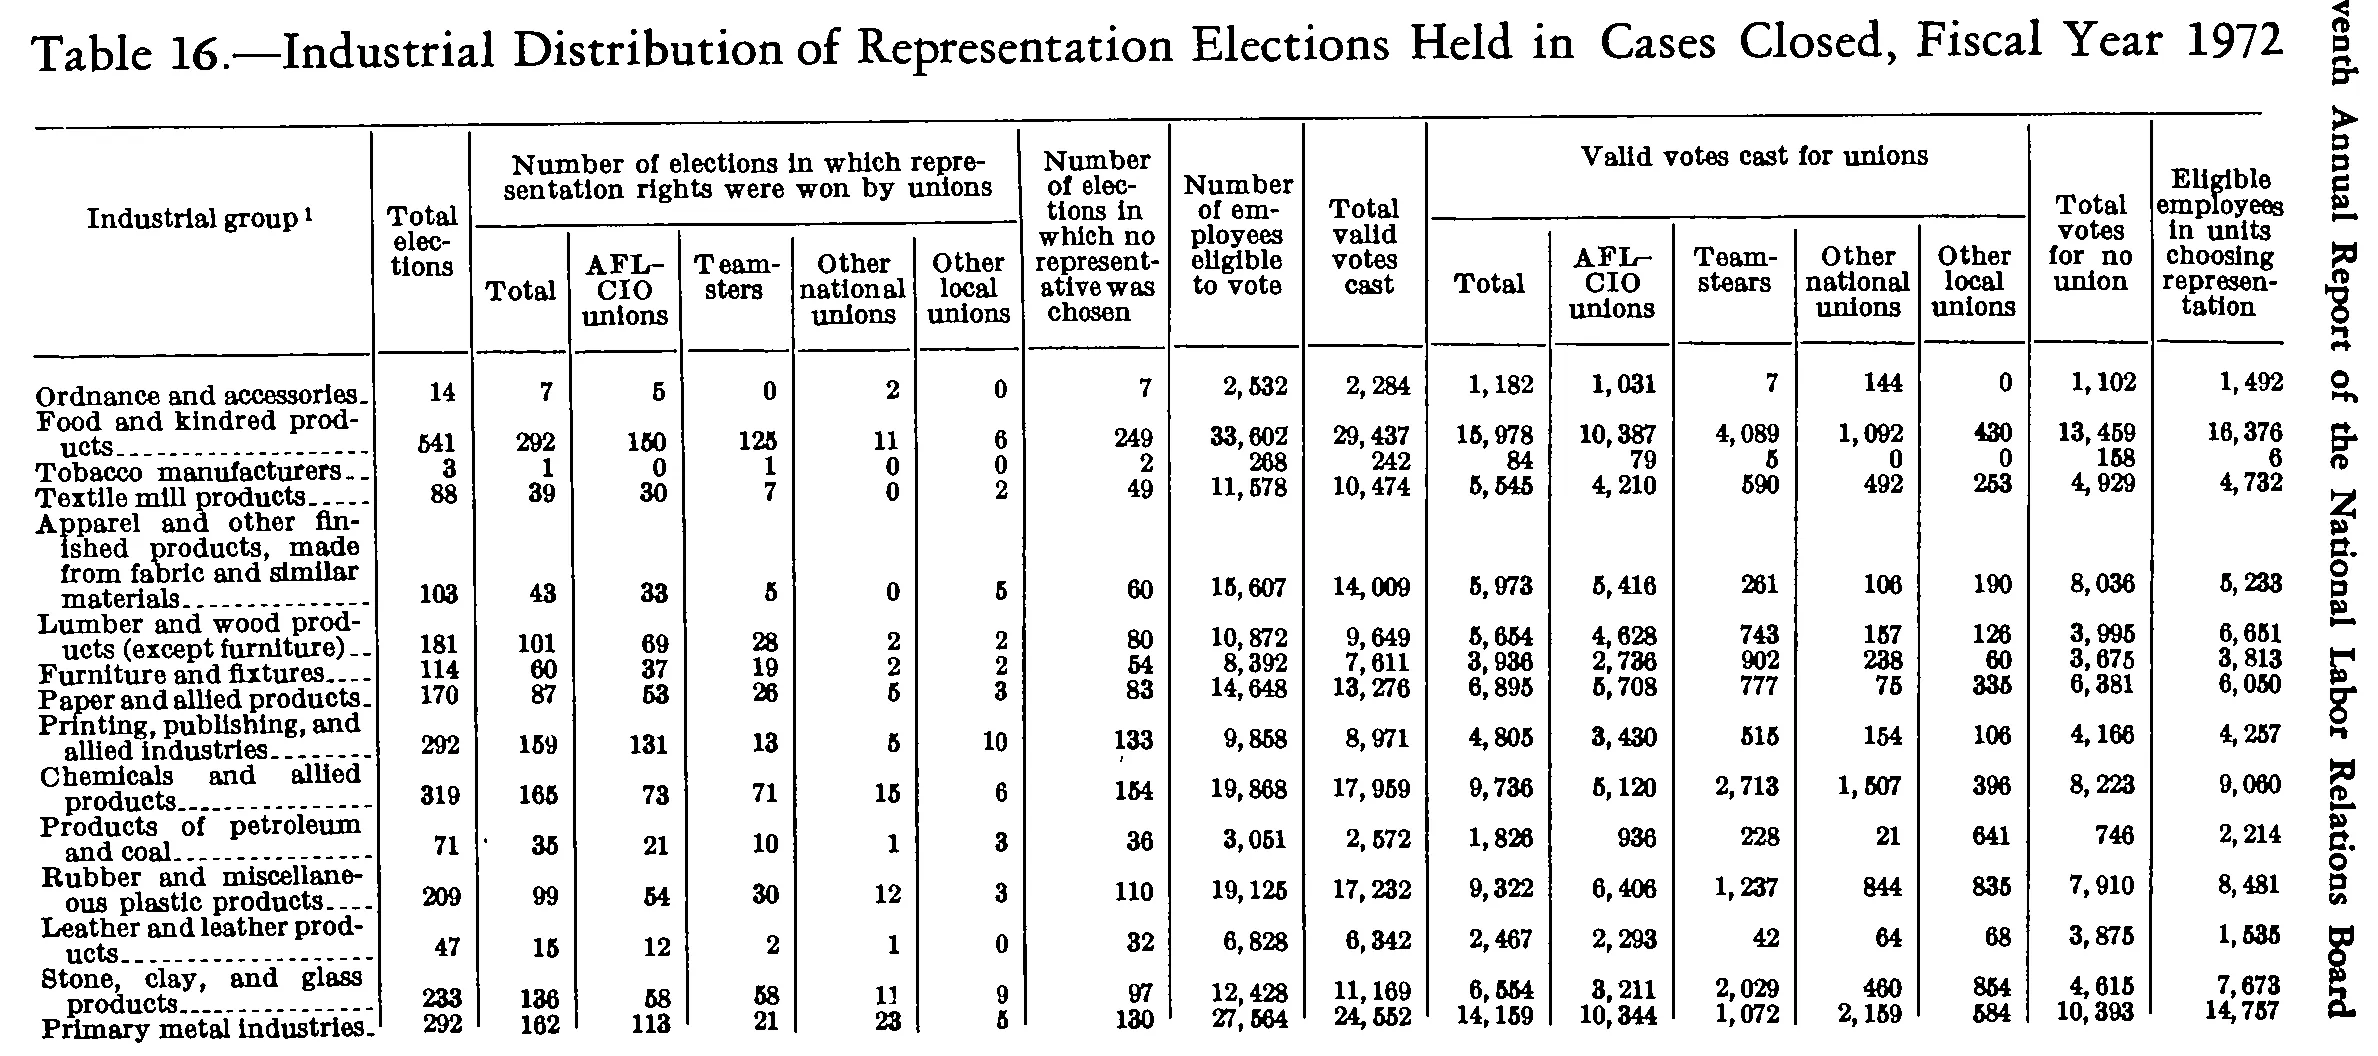
Industrial Distribution of Representation Elections Held in Cases Closed, Fiscal Year 1972
Stitched from pp. 273–276.
| Industrial group | Total elections | Number of elections in which representation rights were won by unions | Number of elections in which no representative was chosen | Number of employees eligible to vote | Total valid votes cast | Valid votes cast for unions | Total votes for no union | Eligible employees in units choosing representation | ||||||||
|---|---|---|---|---|---|---|---|---|---|---|---|---|---|---|---|---|
| Industrial group | Total elections | Total | AFL-CIO unions | Teamsters | Other national unions | Other local unions | Number of elections in which no representative was chosen | Number of employees eligible to vote | Total valid votes cast | Total | AFL-CIO unions | Teamstears | Other national unions | Other local unions | Total votes for no union | Eligible employees in units choosing representation |
| Ordnance and accessories | 14 | 7 | 5 | 0 | 2 | 0 | 7 | 2,532 | 2,284 | 1,182 | 1,031 | 7 | 144 | 0 | 1,102 | 1,492 |
| Food and kindred products | 541 | 292 | 150 | 125 | 11 | 6 | 249 | 33,602 | 29,437 | 15,978 | 10,387 | 4,089 | 1,092 | 430 | 13,459 | 16,376 |
| Tobacco manufacturers | 3 | 1 | 0 | 1 | 0 | 0 | 2 | 268 | 242 | 84 | 79 | 5 | 0 | 0 | 158 | 6 |
| Textile mill products | 88 | 39 | 30 | 7 | 0 | 2 | 49 | 11,578 | 10,474 | 5,545 | 4,210 | 590 | 492 | 253 | 4,929 | 4,732 |
| Apparel and other finished products, made from fabric and similar materials | 103 | 43 | 33 | 5 | 0 | 5 | 60 | 15,607 | 14,009 | 5,973 | 5,416 | 261 | 106 | 190 | 8,036 | 5,233 |
| Lumber and wood products (except furniture) | 181 | 101 | 69 | 28 | 2 | 2 | 80 | 10,872 | 9,649 | 5,654 | 4,628 | 743 | 157 | 126 | 3,995 | 6,651 |
| Furniture and fixtures | 114 | 60 | 37 | 19 | 2 | 2 | 54 | 8,392 | 7,611 | 3,936 | 2,736 | 902 | 238 | 60 | 3,675 | 3,813 |
| Paper and allied products | 170 | 87 | 53 | 26 | 5 | 3 | 83 | 14,648 | 13,276 | 6,895 | 5,708 | 777 | 75 | 335 | 6,381 | 6,050 |
| Printing, publishing, and allied industries | 292 | 159 | 131 | 13 | 5 | 10 | 133 | 9,858 | 8,971 | 4,805 | 3,430 | 515 | 154 | 106 | 4,166 | 4,257 |
| Chemicals and allied products | 319 | 165 | 73 | 71 | 15 | 6 | 154 | 19,868 | 17,959 | 9,736 | 5,120 | 2,713 | 1,507 | 396 | 8,223 | 9,060 |
| Products of petroleum and coal | 71 | 35 | 21 | 10 | 1 | 3 | 36 | 3,051 | 2,572 | 1,826 | 936 | 228 | 21 | 641 | 746 | 2,214 |
| Rubber and miscellaneous plastic products | 209 | 99 | 54 | 30 | 12 | 3 | 110 | 19,125 | 17,232 | 9,322 | 6,406 | 1,237 | 844 | 835 | 7,910 | 8,481 |
| Leather and leather products | 47 | 15 | 12 | 2 | 1 | 0 | 32 | 6,828 | 6,342 | 2,467 | 2,293 | 42 | 64 | 68 | 3,875 | 1,535 |
| Stone, clay, and glass products | 233 | 136 | 58 | 58 | 11 | 9 | 97 | 12,428 | 11,169 | 6,554 | 3,211 | 2,029 | 460 | 854 | 4,615 | 7,673 |
| Primary metal industries | 292 | 162 | 113 | 21 | 23 | 5 | 130 | 27,564 | 24,552 | 14,159 | 10,344 | 1,072 | 2,159 | 584 | 10,393 | 14,757 |
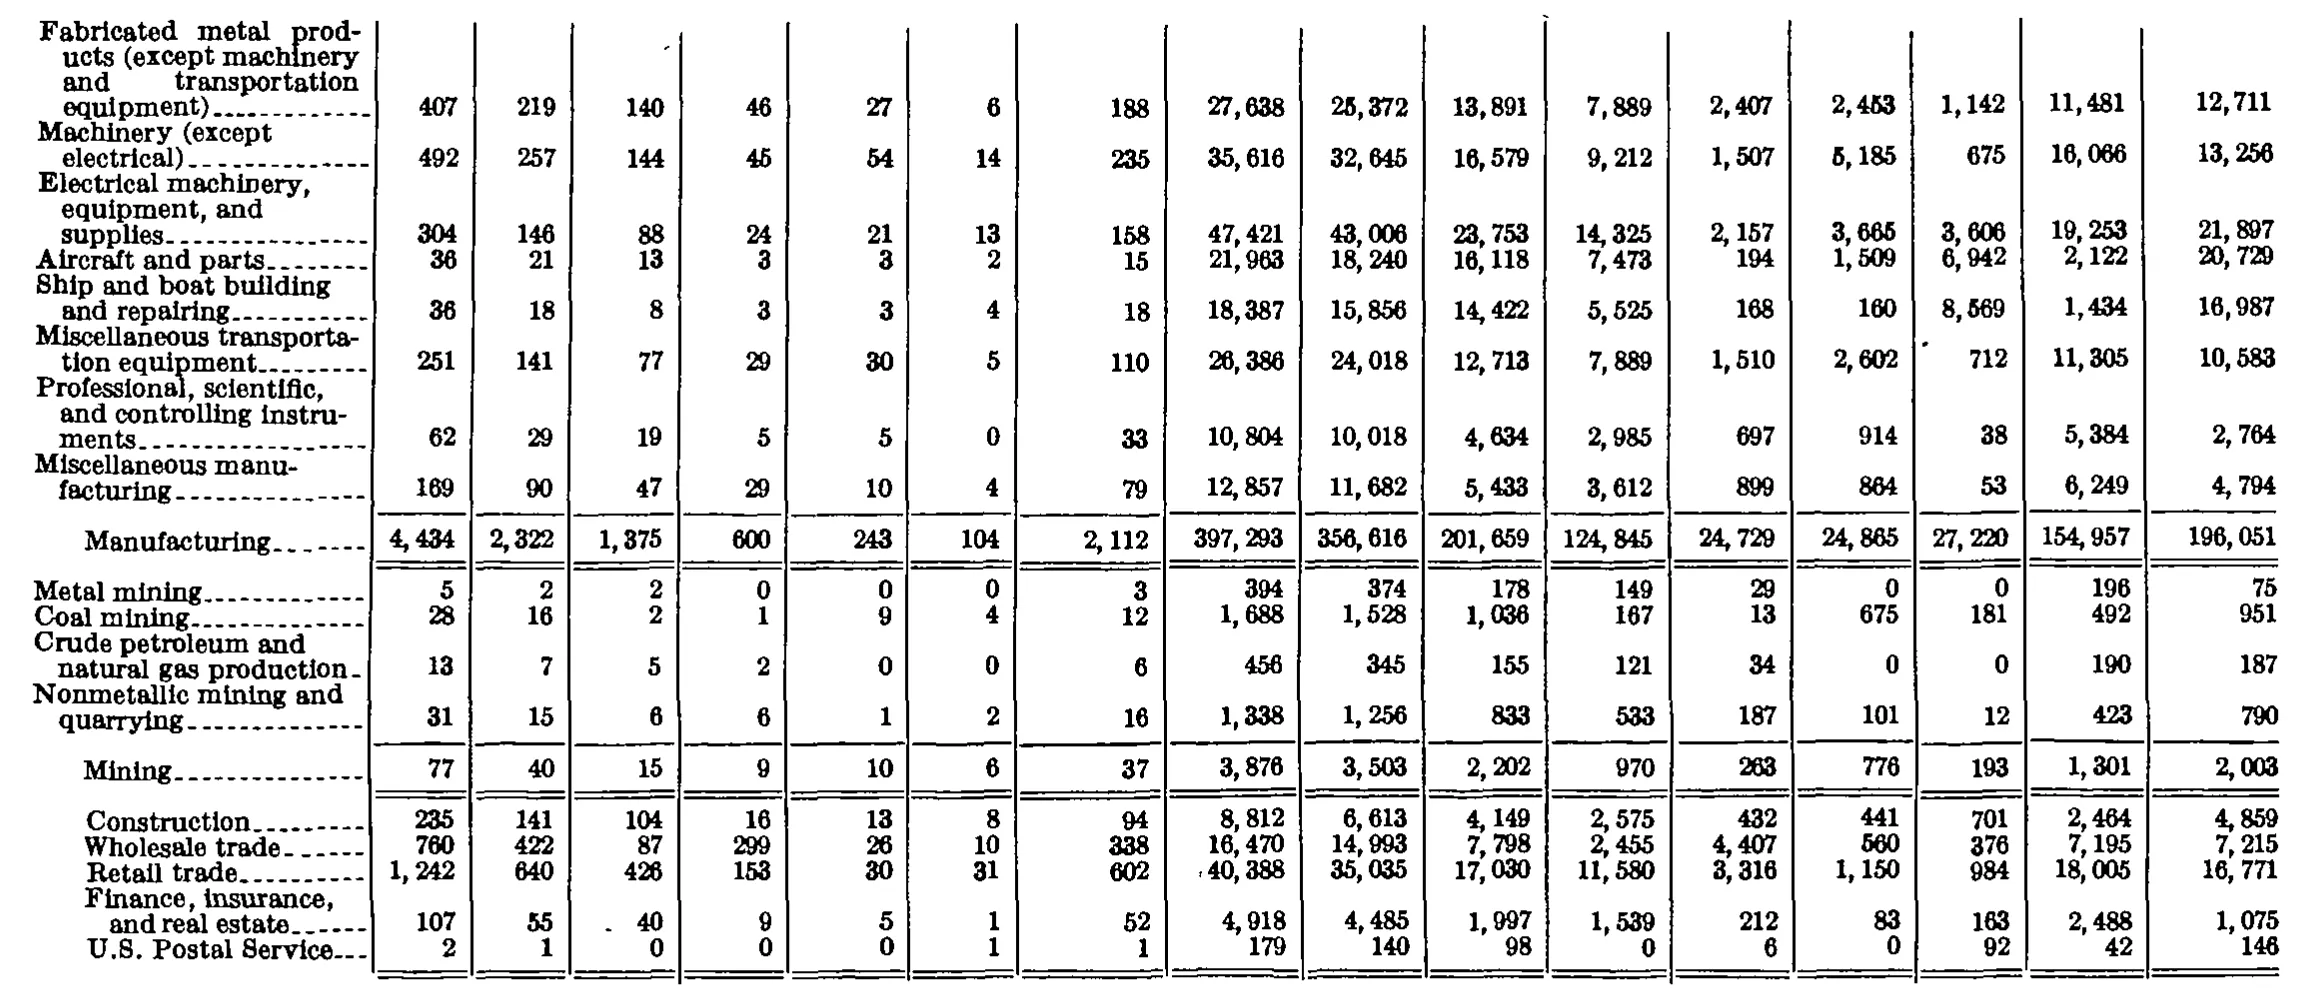
| Fabricated metal products (except machinery and transportation equipment) | 407 | 219 | 140 | 46 | 27 | 6 | 188 | 27,638 | 25,372 | 13,891 | 7,889 | 2,407 | 2,453 | 1,142 | 11,481 | 12,711 |
| Machinery (except electrical) | 492 | 257 | 144 | 45 | 54 | 14 | 235 | 35,616 | 32,645 | 16,579 | 9,212 | 1,507 | 5,185 | 675 | 16,066 | 13,256 |
| Electrical machinery, equipment, and supplies | 304 | 146 | 88 | 24 | 21 | 13 | 158 | 47,421 | 43,006 | 23,753 | 14,325 | 2,157 | 3,665 | 3,606 | 19,253 | 21,897 |
| Aircraft and parts | 36 | 21 | 13 | 3 | 3 | 2 | 15 | 21,963 | 18,240 | 16,118 | 7,473 | 194 | 1,509 | 6,942 | 2,122 | 20,729 |
| Ship and boat building and repairing | 36 | 18 | 8 | 3 | 3 | 4 | 18 | 18,387 | 15,856 | 14,422 | 5,525 | 168 | 160 | 8,569 | 1,434 | 16,987 |
| Miscellaneous transportation equipment | 251 | 141 | 77 | 29 | 30 | 5 | 110 | 26,386 | 24,018 | 12,713 | 7,889 | 1,510 | 2,602 | 712 | 11,305 | 10,583 |
| Professional, scientific, and controlling instruments | 62 | 29 | 19 | 5 | 5 | 0 | 33 | 10,804 | 10,018 | 4,634 | 2,985 | 697 | 914 | 38 | 5,384 | 2,764 |
| Miscellaneous manufacturing | 169 | 90 | 47 | 29 | 10 | 4 | 79 | 12,857 | 11,682 | 5,433 | 3,612 | 899 | 864 | 53 | 6,249 | 4,794 |
| Manufacturing | 4,434 | 2,322 | 1,375 | 600 | 243 | 104 | 2,112 | 397,293 | 356,616 | 201,659 | 124,845 | 24,729 | 24,865 | 27,220 | 154,957 | 196,051 |
| Metal mining | 5 | 2 | 2 | 0 | 0 | 0 | 3 | 394 | 374 | 178 | 149 | 29 | 0 | 0 | 196 | 75 |
| Coal mining | 28 | 16 | 2 | 1 | 9 | 4 | 12 | 1,688 | 1,528 | 1,036 | 167 | 13 | 675 | 181 | 492 | 951 |
| Crude petroleum and natural gas production | 13 | 7 | 5 | 2 | 0 | 0 | 6 | 456 | 345 | 155 | 121 | 34 | 0 | 0 | 190 | 187 |
| Nonmetallic mining and quarrying | 31 | 15 | 6 | 6 | 1 | 2 | 16 | 1,338 | 1,256 | 833 | 533 | 187 | 101 | 12 | 423 | 790 |
| Mining | 77 | 40 | 15 | 9 | 10 | 6 | 37 | 3,876 | 3,503 | 2,202 | 970 | 263 | 776 | 193 | 1,301 | 2,003 |
| Construction | 235 | 141 | 104 | 16 | 13 | 8 | 94 | 8,812 | 6,613 | 4,149 | 2,575 | 432 | 441 | 701 | 2,464 | 4,859 |
| Wholesale trade | 760 | 422 | 87 | 299 | 26 | 10 | 338 | 16,470 | 14,993 | 7,798 | 2,455 | 4,407 | 560 | 376 | 7,195 | 7,215 |
| Retail trade | 1,242 | 640 | 426 | 153 | 30 | 31 | 602 | 40,388 | 35,035 | 17,030 | 11,580 | 3,316 | 1,150 | 984 | 18,005 | 16,771 |
| Finance, insurance, and real estate | 107 | 55 | 40 | 9 | 5 | 1 | 52 | 4,918 | 4,485 | 1,997 | 1,539 | 212 | 83 | 163 | 2,488 | 1,075 |
| U.S. Postal Service | 2 | 1 | 0 | 0 | 0 | 1 | 1 | 179 | 140 | 98 | 0 | 6 | 0 | 92 | 42 | 146 |
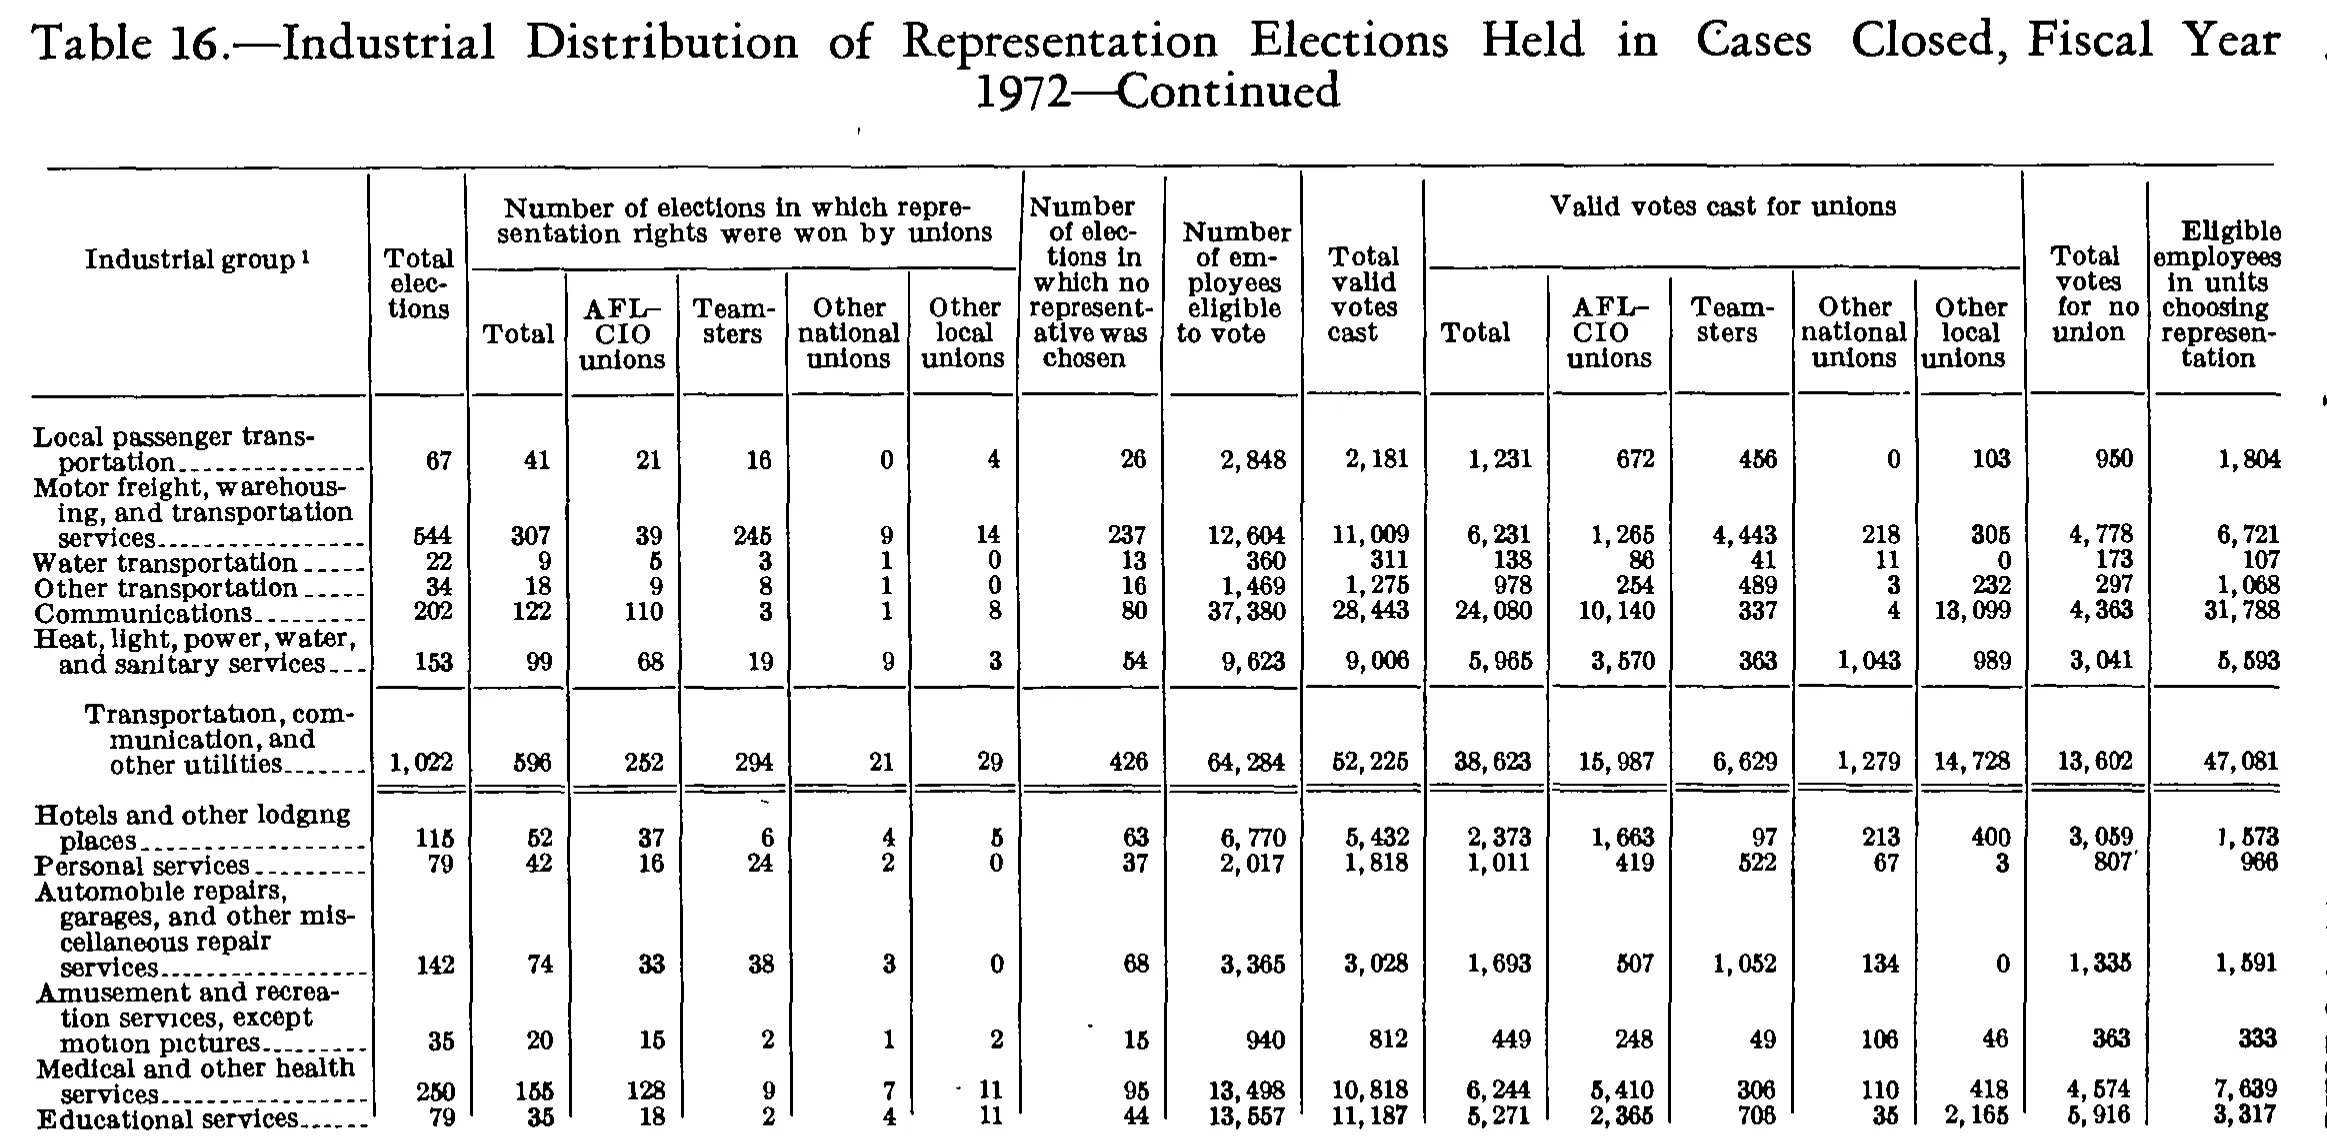
| Local passenger transportation | 67 | 41 | 21 | 16 | 0 | 4 | 26 | 2,848 | 2,181 | 1,231 | 672 | 456 | 0 | 103 | 950 | 1,804 |
| Motor freight, warehousing, and transportation services | 544 | 307 | 39 | 245 | 9 | 14 | 237 | 12,604 | 11,009 | 6,231 | 1,265 | 4,443 | 218 | 305 | 4,778 | 6,721 |
| Water transportation | 22 | 9 | 5 | 3 | 1 | 0 | 13 | 360 | 311 | 138 | 86 | 41 | 11 | 0 | 173 | 107 |
| Other transportation | 34 | 18 | 9 | 8 | 1 | 0 | 16 | 1,469 | 1,275 | 978 | 254 | 489 | 3 | 232 | 297 | 1,068 |
| Communications | 202 | 122 | 110 | 3 | 1 | 8 | 80 | 37,380 | 28,443 | 24,080 | 10,140 | 337 | 4 | 13,099 | 4,363 | 31,788 |
| Heat, light, power, water, and sanitary services | 153 | 99 | 68 | 19 | 9 | 3 | 54 | 9,623 | 9,006 | 5,965 | 3,570 | 363 | 1,043 | 989 | 3,041 | 5,593 |
| Transportation, communication, and other utilities | 1,022 | 596 | 252 | 294 | 21 | 29 | 426 | 64,284 | 52,225 | 38,623 | 15,987 | 6,629 | 1,279 | 14,728 | 13,602 | 47,081 |
| Hotels and other lodging places | 115 | 52 | 37 | 6 | 4 | 5 | 63 | 6,770 | 5,432 | 2,373 | 1,663 | 97 | 213 | 400 | 3,059 | 1,573 |
| Personal services | 79 | 42 | 16 | 24 | 2 | 0 | 37 | 2,017 | 1,818 | 1,011 | 419 | 522 | 67 | 3 | 807 | 966 |
| Automobile repairs, garages, and other miscellaneous repair services | 142 | 74 | 33 | 38 | 3 | 0 | 68 | 3,365 | 3,028 | 1,693 | 507 | 1,052 | 134 | 0 | 1,335 | 1,591 |
| Amusement and recreation services, except motion pictures | 35 | 20 | 15 | 2 | 1 | 2 | 15 | 940 | 812 | 449 | 248 | 49 | 106 | 46 | 363 | 333 |
| Medical and other health services | 250 | 155 | 128 | 9 | 7 | 11 | 95 | 13,498 | 10,818 | 6,244 | 5,410 | 306 | 110 | 418 | 4,574 | 7,639 |
| Educational services | 79 | 35 | 18 | 2 | 4 | 11 | 44 | 13,557 | 11,187 | 5,271 | 2,365 | 708 | 35 | 2,165 | 5,916 | 3,317 |
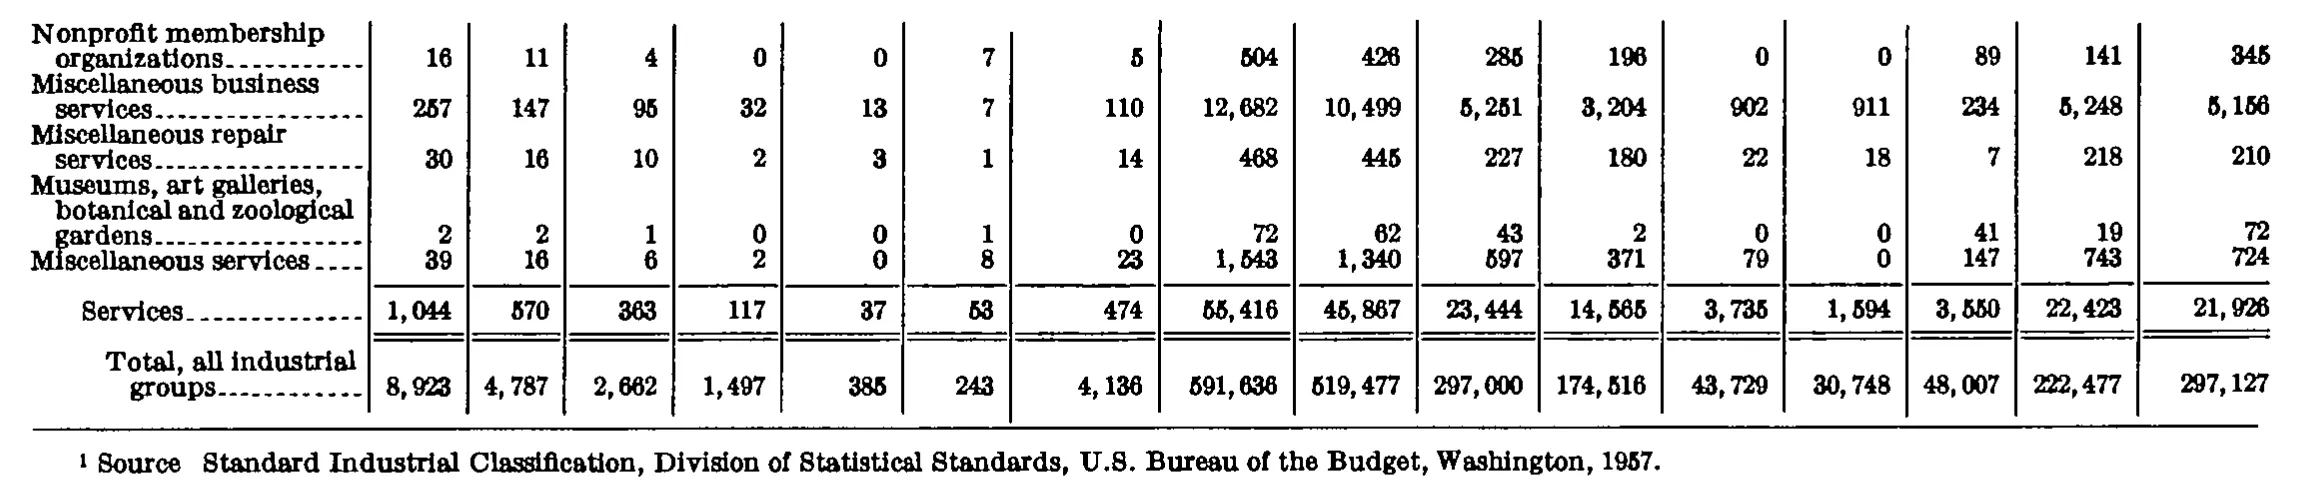
| Nonprofit membership organizations | 16 | 11 | 4 | 0 | 0 | 7 | 5 | 504 | 426 | 285 | 196 | 0 | 0 | 89 | 141 | 345 |
| Miscellaneous business services | 257 | 147 | 95 | 32 | 13 | 7 | 110 | 12,682 | 10,499 | 5,251 | 3,204 | 902 | 911 | 234 | 5,248 | 5,156 |
| Miscellaneous repair services | 30 | 16 | 10 | 2 | 3 | 1 | 14 | 468 | 445 | 227 | 180 | 22 | 18 | 7 | 218 | 210 |
| Museums, art galleries, botanical and zoological gardens | 2 | 2 | 1 | 0 | 0 | 1 | 0 | 72 | 62 | 43 | 2 | 0 | 0 | 41 | 19 | 72 |
| Miscellaneous services | 39 | 16 | 6 | 2 | 0 | 8 | 23 | 1,543 | 1,340 | 597 | 371 | 79 | 0 | 147 | 743 | 724 |
| Services | 1,044 | 570 | 363 | 117 | 37 | 53 | 474 | 55,416 | 45,867 | 23,444 | 14,565 | 3,735 | 1,594 | 3,550 | 22,423 | 21,926 |
| Total, all industrial groups | 8,923 | 4,787 | 2,662 | 1,497 | 385 | 243 | 4,136 | 591,636 | 519,477 | 297,000 | 174,516 | 43,729 | 30,748 | 48,007 | 222,477 | 297,127 |
- 1 Source Standard Industrial Classification, Division of Statistical Standards, U.S. Bureau of the Budget, Washington, 1957.
811 of 819 figures sit in a row or column sum that works out. 9 cells break a sum: 'Food and kindred products', column 11: prints 15,978, columns 12 to 15 add to 15,998; 'Printing, publishing, and alli', column 11: prints 4,805, columns 12 to 15 add to 4,205; 'Miscellaneous manufacturing', column 11: prints 5,433, columns 12 to 15 add to 5,428; 'Communications', column 11: prints 24,080, columns 12 to 15 add to 23,580; 'Educational services', column 11: prints 5,271, columns 12 to 15 add to 5,273; 'Transportation, communication,', column 13: prints 6,629, rows 'Local passenger tran' to 'Heat, light, power, ' add to 6,129; 'Services', column 13: prints 3,735, rows 'Hotels and other lod' to 'Miscellaneous servic' add to 3,737; 'Manufacturing', column 13: prints 24,729, rows 'Ordnance and accesso' to 'Miscellaneous manufa' add to 24,749; 'Manufacturing', column 15: prints 27,220, rows 'Ordnance and accesso' to 'Miscellaneous manufa' add to 26,615.
Reader’s notes
p. 273. 17 columns. The crop ends in mid-table: "Primary metal industries" is the last row on this image (its baseline touches the bottom edge) and the table continues on the page below the crop; the text of footnote 1, whose marker appears on the stub heading "Industrial group", is not visible in the crop, so `footnotes` is empty. Header wording: the second "Teamsters" column (under "Valid votes cast for unions") is printed "Team- stears", i.e. it reads "Teamstears" after repairing the line break, while the first one (under the elections panel) reads "Team- sters" = "Teamsters". I transcribed each as printed; the second may be a typesetting error in the original or a scan artifact, so verify before using the heading text. Arithmetic checks: 13 of the 15 rows reconcile exactly (won + no representative = total elections; the four union sub-columns = union total; union total + votes for no union = total valid votes cast). Two rows do not, and I transcribed them as read without correcting: - "Food and kindred products": the four union vote sub-columns (10,387 + 4,089 + 1,092 + 430) sum to 15,998, 20 more than the printed total 15,978 (which is consistent with 15,978 + 13,459 = 29,437). The most likely misread cells are AFL-CIO unions (10,387, could be 10,367) or Teamsters (4,089, could be 4,069) in the "Valid votes cast for unions" panel; the digits as printed look like 8s to me. - "Printing, publishing, and allied industries": the four union vote sub-columns (3,430 + 515 + 154 + 106) sum to 4,205, 600 less than the printed total 4,805 (which is consistent with 4,805 + 4,166 = 8,971). The shortfall of exactly 600 suggests a doubtful digit in one of AFL-CIO unions (3,430 vs 4,030), Other national unions (154 vs 754) or Other local unions (106 vs 706); I read them as 3,430, 515, 154 and 106. The scan is a 1-bit image with a serif face in which 5/6, 8/6 and 9/7 are the easiest confusions, so those two rows deserve a second look at higher magnification.
p. 274. The crop is a continuation page: no column headings are printed on it, so header_rows is empty. The table opens mid-list (the manufacturing industries before "Fabricated metal products" are on the preceding page) and is cut off after "U.S. Postal Service" (the remaining service/transportation industries and the grand total are on the following page). Seventeen columns: stub plus 16 figure columns, counted from the column rules. Suspected misprint: in "Miscellaneous manufacturing", columns 11-14 (3,612 + 899 + 864 + 53) sum to 5,428, but column 10 is printed 5,433. Column 10 is corroborated by its own row (11,682 - 6,249 = 5,433), so the discrepancy of 5 sits in one of columns 11-14. All cells are transcribed exactly as printed. Every other row reconciles on the arithmetic implied by the column structure, which confirms the column assignment of each figure: column 1 = column 2 + column 7; column 2 = sum of columns 3-6; column 9 = column 10 + column 15; column 10 = sum of columns 11-14. The "Mining" subtotal also reconciles against its four component rows in all 16 columns. Two stray specks in the scan, read as dirt and not transcribed: a comma-like mark immediately left of "40,388" ("Retail trade", column 8), and a period-like mark immediately left of "40" ("Finance, insurance, and real estate", column 3). A similar isolated speck sits in the whitespace of column 3 on the first row and in column 13 near the "Miscellaneous transportation equipment" row; neither touches a figure. Digit shapes in this 1-bit scan make 5/6, 3/8 and 2/7 the likeliest confusions; the arithmetic checks above resolve them for every value except the four noted in the "Miscellaneous manufacturing" row.
p. 275. This is a continuation page of Table 16; the body is cut off at the bottom edge immediately after "Educational services", so later rows and any footnote block (including the text of footnote marker 1 on the stub heading "Industrial group") are not on this crop. The caption line is also clipped at the right edge, but it is excluded from the grid anyway. Two doubtful cells, both read as printed but inconsistent with the surrounding arithmetic: (1) "Communications", column "Valid votes cast for unions / Teamsters": read as 337. The row's union-vote components (10,140 + 337 + 4 + 13,099 = 23,580) do not reach the printed row total 24,080, and the subtotal row "Transportation, communication, and other utilities" Teamsters votes column sums to 6,129 against a printed 6,629. Both gaps are exactly 500 and both close if this cell is 837. Either the scan has degraded an 8 into a 3 or the original is misprinted; transcribed as read. (2) "Educational services", column "Valid votes cast for unions / Teamsters": read as 708. The components 2,365 + 708 + 35 + 2,165 = 5,273 against the printed row total 5,271 (which is itself corroborated by 5,271 + 5,916 = 11,187, the printed total valid votes cast). The row closes exactly if this cell is 706. Transcribed as read. Every other row checks out internally: the four union columns sum to the "won by unions" total, that total plus "no representative chosen" equals total elections, the four valid-vote columns sum to the union votes total, and union votes plus votes for no union equal total valid votes cast. The subtotal row likewise sums its six constituent rows correctly in all columns except the Teamsters-votes column noted above. Minor typographic artifacts, not transcribed: stray ink specks appear before "11" in the "Medical and other health services" other-local-unions cell and before "15" in the "Amusement and recreation services" no-representative cell; a stray mark follows "807" in the "Personal services" total-votes-for-no-union cell. The leading characters of 1,573 ("Hotels and other lodging places", last column) print indistinctly but read as 1. The heading "AFL-CIO unions" is set with an en-dash-like hyphen after AFL in the original; written with a plain hyphen here.
p. 276. Crop is the final page of a table continued from preceding pages: no column headings are printed on this image, so header_rows is empty. The grid has 17 columns (stub + 16 numeric), counted from the column rules; the last numeric column is set off by a wider gap/rule from the fifteenth. The earlier industry rows of the "Services" division (and all preceding industrial divisions) fall above this crop and are not present here. "Services" is a division subtotal and "Total, all industrial groups" is the grand total; both are preceded by double rules in the original. Digit reads were cross-checked against the table's own arithmetic, and every relation holds exactly in all seven rows: col 1 = col 2 + col 7; col 2 = col 3 + col 4 + col 5 + col 6; col 9 = col 10 + col 15; col 10 = col 11 + col 12 + col 13 + col 14. No printed total appears to be misprinted. Footnote: the superscript 1 marker is attached to "Source" in the footnote line; any punctuation between "Source" and "Standard" (most likely a colon) is not legible in the scan, so nothing was supplied there. The faded typeface makes 5/6 easily confusable in this scan, but the arithmetic checks above resolve every such cell in columns 1-7 and 9-15; columns 8 and 16 ("591,636"/"297,127" in the total row, "55,416"/"21,926" in the Services row) cannot be verified by internal arithmetic from this crop alone, though each col 8 value is consistently greater than or equal to its col 9 value as expected.
Source image
Source data: U.S. NLRB Annual Reports (public domain). Reconstruction by NLRB Stats Archive. Read by claude-opus-5 (effort max, prompt extract_v1) from the 300-dpi scan; stitched by page. Updated October 2026.