NLRB Stats Archive › Annual Reports › FY1972 › Standard Federal Administrative Regional Distribution of Representation Elections Held in Cases Closed, Fiscal Year 1972
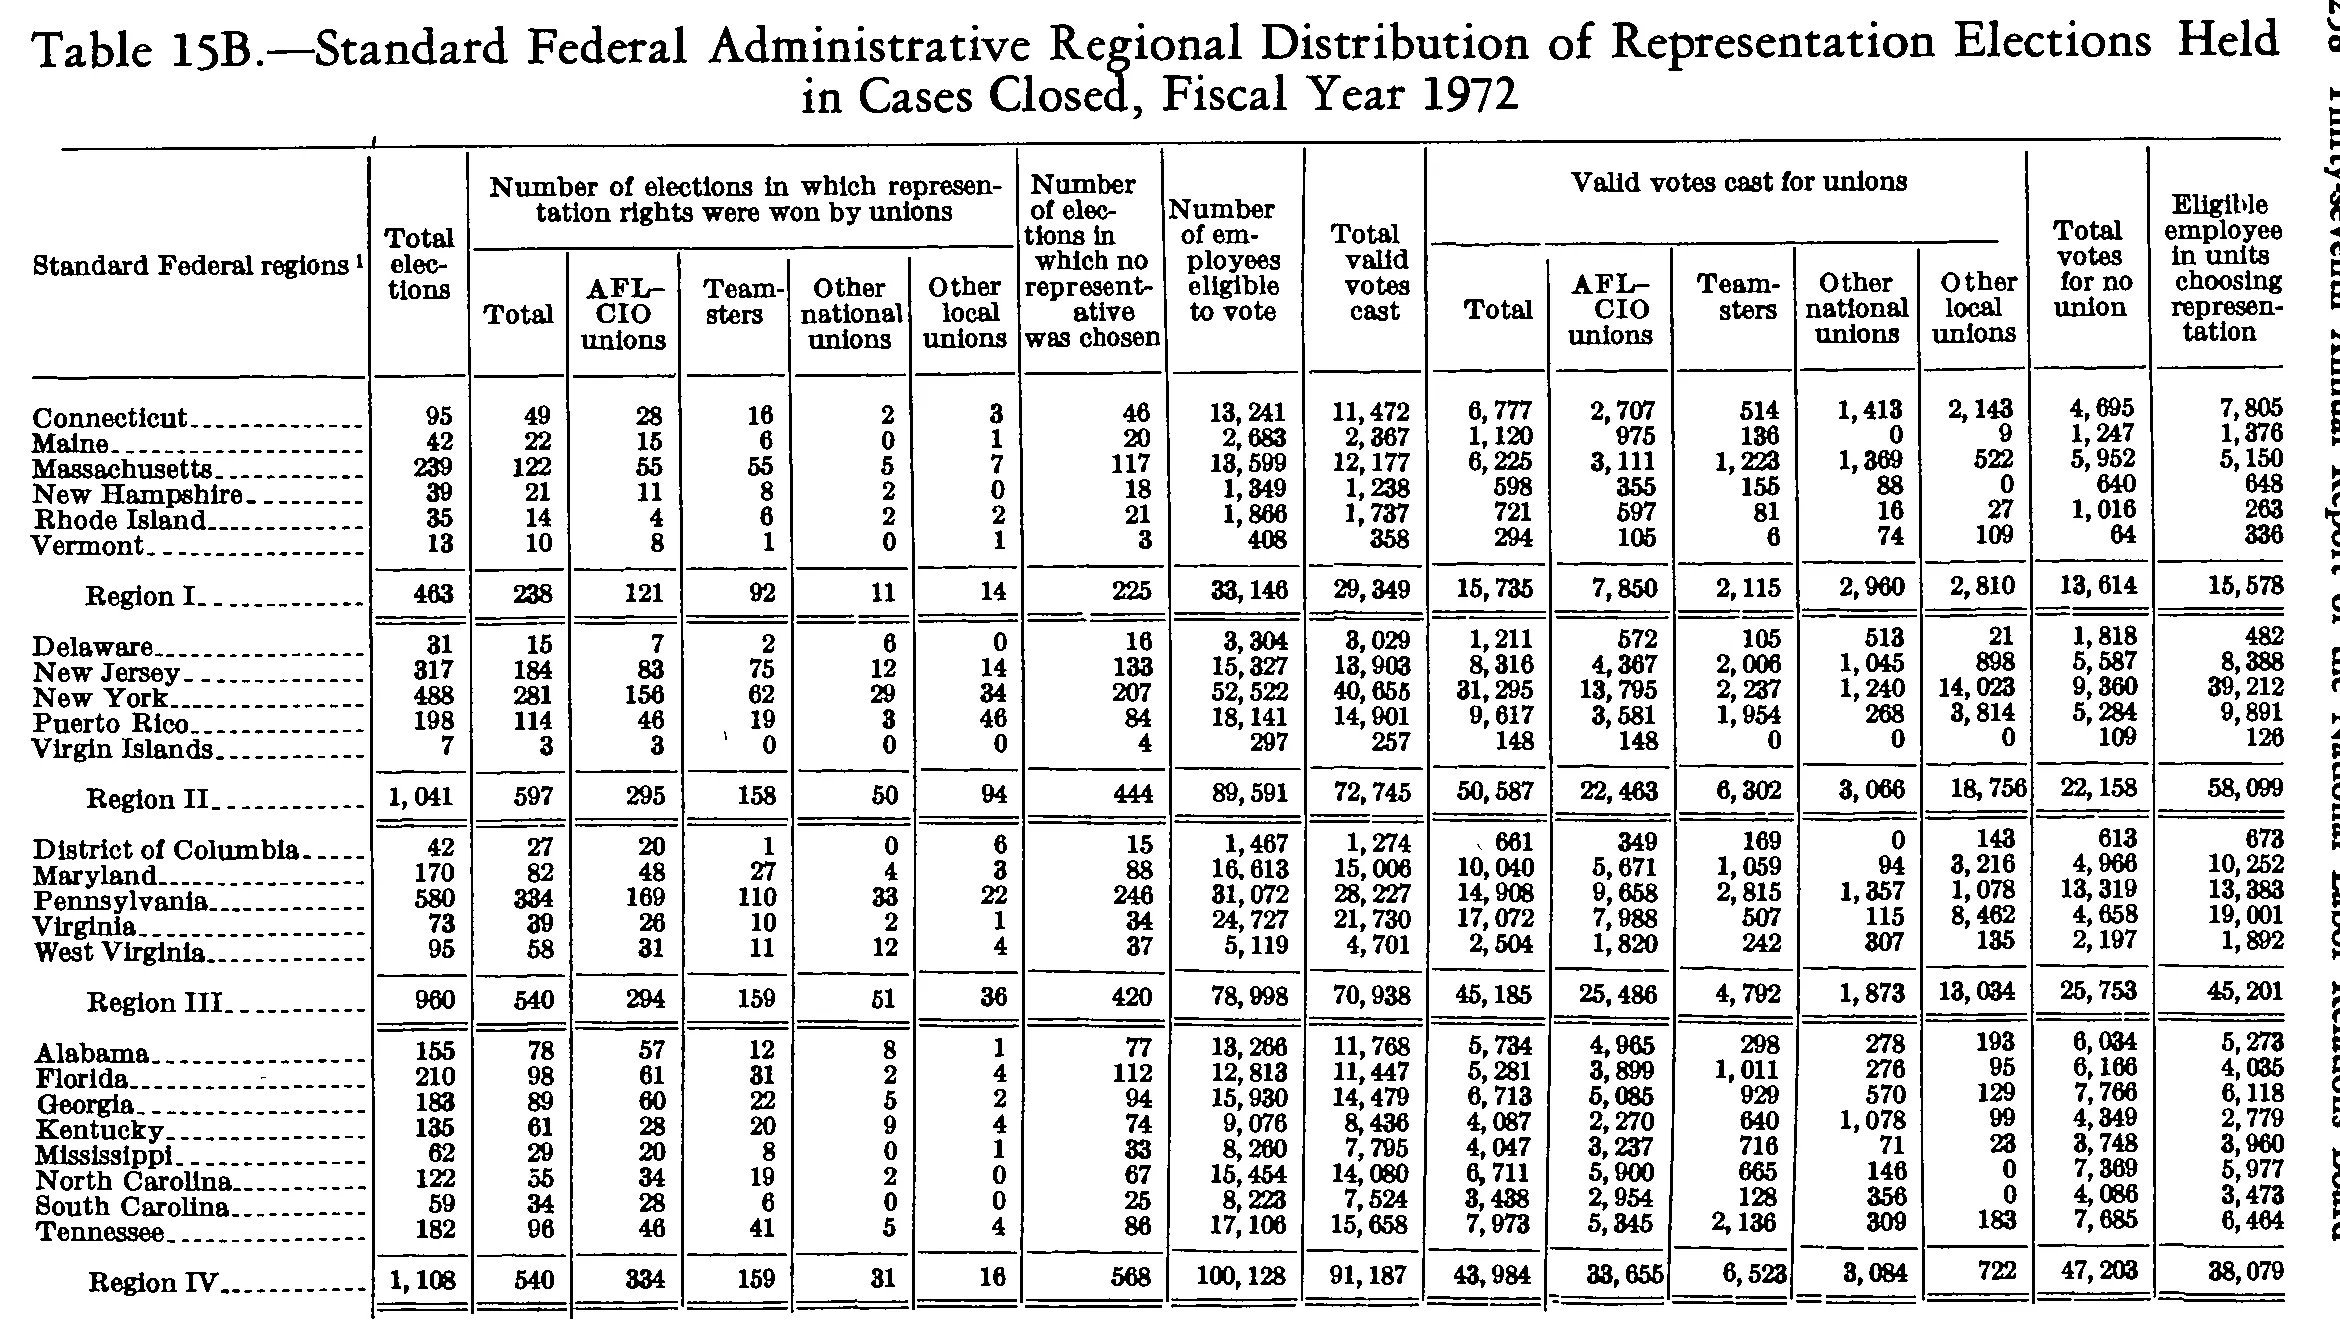
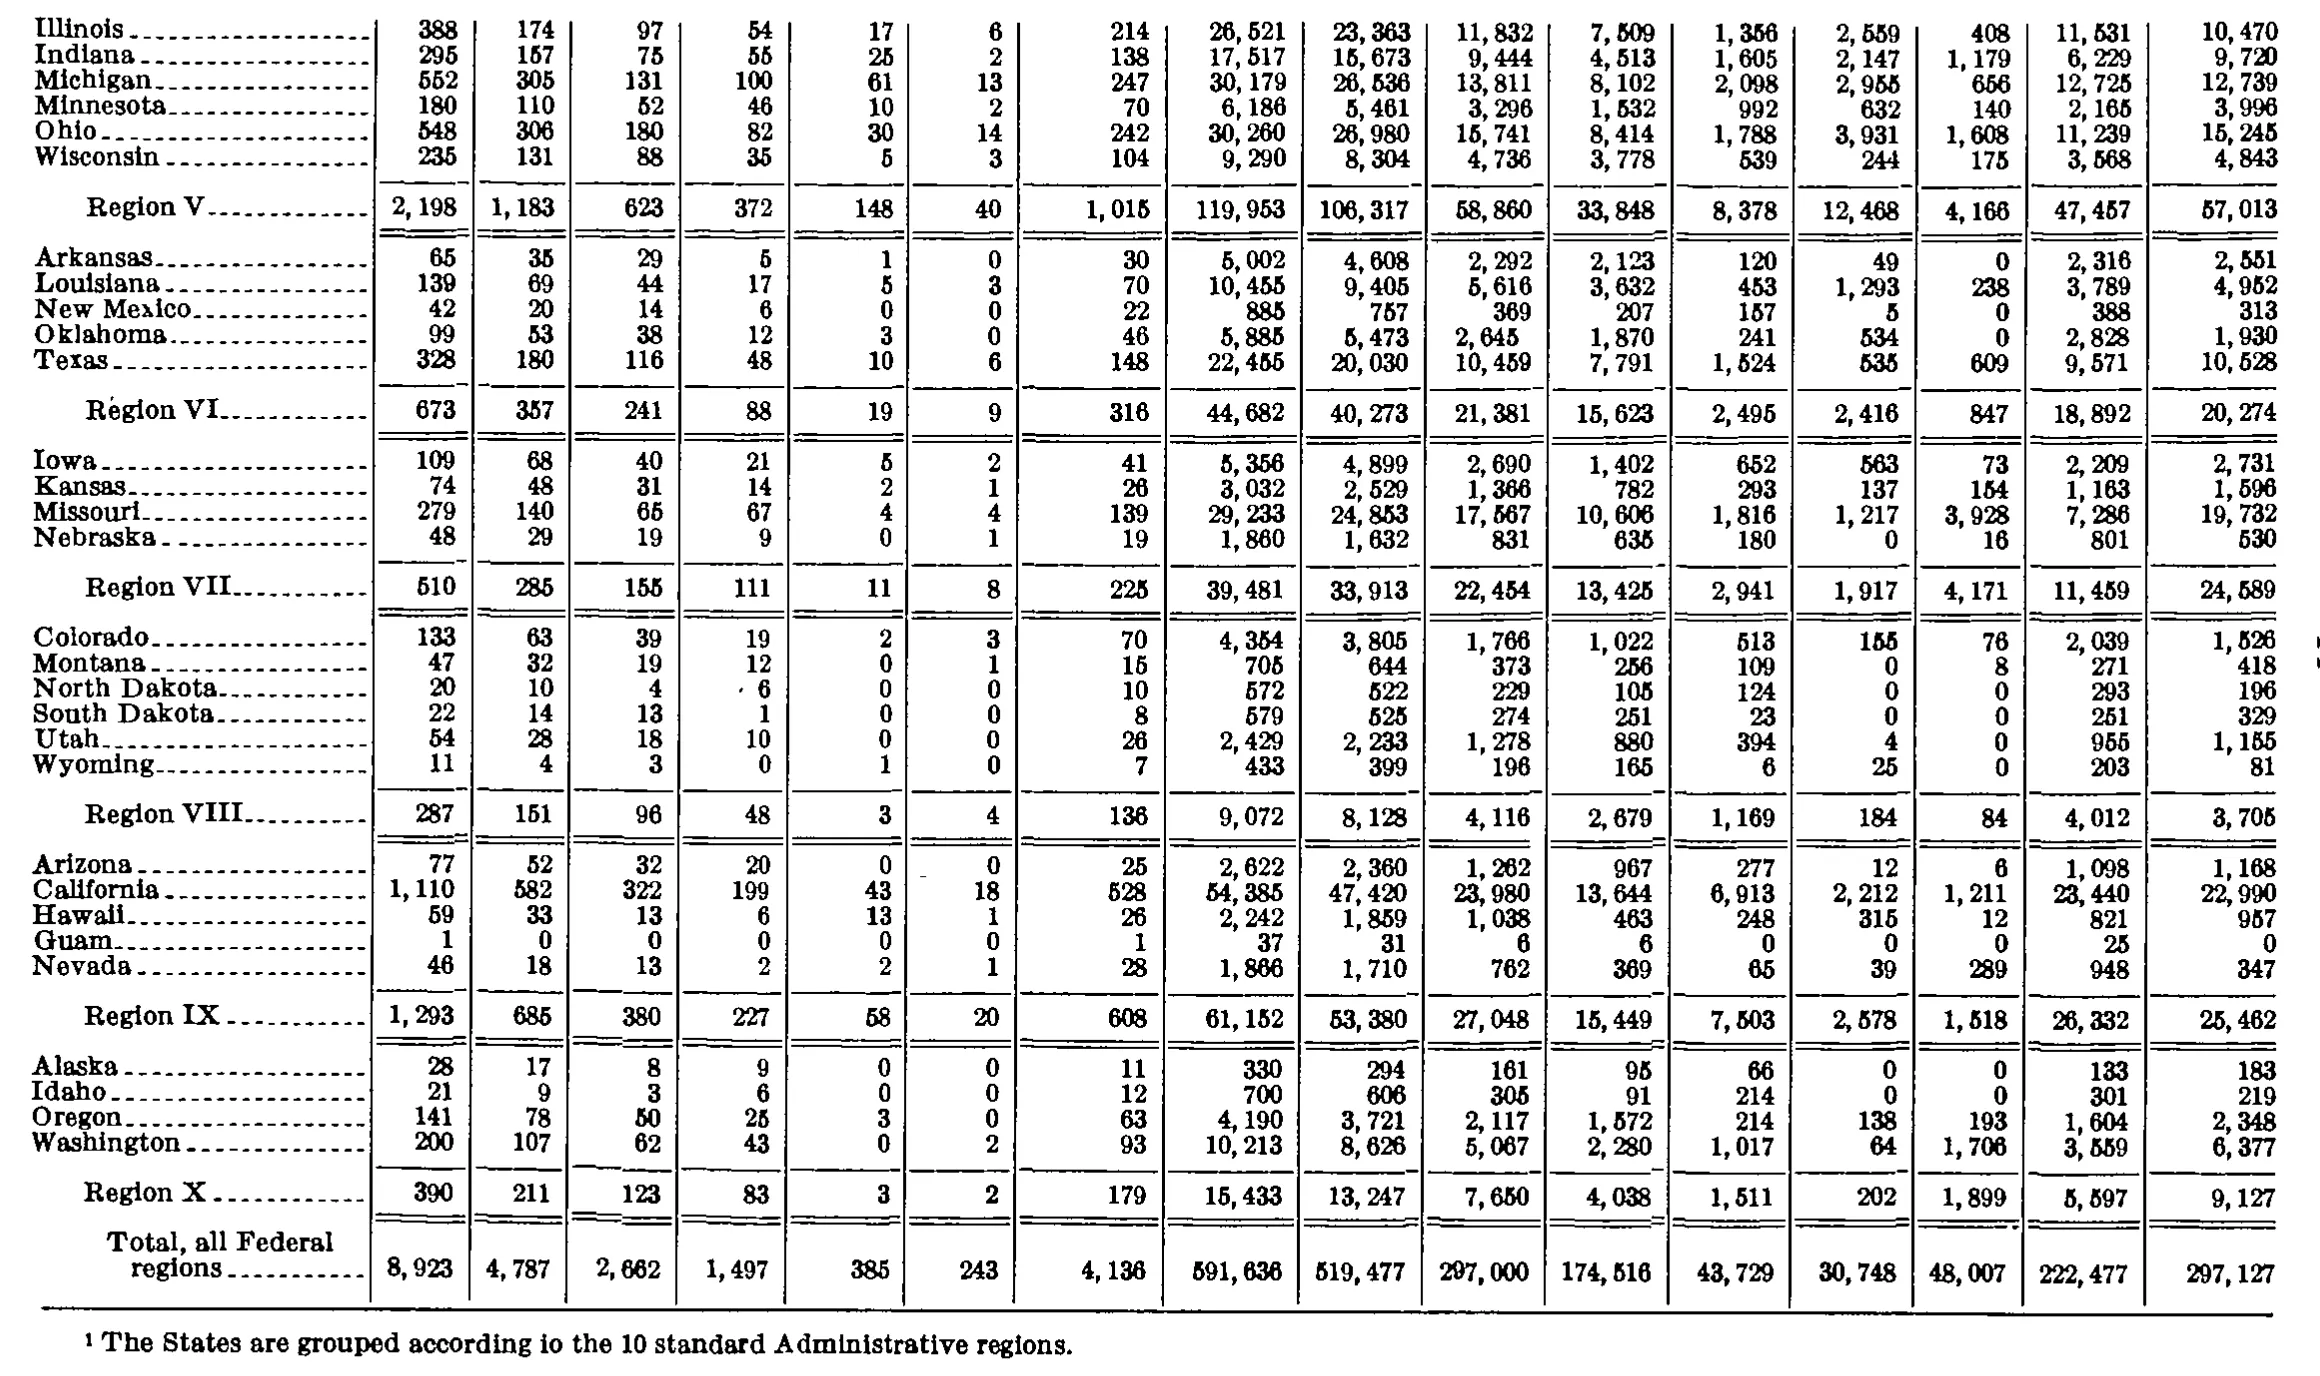
Standard Federal Administrative Regional Distribution of Representation Elections Held in Cases Closed, Fiscal Year 1972
Stitched from pp. 271–272.
| Standard Federal regions | Total elections | Number of elections in which representation rights were won by unions | Number of elections in which no representative was chosen | Number of employees eligible to vote | Total valid votes cast | Valid votes cast for unions | Total votes for no union | Eligible employee in units choosing representation | ||||||||
|---|---|---|---|---|---|---|---|---|---|---|---|---|---|---|---|---|
| Standard Federal regions | Total elections | Total | AFL-CIO unions | Teamsters | Other national unions | Other local unions | Number of elections in which no representative was chosen | Number of employees eligible to vote | Total valid votes cast | Total | AFL-CIO unions | Teamsters | Other national unions | Other local unions | Total votes for no union | Eligible employee in units choosing representation |
| Connecticut | 95 | 49 | 28 | 16 | 2 | 3 | 46 | 13,241 | 11,472 | 6,777 | 2,707 | 514 | 1,413 | 2,143 | 4,695 | 7,805 |
| Maine | 42 | 22 | 15 | 6 | 0 | 1 | 20 | 2,683 | 2,367 | 1,120 | 975 | 136 | 0 | 9 | 1,247 | 1,376 |
| Massachusetts | 239 | 122 | 55 | 55 | 5 | 7 | 117 | 13,599 | 12,177 | 6,225 | 3,111 | 1,223 | 1,369 | 522 | 5,952 | 5,150 |
| New Hampshire | 39 | 21 | 11 | 8 | 2 | 0 | 18 | 1,349 | 1,238 | 598 | 355 | 155 | 88 | 0 | 640 | 648 |
| Rhode Island | 35 | 14 | 4 | 6 | 2 | 2 | 21 | 1,866 | 1,737 | 721 | 597 | 81 | 16 | 27 | 1,016 | 263 |
| Vermont | 13 | 10 | 8 | 1 | 0 | 1 | 3 | 408 | 358 | 294 | 105 | 6 | 74 | 109 | 64 | 336 |
| Region I | 463 | 238 | 121 | 92 | 11 | 14 | 225 | 33,146 | 29,349 | 15,735 | 7,850 | 2,115 | 2,960 | 2,810 | 13,614 | 15,578 |
| Delaware | 31 | 15 | 7 | 2 | 6 | 0 | 16 | 3,304 | 3,029 | 1,211 | 572 | 105 | 513 | 21 | 1,818 | 482 |
| New Jersey | 317 | 184 | 83 | 75 | 12 | 14 | 133 | 15,327 | 13,903 | 8,316 | 4,367 | 2,006 | 1,045 | 898 | 5,587 | 8,388 |
| New York | 488 | 281 | 156 | 62 | 29 | 34 | 207 | 52,522 | 40,655 | 31,295 | 13,795 | 2,237 | 1,240 | 14,023 | 9,360 | 39,212 |
| Puerto Rico | 198 | 114 | 46 | 19 | 3 | 46 | 84 | 18,141 | 14,901 | 9,617 | 3,581 | 1,954 | 268 | 3,814 | 5,284 | 9,891 |
| Virgin Islands | 7 | 3 | 3 | 0 | 0 | 0 | 4 | 297 | 257 | 148 | 148 | 0 | 0 | 0 | 109 | 126 |
| Region II | 1,041 | 597 | 295 | 158 | 50 | 94 | 444 | 89,591 | 72,745 | 50,587 | 22,463 | 6,302 | 3,066 | 18,756 | 22,158 | 58,099 |
| District of Columbia | 42 | 27 | 20 | 1 | 0 | 6 | 15 | 1,467 | 1,274 | 661 | 349 | 169 | 0 | 143 | 613 | 673 |
| Maryland | 170 | 82 | 48 | 27 | 4 | 3 | 88 | 16,613 | 15,006 | 10,040 | 5,671 | 1,059 | 94 | 3,216 | 4,966 | 10,252 |
| Pennsylvania | 580 | 334 | 169 | 110 | 33 | 22 | 246 | 31,072 | 28,227 | 14,908 | 9,658 | 2,815 | 1,357 | 1,078 | 13,319 | 13,383 |
| Virginia | 73 | 39 | 26 | 10 | 2 | 1 | 34 | 24,727 | 21,730 | 17,072 | 7,988 | 507 | 115 | 8,462 | 4,658 | 19,001 |
| West Virginia | 95 | 58 | 31 | 11 | 12 | 4 | 37 | 5,119 | 4,701 | 2,504 | 1,820 | 242 | 307 | 135 | 2,197 | 1,892 |
| Region III | 960 | 540 | 294 | 159 | 51 | 36 | 420 | 78,998 | 70,938 | 45,185 | 25,486 | 4,792 | 1,873 | 13,034 | 25,753 | 45,201 |
| Alabama | 155 | 78 | 57 | 12 | 8 | 1 | 77 | 13,266 | 11,768 | 5,734 | 4,965 | 298 | 278 | 193 | 6,034 | 5,273 |
| Florida | 210 | 98 | 61 | 31 | 2 | 4 | 112 | 12,813 | 11,447 | 5,281 | 3,899 | 1,011 | 276 | 95 | 6,166 | 4,035 |
| Georgia | 183 | 89 | 60 | 22 | 5 | 2 | 94 | 15,930 | 14,479 | 6,713 | 5,085 | 929 | 570 | 129 | 7,766 | 6,118 |
| Kentucky | 135 | 61 | 28 | 20 | 9 | 4 | 74 | 9,076 | 8,436 | 4,087 | 2,270 | 640 | 1,078 | 99 | 4,349 | 2,779 |
| Mississippi | 62 | 29 | 20 | 8 | 0 | 1 | 33 | 8,260 | 7,795 | 4,047 | 3,237 | 716 | 71 | 23 | 3,748 | 3,960 |
| North Carolina | 122 | 55 | 34 | 19 | 2 | 0 | 67 | 15,454 | 14,080 | 6,711 | 5,900 | 665 | 146 | 0 | 7,369 | 5,977 |
| South Carolina | 59 | 34 | 28 | 6 | 0 | 0 | 25 | 8,223 | 7,524 | 3,438 | 2,954 | 128 | 356 | 0 | 4,086 | 3,473 |
| Tennessee | 182 | 96 | 46 | 41 | 5 | 4 | 86 | 17,106 | 15,658 | 7,973 | 5,345 | 2,136 | 309 | 183 | 7,685 | 6,464 |
| Region IV | 1,108 | 540 | 334 | 159 | 31 | 16 | 568 | 100,128 | 91,187 | 43,984 | 33,655 | 6,523 | 3,084 | 722 | 47,203 | 38,079 |
| Illinois | 388 | 174 | 97 | 54 | 17 | 6 | 214 | 26,521 | 23,363 | 11,832 | 7,509 | 1,356 | 2,559 | 408 | 11,531 | 10,470 |
| Indiana | 295 | 157 | 75 | 55 | 25 | 2 | 138 | 17,517 | 15,673 | 9,444 | 4,513 | 1,605 | 2,147 | 1,179 | 6,229 | 9,720 |
| Michigan | 552 | 305 | 131 | 100 | 61 | 13 | 247 | 30,179 | 26,536 | 13,811 | 8,102 | 2,098 | 2,955 | 656 | 12,725 | 12,739 |
| Minnesota | 180 | 110 | 52 | 46 | 10 | 2 | 70 | 6,186 | 5,461 | 3,296 | 1,532 | 992 | 632 | 140 | 2,165 | 3,996 |
| Ohio | 548 | 306 | 180 | 82 | 30 | 14 | 242 | 30,260 | 26,980 | 15,741 | 8,414 | 1,788 | 3,931 | 1,608 | 11,239 | 15,245 |
| Wisconsin | 235 | 131 | 88 | 35 | 5 | 3 | 104 | 9,290 | 8,304 | 4,736 | 3,778 | 539 | 244 | 175 | 3,568 | 4,843 |
| Region V | 2,198 | 1,183 | 623 | 372 | 148 | 40 | 1,015 | 119,953 | 106,317 | 58,860 | 33,848 | 8,378 | 12,468 | 4,166 | 47,457 | 57,013 |
| Arkansas | 65 | 35 | 29 | 5 | 1 | 0 | 30 | 5,002 | 4,608 | 2,292 | 2,123 | 120 | 49 | 0 | 2,316 | 2,551 |
| Louisiana | 139 | 69 | 44 | 17 | 5 | 3 | 70 | 10,455 | 9,405 | 5,616 | 3,632 | 453 | 1,293 | 238 | 3,789 | 4,952 |
| New Mexico | 42 | 20 | 14 | 6 | 0 | 0 | 22 | 885 | 757 | 369 | 207 | 157 | 5 | 0 | 388 | 313 |
| Oklahoma | 99 | 53 | 38 | 12 | 3 | 0 | 46 | 5,885 | 5,473 | 2,645 | 1,870 | 241 | 534 | 0 | 2,828 | 1,930 |
| Texas | 328 | 180 | 116 | 48 | 10 | 6 | 148 | 22,455 | 20,030 | 10,459 | 7,791 | 1,524 | 535 | 609 | 9,571 | 10,528 |
| Region VI | 673 | 357 | 241 | 88 | 19 | 9 | 316 | 44,682 | 40,273 | 21,381 | 15,623 | 2,495 | 2,416 | 847 | 18,892 | 20,274 |
| Iowa | 109 | 68 | 40 | 21 | 5 | 2 | 41 | 5,356 | 4,899 | 2,690 | 1,402 | 652 | 563 | 73 | 2,209 | 2,731 |
| Kansas | 74 | 48 | 31 | 14 | 2 | 1 | 26 | 3,032 | 2,529 | 1,366 | 782 | 293 | 137 | 154 | 1,163 | 1,596 |
| Missouri | 279 | 140 | 65 | 67 | 4 | 4 | 139 | 29,233 | 24,853 | 17,567 | 10,606 | 1,816 | 1,217 | 3,928 | 7,286 | 19,732 |
| Nebraska | 48 | 29 | 19 | 9 | 0 | 1 | 19 | 1,860 | 1,632 | 831 | 635 | 180 | 0 | 16 | 801 | 530 |
| Region VII | 510 | 285 | 155 | 111 | 11 | 8 | 225 | 39,481 | 33,913 | 22,454 | 13,425 | 2,941 | 1,917 | 4,171 | 11,459 | 24,589 |
| Colorado | 133 | 63 | 39 | 19 | 2 | 3 | 70 | 4,354 | 3,805 | 1,766 | 1,022 | 513 | 155 | 76 | 2,039 | 1,526 |
| Montana | 47 | 32 | 19 | 12 | 0 | 1 | 15 | 705 | 644 | 373 | 256 | 109 | 0 | 8 | 271 | 418 |
| North Dakota | 20 | 10 | 4 | 6 | 0 | 0 | 10 | 572 | 522 | 229 | 105 | 124 | 0 | 0 | 293 | 196 |
| South Dakota | 22 | 14 | 13 | 1 | 0 | 0 | 8 | 579 | 525 | 274 | 251 | 23 | 0 | 0 | 251 | 329 |
| Utah | 54 | 28 | 18 | 10 | 0 | 0 | 26 | 2,429 | 2,233 | 1,278 | 880 | 394 | 4 | 0 | 955 | 1,155 |
| Wyoming | 11 | 4 | 3 | 0 | 1 | 0 | 7 | 433 | 399 | 196 | 165 | 6 | 25 | 0 | 203 | 81 |
| Region VIII | 287 | 151 | 96 | 48 | 3 | 4 | 136 | 9,072 | 8,128 | 4,116 | 2,679 | 1,169 | 184 | 84 | 4,012 | 3,705 |
| Arizona | 77 | 52 | 32 | 20 | 0 | 0 | 25 | 2,622 | 2,360 | 1,262 | 967 | 277 | 12 | 6 | 1,098 | 1,168 |
| California | 1,110 | 582 | 322 | 199 | 43 | 18 | 528 | 54,385 | 47,420 | 23,980 | 13,644 | 6,913 | 2,212 | 1,211 | 23,440 | 22,990 |
| Hawaii | 59 | 33 | 13 | 6 | 13 | 1 | 26 | 2,242 | 1,859 | 1,038 | 463 | 248 | 315 | 12 | 821 | 957 |
| Guam | 1 | 0 | 0 | 0 | 0 | 0 | 1 | 37 | 31 | 6 | 6 | 0 | 0 | 0 | 25 | 12 |
| Nevada | 46 | 18 | 13 | 2 | 2 | 1 | 28 | 1,866 | 1,710 | 762 | 369 | 65 | 39 | 289 | 948 | 347 |
| Region IX | 1,293 | 685 | 380 | 227 | 58 | 20 | 608 | 61,152 | 53,380 | 27,048 | 15,449 | 7,503 | 2,578 | 1,518 | 26,332 | 25,462 |
| Alaska | 28 | 17 | 8 | 9 | 0 | 0 | 11 | 330 | 294 | 161 | 95 | 66 | 0 | 0 | 133 | 183 |
| Idaho | 21 | 9 | 3 | 6 | 0 | 0 | 12 | 700 | 606 | 305 | 91 | 214 | 0 | 0 | 301 | 219 |
| Oregon | 141 | 78 | 50 | 25 | 3 | 0 | 63 | 4,190 | 3,721 | 2,117 | 1,572 | 214 | 138 | 193 | 1,604 | 2,348 |
| Washington | 200 | 107 | 62 | 43 | 0 | 2 | 93 | 10,213 | 8,626 | 5,067 | 2,280 | 1,017 | 64 | 1,706 | 3,559 | 6,377 |
| Region X | 390 | 211 | 123 | 83 | 3 | 2 | 179 | 15,433 | 13,247 | 7,650 | 4,038 | 1,511 | 202 | 1,899 | 5,597 | 9,127 |
| Total, all Federal regions | 8,923 | 4,787 | 2,662 | 1,497 | 385 | 243 | 4,136 | 591,636 | 519,477 | 297,000 | 174,516 | 43,729 | 30,748 | 48,007 | 222,477 | 297,127 |
- 1 The States are grouped according to the 10 standard Administrative regions.
970 of 975 figures sit in a row or column sum that works out. 1 cell breaks a sum: 'Region IX', column 17: prints 25,462, rows 'Arizona' to 'Nevada' add to 25,474.
Reader’s notes
p. 271. The crop ends after the "Region IV" total line; the table continues on the following page (Regions V onward), so this is a partial table. The stub heading carries a raised footnote marker 1 ("Standard Federal regions 1"), but no footnote text is printed within the crop, so `footnotes` is empty. Doubtful cell: Delaware, "Total valid votes cast". At this scan resolution the leading glyph could be read as either 3 or 8 ("3,029" vs "8,029"). I transcribed it as 3,029 because two independent arithmetic checks require that value: the row's own union components plus no-union votes (572+105+513+21 = 1,211; 1,211+1,818 = 3,029), and the Region II column total (3,029+13,903+40,655+14,901+257 = 72,745, the printed Region II figure). An 8,029 reading would also exceed Delaware's 3,304 eligible employees. No other anomalies: every union sub-column sums to its printed "Total", union total plus "Total votes for no union" equals "Total valid votes cast" in every row, and all four region lines (I-IV) agree exactly with the sums of their member states in all 16 numeric columns. The printed heading reads "AFL-CIO" with an en-dash-like rule; transcribed with a plain hyphen. End-of-line hyphenations in the headings ("Team-sters", "repre-sentation", "em-ployees", "represent-ative", "elec-tions") have been rejoined.
p. 272. The crop is a continuation page: no column headings are printed on it, so header_rows is empty. The grid has 17 columns (stub + 16 numeric). The table body begins mid-Region V, so Regions I-IV and the first states of Region V are on the preceding page; the stub heading and the footnote reference marker 1 (which belongs to a heading or caption not shown) are likewise off this crop. Doubtful cell: Guam, last (16th) column, transcribed as 12 as it appears. The printed Region IX subtotal in that column, 25,462, is exactly the sum of Arizona 1,168 + California 22,990 + Hawaii 957 + Nevada 347 with nothing for Guam, i.e. it is 12 short of the sum including Guam's 12. Every other cell of the Guam row and of Region IX reconciles, so either Guam's final cell should read 0 (and 12 is a misreading of a faint/stray mark), or Hawaii's final cell is 945 rather than 957, or the printed Region IX subtotal is in error. Transcribed as seen, uncorrected. All other values were cross-checked against the table's internal arithmetic and are consistent: in every row col1 = col2 + col7, col2 = col3+col4+col5+col6, col9 = col10 + col15, col10 = col11+col12+col13+col14; and every region subtotal equals the sum of its states in all 16 columns (the only exception is the Guam/Region IX column-16 case above). Scan artifacts, not transcribed: a stray speck immediately left of the 6 in North Dakota, column 4; a short dash-like mark between columns 5 and 6 in the Arizona row; and two small ink marks in the right margin beyond the table's right rule, level with the Colorado and Montana rows. In the footnote, degraded type makes the word "to" look like "io" ("according io the 10 standard"); it is transcribed as "to".
Source image
Source data: U.S. NLRB Annual Reports (public domain). Reconstruction by NLRB Stats Archive. Read by claude-opus-5 (effort max, prompt extract_v1) from the 300-dpi scan; stitched by page. Updated October 2026.