NLRB Stats Archive › Annual Reports › FY1972 › Geographic distribution of representation elections held in cases closed
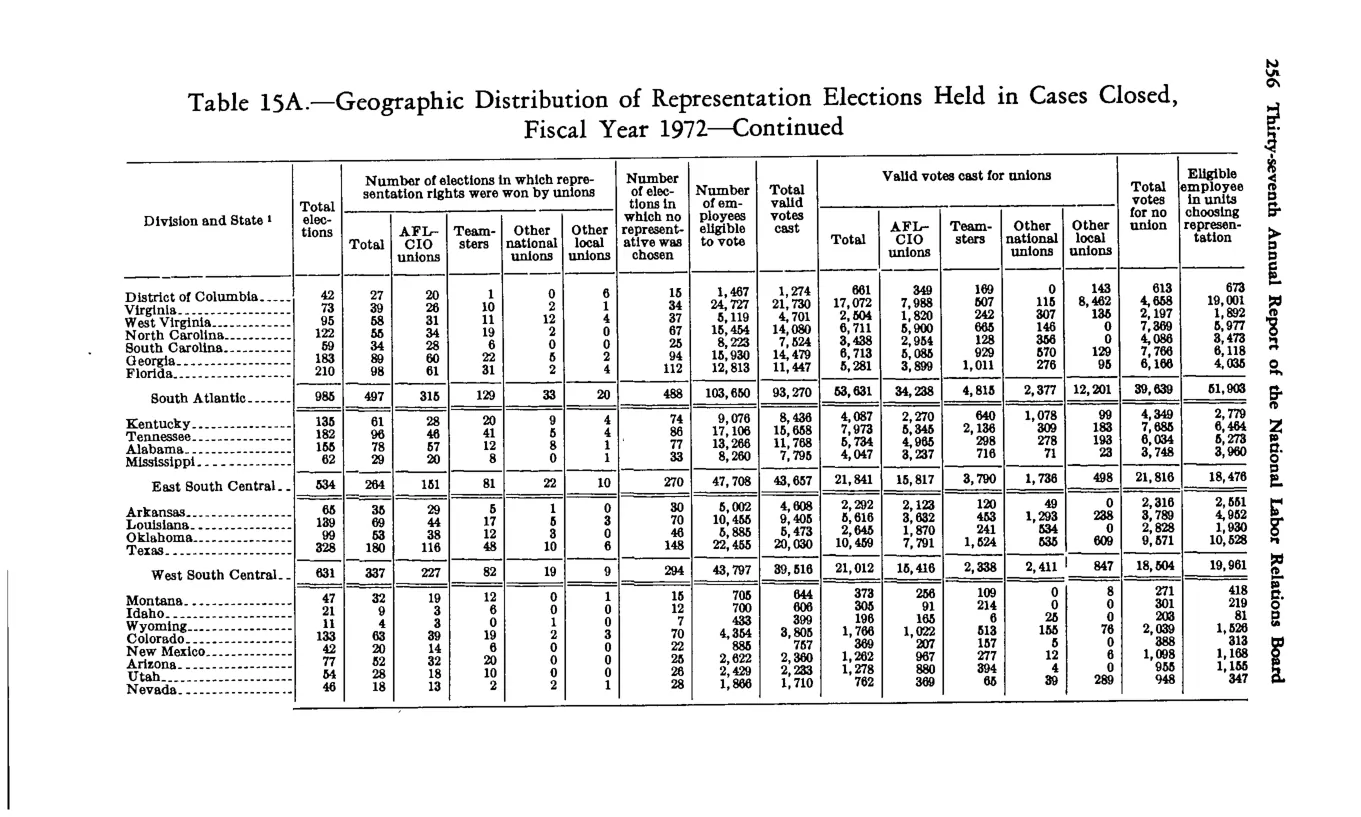
Geographic distribution of representation elections held in cases closed
| Division and State | Total elections | Total won | AFL-CIO unions | Teamsters | Other national unions | Other local unions | No representative chosen | Number of employees eligible to vote | Total valid votes cast | Total | AFL-CIO unions | Teamsters | Other national unions | Other local unions | Total votes for no union | Eligible employees in units choosing representation | |
|---|---|---|---|---|---|---|---|---|---|---|---|---|---|---|---|---|---|
| South Atlantic | 955 | 497 | 315 | 129 | 33 | 20 | 458 | 103,450 | 93,209 | 53,541 | 34,235 | 8,547 | 5,816 | 2,377 | 12,101 | 29,632 | 51,046 |
| East South Central | 534 | 264 | 151 | 81 | 22 | 10 | 270 | 47,798 | 43,657 | 21,841 | 15,817 | 3,790 | 1,788 | 458 | 21,816 | 18,478 | |
| West South Central | 631 | 337 | 227 | 83 | 10 | 17 | 294 | 43,797 | 39,316 | 21,012 | 15,416 | 2,338 | 2,411 | 847 | 18,304 | 19,801 |
Source image
Source data: U.S. NLRB Annual Reports (public domain). Reconstruction by NLRB Stats Archive. Updated June 2026.