NLRB Stats Archive › Annual Reports › FY1972 › Analysis of Methods of Disposition of Representation and Union Deauthorization Cases Closed, Fiscal Year 1972
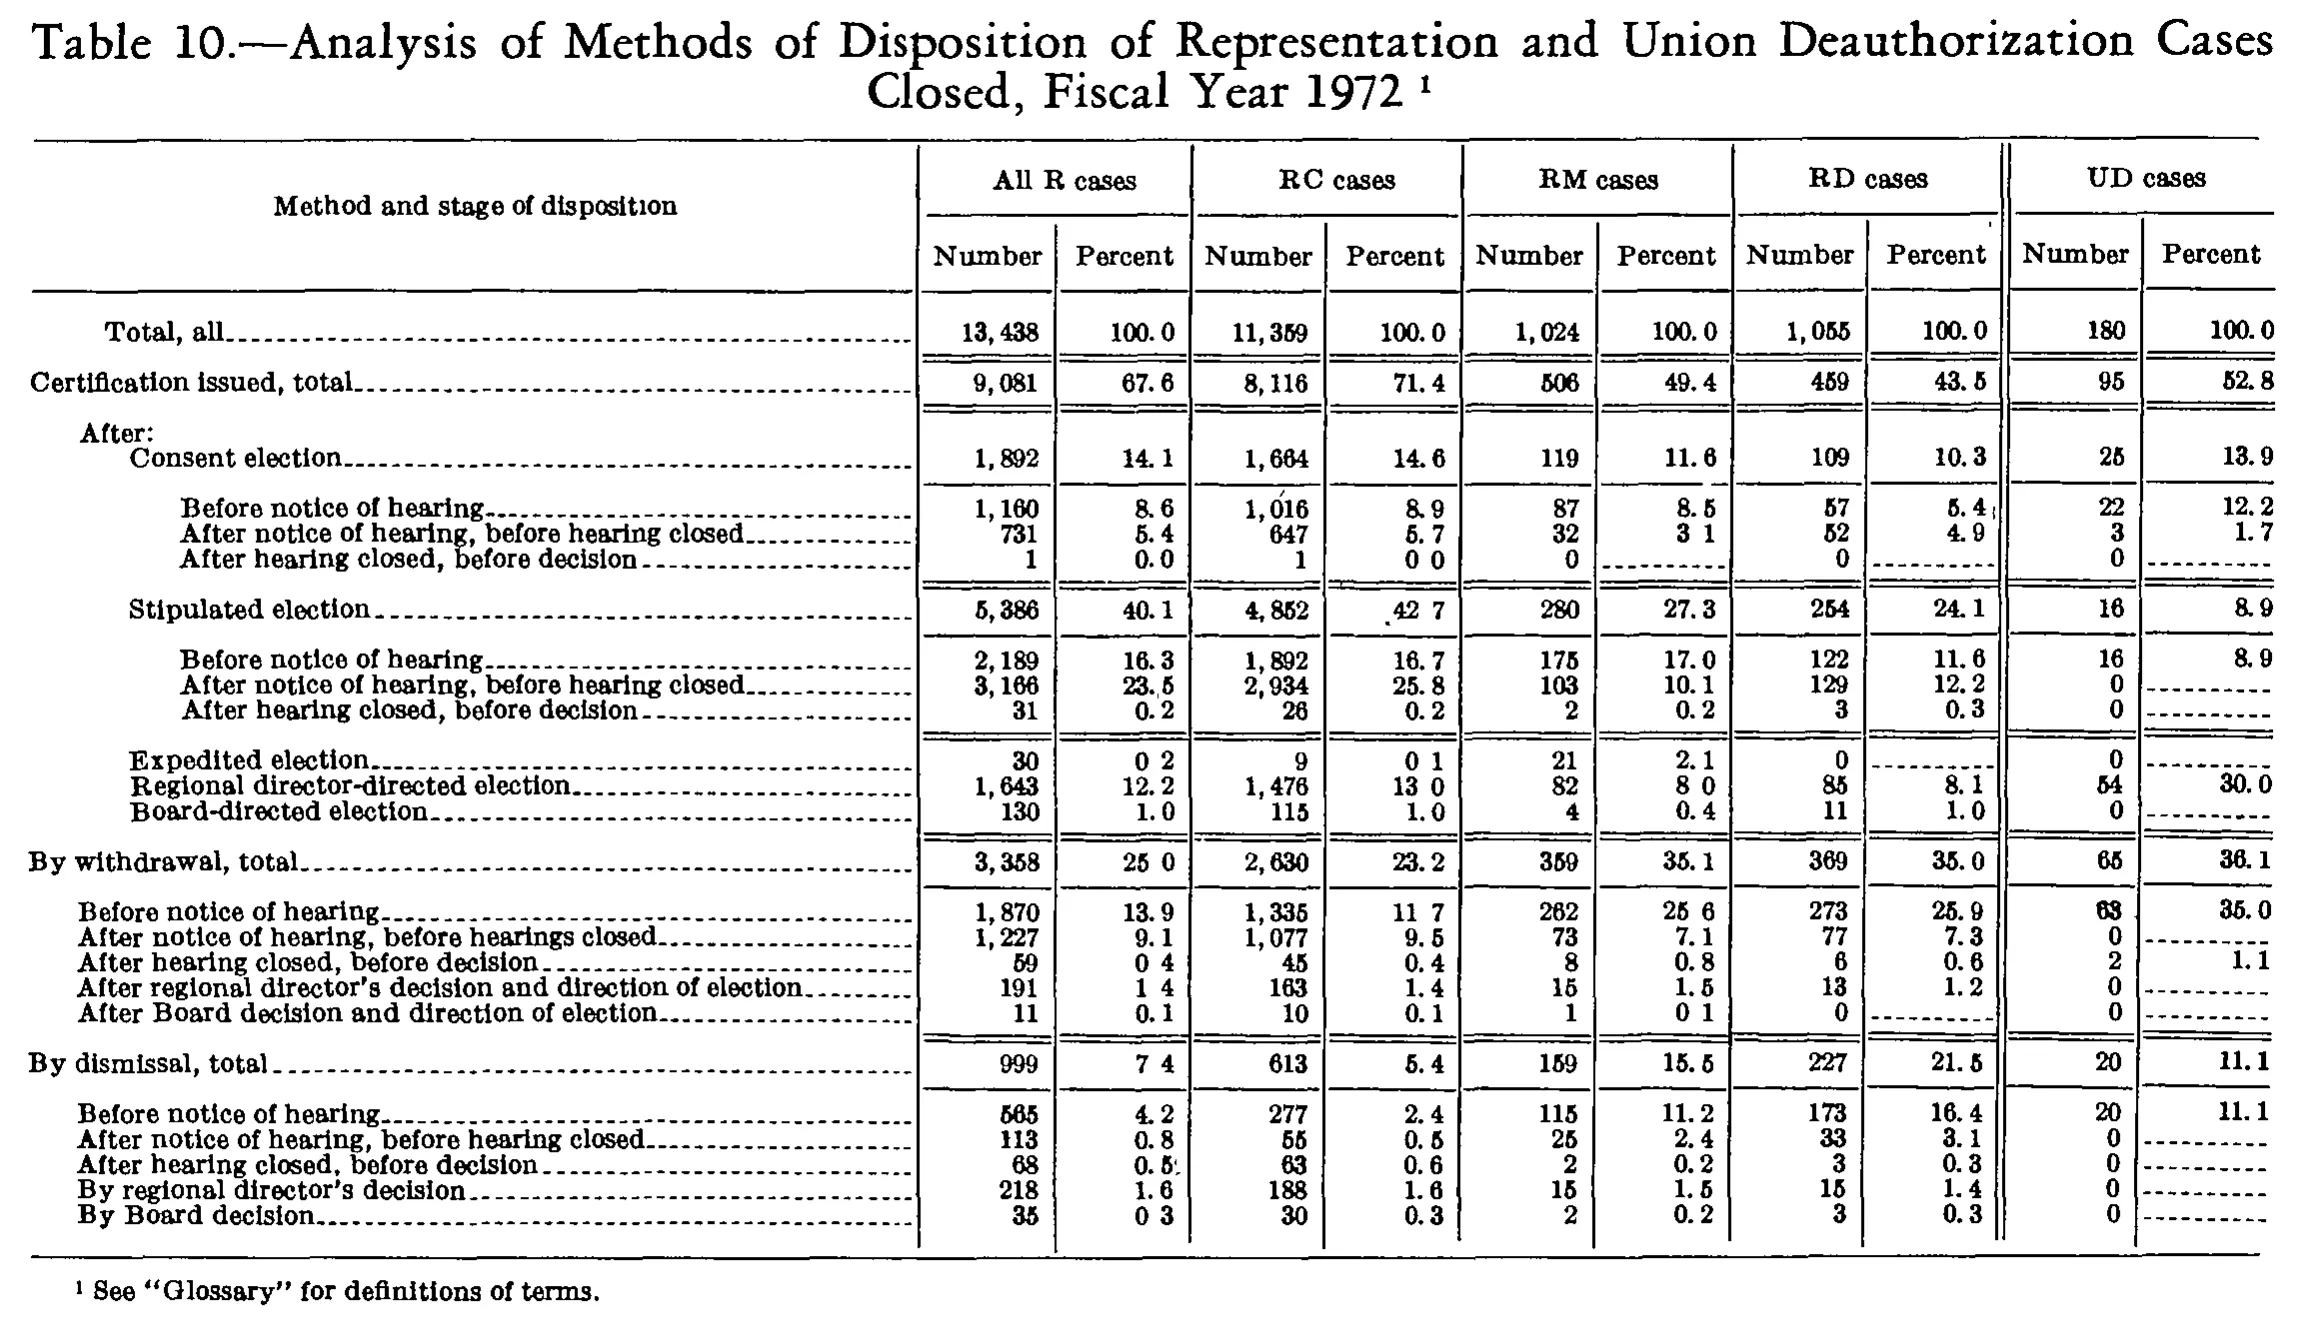
Analysis of Methods of Disposition of Representation and Union Deauthorization Cases Closed, Fiscal Year 1972
| Method and stage of disposition | All R cases | RC cases | RM cases | RD cases | UD cases | |||||
|---|---|---|---|---|---|---|---|---|---|---|
| Method and stage of disposition | Number | Percent | Number | Percent | Number | Percent | Number | Percent | Number | Percent |
| Total, all | 13,438 | 100.0 | 11,359 | 100.0 | 1,024 | 100.0 | 1,055 | 100.0 | 180 | 100.0 |
| Certification issued, total | 9,081 | 67.6 | 8,116 | 71.4 | 506 | 49.4 | 459 | 43.5 | 95 | 52.8 |
| After: | ||||||||||
| Consent election | 1,892 | 14.1 | 1,664 | 14.6 | 119 | 11.6 | 109 | 10.3 | 25 | 13.9 |
| Before notice of hearing | 1,160 | 8.6 | 1,016 | 8.9 | 87 | 8.5 | 57 | 5.4 | 22 | 12.2 |
| After notice of hearing, before hearing closed | 731 | 5.4 | 647 | 5.7 | 32 | 3.1 | 52 | 4.9 | 3 | 1.7 |
| After hearing closed, before decision | 1 | 0.0 | 1 | 0.0 | 0 | 0 | 0 | |||
| Stipulated election | 5,386 | 40.1 | 4,852 | 42.7 | 280 | 27.3 | 254 | 24.1 | 16 | 8.9 |
| Before notice of hearing | 2,189 | 16.3 | 1,892 | 16.7 | 175 | 17.0 | 122 | 11.6 | 16 | 8.9 |
| After notice of hearing, before hearing closed | 3,166 | 23.5 | 2,934 | 25.8 | 103 | 10.1 | 129 | 12.2 | 0 | |
| After hearing closed, before decision | 31 | 0.2 | 26 | 0.2 | 2 | 0.2 | 3 | 0.3 | 0 | |
| Expedited election | 30 | 0.2 | 9 | 0.1 | 21 | 2.1 | 0 | 0 | ||
| Regional director-directed election | 1,643 | 12.2 | 1,476 | 13.0 | 82 | 8.0 | 85 | 8.1 | 54 | 30.0 |
| Board-directed election | 130 | 1.0 | 115 | 1.0 | 4 | 0.4 | 11 | 1.0 | 0 | |
| By withdrawal, total | 3,358 | 25.0 | 2,630 | 23.2 | 359 | 35.1 | 369 | 35.0 | 65 | 36.1 |
| Before notice of hearing | 1,870 | 13.9 | 1,335 | 11.7 | 262 | 25.6 | 273 | 25.9 | 63 | 35.0 |
| After notice of hearing, before hearings closed | 1,227 | 9.1 | 1,077 | 9.5 | 73 | 7.1 | 77 | 7.3 | 0 | |
| After hearing closed, before decision | 59 | 0.4 | 45 | 0.4 | 8 | 0.8 | 6 | 0.6 | 2 | 1.1 |
| After regional director's decision and direction of election | 191 | 1.4 | 163 | 1.4 | 15 | 1.5 | 13 | 1.2 | 0 | |
| After Board decision and direction of election | 11 | 0.1 | 10 | 0.1 | 1 | 0.1 | 0 | 0 | ||
| By dismissal, total | 999 | 7.4 | 613 | 5.4 | 159 | 15.5 | 227 | 21.5 | 20 | 11.1 |
| Before notice of hearing | 565 | 4.2 | 277 | 2.4 | 115 | 11.2 | 173 | 16.4 | 20 | 11.1 |
| After notice of hearing, before hearing closed | 113 | 0.8 | 55 | 0.5 | 25 | 2.4 | 33 | 3.1 | 0 | |
| After hearing closed, before decision | 68 | 0.5 | 63 | 0.6 | 2 | 0.2 | 3 | 0.3 | 0 | |
| By regional director's decision | 218 | 1.6 | 188 | 1.6 | 15 | 1.5 | 15 | 1.4 | 0 | |
| By Board decision | 35 | 0.3 | 30 | 0.3 | 2 | 0.2 | 3 | 0.3 | 0 | |
- 1 See "Glossary" for definitions of terms.
109 of 109 figures sit in a row or column sum that works out.
Reader’s notes
p. 254. Column count: stub + 5 case types x (Number, Percent) = 11 columns. The stub heading "Method and stage of disposition" spans both heading levels and is repeated. Decimal points in the percent columns are frequently lost or faint in this scan (e.g. All R "Stipulated election" prints as "40.1" clearly but RC prints as ".42 7"; others such as "0 2", "0 1", "13 0", "8 0", "11 7", "25 6", "0 4", "1 4", "0 1", "7 4", "0 3" show a gap where the period has dropped out). Because the surrounding typesetting is uniformly one-decimal, I have transcribed all of these with a decimal point; no digits were altered. "After:" (row 3) is a printed section line carrying a label only; its value cells are blank in the image. Dashed rules ("------") standing for "no percent computed" in the Percent columns of rows whose Number is 0 are transcribed as "" per instruction. In those rows the Number cell is a printed 0 and is kept as "0". Doubtful cells, all minor scanner speckle rather than ambiguity about the digits: RD Percent on "Before notice of hearing" under Consent election (5.4) has a stray mark at the right edge, likely a column-rule artifact; All R Percent on "After hearing closed, before decision" under By dismissal (0.5) has a speckle after the 5; RC Percent on "Stipulated election" (42.7) has a stray dot before the 4. Arithmetic cross-check (not used to alter any cell): every row's RC + RM + RD equals the All R figure, each section's components sum to its total, and the three section totals sum to "Total, all" (9,081 + 3,358 + 999 = 13,438) in both the All R and UD columns. No internal inconsistency found, which supports the digit readings above.
Source image
Source data: U.S. NLRB Annual Reports (public domain). Reconstruction by NLRB Stats Archive. Read by claude-opus-5 (effort max, prompt extract_v1) from the 300-dpi scan; stitched by page. Updated October 2026.