NLRB Stats Archive › Annual Reports › FY1972 › Standard Federal Administrative Regional Distribution of Cases Received, Fiscal Year 1972
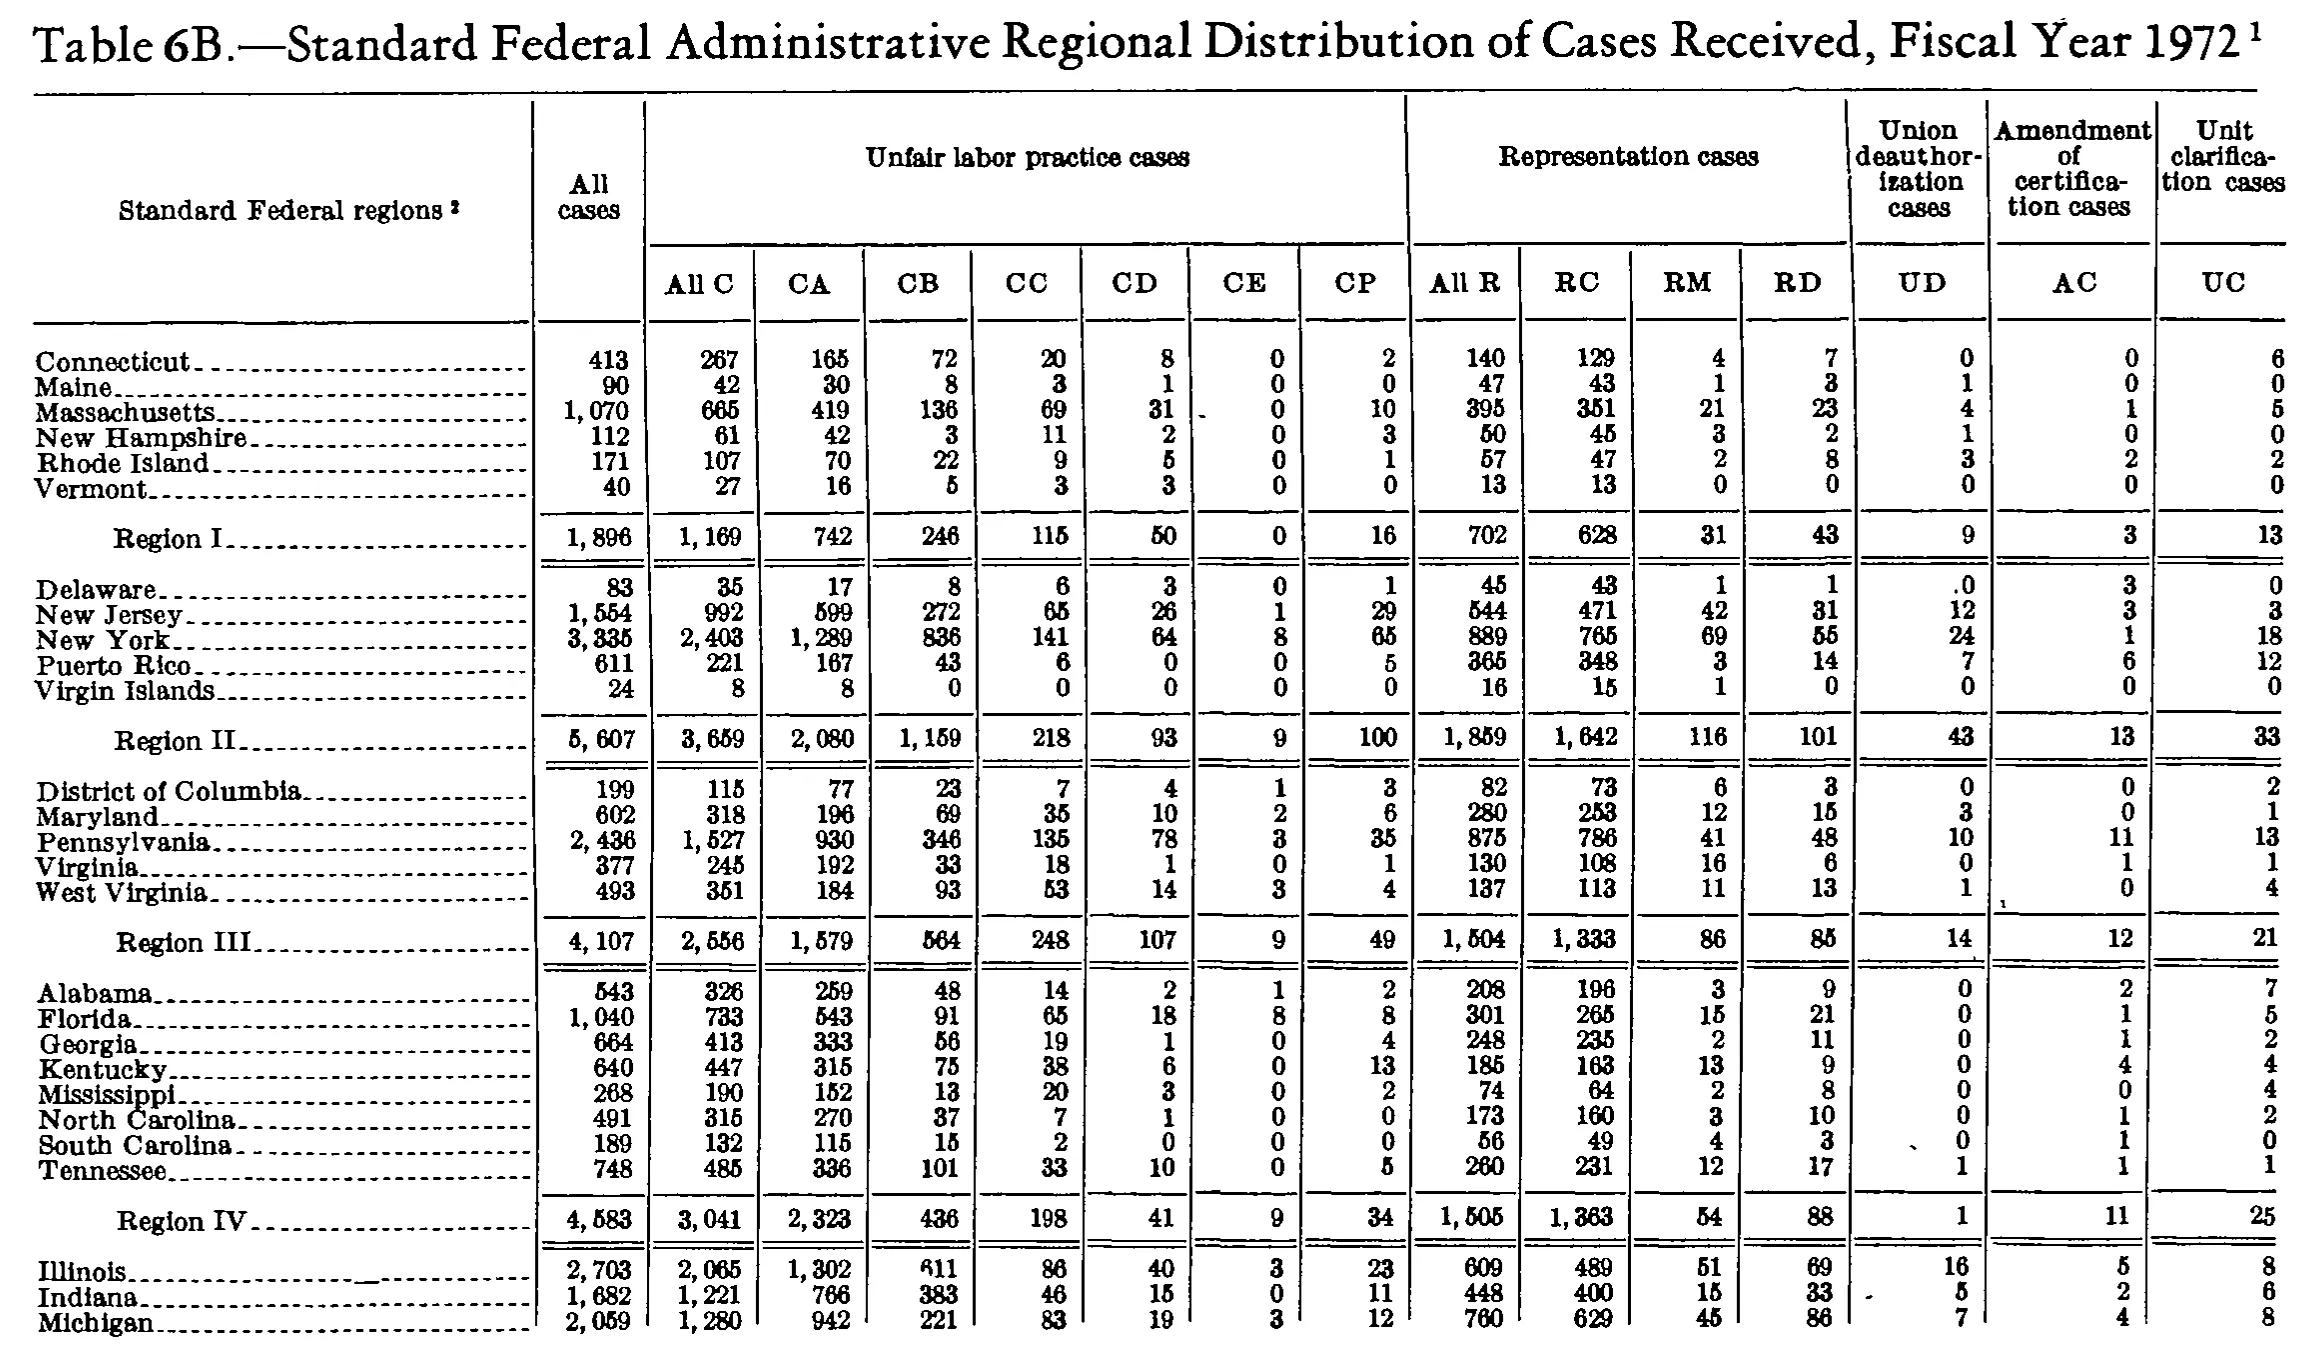
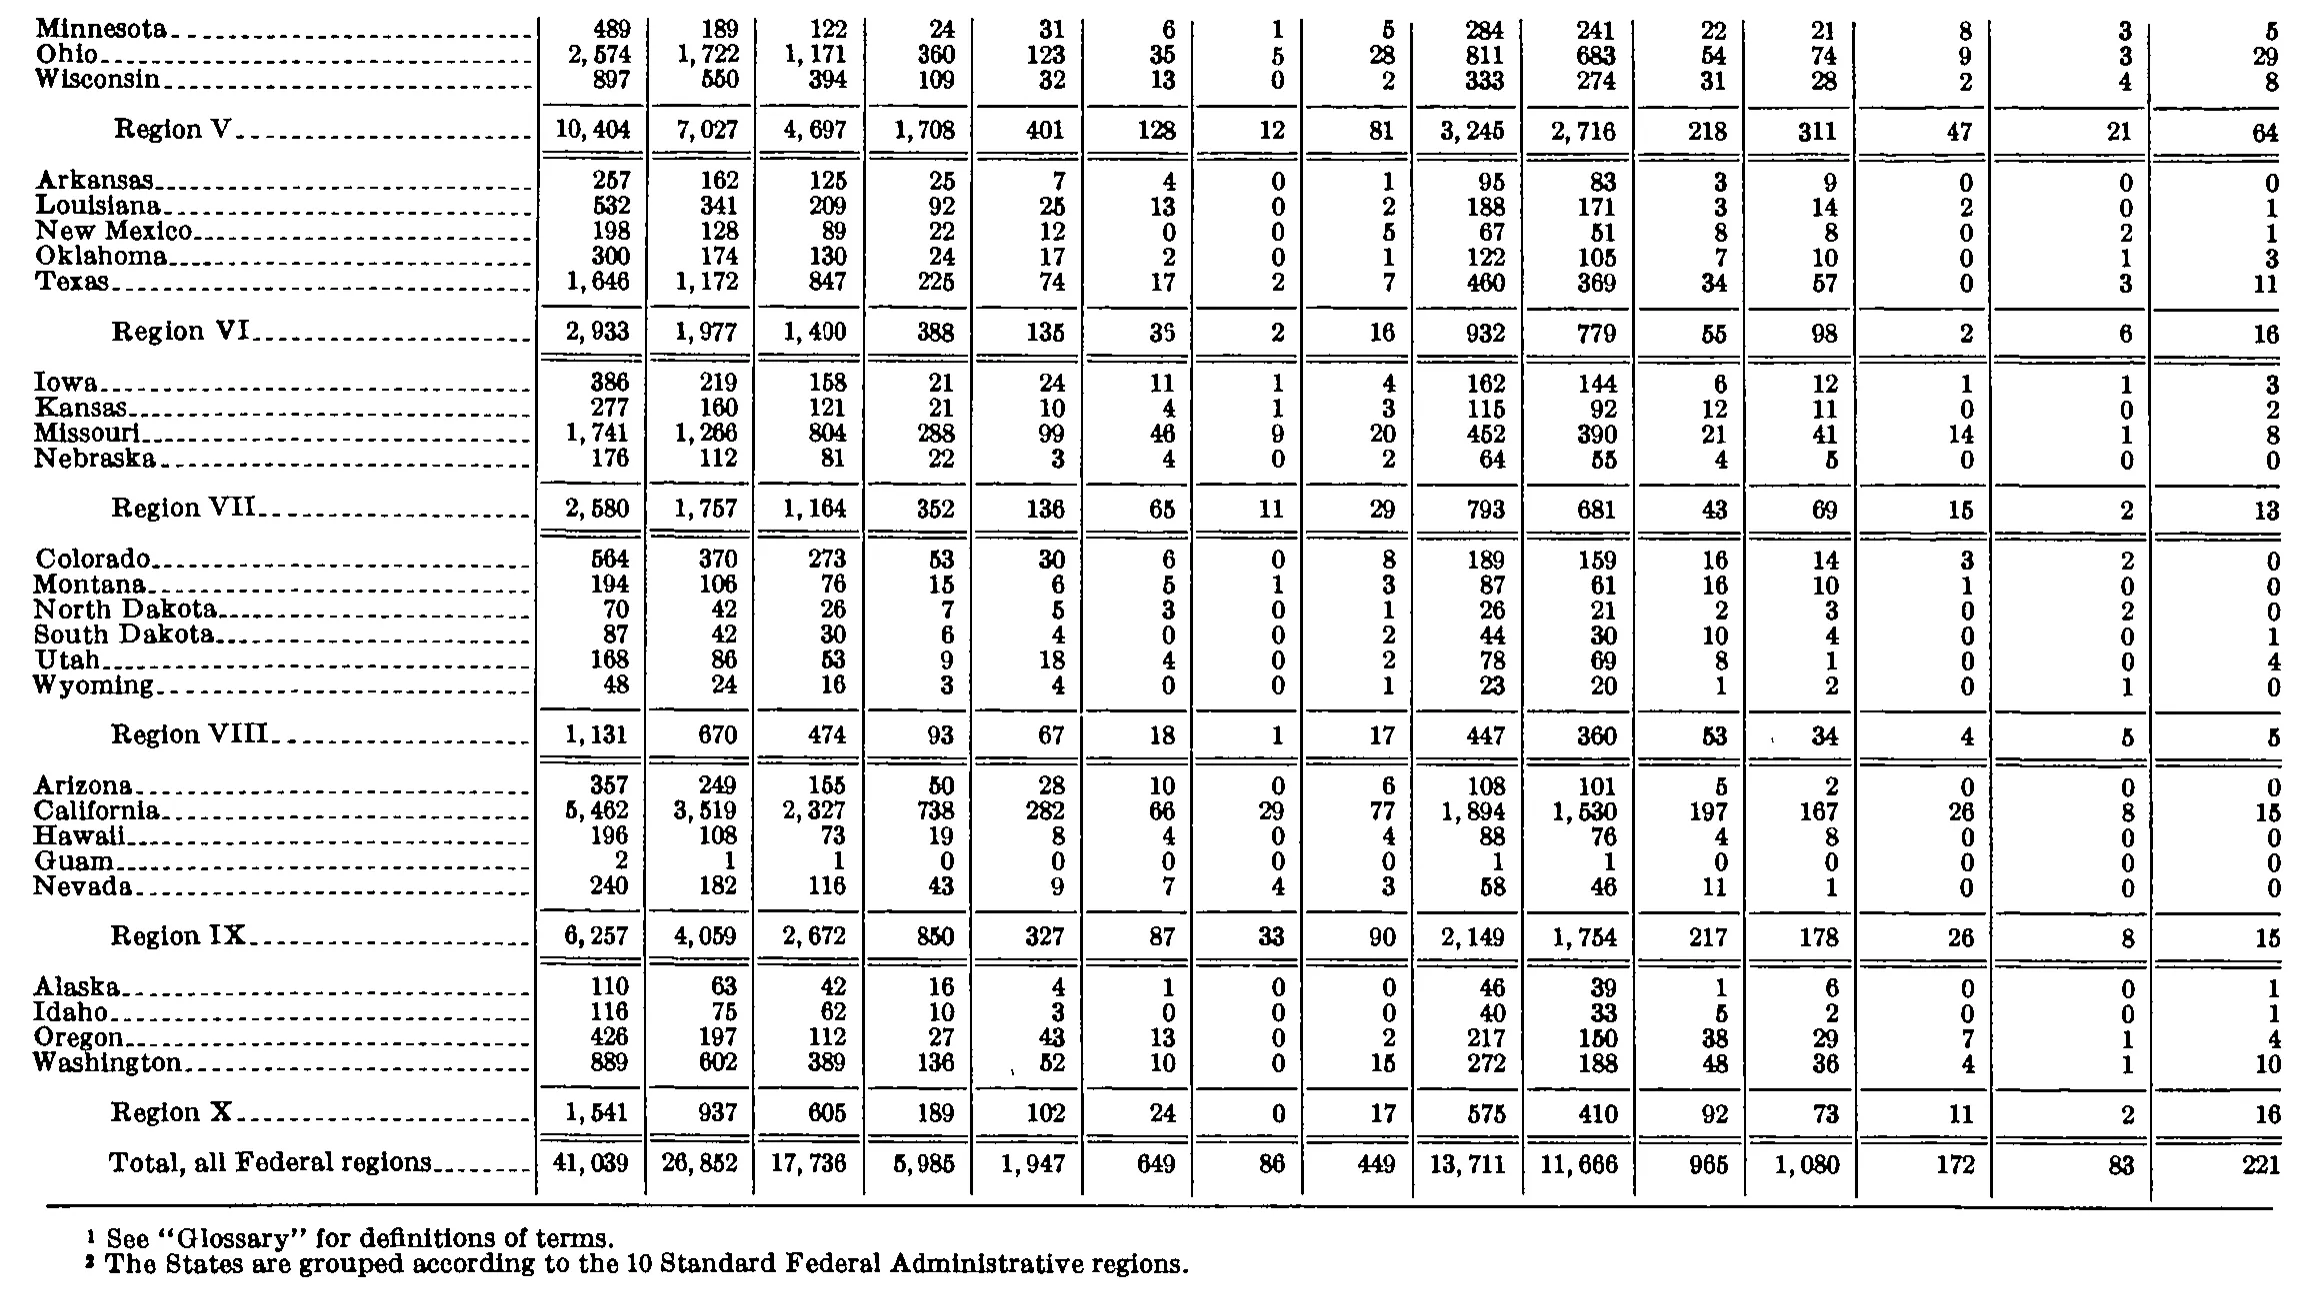
Standard Federal Administrative Regional Distribution of Cases Received, Fiscal Year 1972
Stitched from pp. 247–248.
| Standard Federal regions | All cases | Unfair labor practice cases | Representation cases | Union deauthorization cases | Amendment of certification cases | Unit clarification cases | |||||||||
|---|---|---|---|---|---|---|---|---|---|---|---|---|---|---|---|
| Standard Federal regions | All cases | All C | CA | CB | CC | CD | CE | CP | All R | RC | RM | RD | UD | AC | UC |
| Connecticut | 413 | 267 | 165 | 72 | 20 | 8 | 0 | 2 | 140 | 129 | 4 | 7 | 0 | 0 | 6 |
| Maine | 90 | 42 | 30 | 8 | 3 | 1 | 0 | 0 | 47 | 43 | 1 | 3 | 1 | 0 | 0 |
| Massachusetts | 1,070 | 665 | 419 | 136 | 69 | 31 | 0 | 10 | 395 | 351 | 21 | 23 | 4 | 1 | 5 |
| New Hampshire | 112 | 61 | 42 | 3 | 11 | 2 | 0 | 3 | 50 | 45 | 3 | 2 | 1 | 0 | 0 |
| Rhode Island | 171 | 107 | 70 | 22 | 9 | 5 | 0 | 1 | 57 | 47 | 2 | 8 | 3 | 2 | 2 |
| Vermont | 40 | 27 | 16 | 5 | 3 | 3 | 0 | 0 | 13 | 13 | 0 | 0 | 0 | 0 | 0 |
| Region I | 1,896 | 1,169 | 742 | 246 | 115 | 50 | 0 | 16 | 702 | 628 | 31 | 43 | 9 | 3 | 13 |
| Delaware | 83 | 35 | 17 | 8 | 6 | 3 | 0 | 1 | 45 | 43 | 1 | 1 | 0 | 3 | 0 |
| New Jersey | 1,554 | 992 | 599 | 272 | 65 | 26 | 1 | 29 | 544 | 471 | 42 | 31 | 12 | 3 | 3 |
| New York | 3,335 | 2,403 | 1,289 | 836 | 141 | 64 | 8 | 65 | 889 | 765 | 69 | 55 | 24 | 1 | 18 |
| Puerto Rico | 611 | 221 | 167 | 43 | 6 | 0 | 0 | 5 | 365 | 348 | 3 | 14 | 7 | 6 | 12 |
| Virgin Islands | 24 | 8 | 8 | 0 | 0 | 0 | 0 | 0 | 16 | 15 | 1 | 0 | 0 | 0 | 0 |
| Region II | 5,607 | 3,659 | 2,080 | 1,159 | 218 | 93 | 9 | 100 | 1,859 | 1,642 | 116 | 101 | 43 | 13 | 33 |
| District of Columbia | 199 | 115 | 77 | 23 | 7 | 4 | 1 | 3 | 82 | 73 | 6 | 3 | 0 | 0 | 2 |
| Maryland | 602 | 318 | 196 | 69 | 35 | 10 | 2 | 6 | 280 | 253 | 12 | 15 | 3 | 0 | 1 |
| Pennsylvania | 2,436 | 1,527 | 930 | 346 | 135 | 78 | 3 | 35 | 875 | 786 | 41 | 48 | 10 | 11 | 13 |
| Virginia | 377 | 245 | 192 | 33 | 18 | 1 | 0 | 1 | 130 | 108 | 16 | 6 | 0 | 1 | 1 |
| West Virginia | 493 | 351 | 184 | 93 | 53 | 14 | 3 | 4 | 137 | 113 | 11 | 13 | 1 | 0 | 4 |
| Region III | 4,107 | 2,556 | 1,579 | 564 | 248 | 107 | 9 | 49 | 1,504 | 1,333 | 86 | 85 | 14 | 12 | 21 |
| Alabama | 543 | 326 | 259 | 48 | 14 | 2 | 1 | 2 | 208 | 196 | 3 | 9 | 0 | 2 | 7 |
| Florida | 1,040 | 733 | 543 | 91 | 65 | 18 | 8 | 8 | 301 | 265 | 15 | 21 | 0 | 1 | 5 |
| Georgia | 664 | 413 | 333 | 56 | 19 | 1 | 0 | 4 | 248 | 235 | 2 | 11 | 0 | 1 | 2 |
| Kentucky | 640 | 447 | 315 | 75 | 38 | 6 | 0 | 13 | 185 | 163 | 13 | 9 | 0 | 4 | 4 |
| Mississippi | 268 | 190 | 152 | 13 | 20 | 3 | 0 | 2 | 74 | 64 | 2 | 8 | 0 | 0 | 4 |
| North Carolina | 491 | 315 | 270 | 37 | 7 | 1 | 0 | 0 | 173 | 160 | 3 | 10 | 0 | 1 | 2 |
| South Carolina | 189 | 132 | 115 | 15 | 2 | 0 | 0 | 0 | 56 | 49 | 4 | 3 | 0 | 1 | 0 |
| Tennessee | 748 | 485 | 336 | 101 | 33 | 10 | 0 | 5 | 260 | 231 | 12 | 17 | 1 | 1 | 1 |
| Region IV | 4,583 | 3,041 | 2,323 | 436 | 198 | 41 | 9 | 34 | 1,505 | 1,363 | 54 | 88 | 1 | 11 | 25 |
| Illinois | 2,703 | 2,065 | 1,302 | 611 | 86 | 40 | 3 | 23 | 609 | 489 | 51 | 69 | 16 | 5 | 8 |
| Indiana | 1,682 | 1,221 | 766 | 383 | 46 | 15 | 0 | 11 | 448 | 400 | 15 | 33 | 5 | 2 | 6 |
| Michigan | 2,059 | 1,280 | 942 | 221 | 83 | 19 | 3 | 12 | 760 | 629 | 45 | 86 | 7 | 4 | 8 |
| Minnesota | 489 | 189 | 122 | 24 | 31 | 6 | 1 | 5 | 284 | 241 | 22 | 21 | 8 | 3 | 5 |
| Ohio | 2,574 | 1,722 | 1,171 | 360 | 123 | 35 | 5 | 28 | 811 | 683 | 54 | 74 | 9 | 3 | 29 |
| Wisconsin | 897 | 550 | 394 | 109 | 32 | 13 | 0 | 2 | 333 | 274 | 31 | 28 | 2 | 4 | 8 |
| Region V | 10,404 | 7,027 | 4,697 | 1,708 | 401 | 128 | 12 | 81 | 3,245 | 2,716 | 218 | 311 | 47 | 21 | 64 |
| Arkansas | 257 | 162 | 125 | 25 | 7 | 4 | 0 | 1 | 95 | 83 | 3 | 9 | 0 | 0 | 0 |
| Louisiana | 532 | 341 | 209 | 92 | 25 | 13 | 0 | 2 | 188 | 171 | 3 | 14 | 2 | 0 | 1 |
| New Mexico | 198 | 128 | 89 | 22 | 12 | 0 | 0 | 5 | 67 | 51 | 8 | 8 | 0 | 2 | 1 |
| Oklahoma | 300 | 174 | 130 | 24 | 17 | 2 | 0 | 1 | 122 | 105 | 7 | 10 | 0 | 1 | 3 |
| Texas | 1,646 | 1,172 | 847 | 225 | 74 | 17 | 2 | 7 | 460 | 369 | 34 | 57 | 0 | 3 | 11 |
| Region VI | 2,933 | 1,977 | 1,400 | 388 | 135 | 35 | 2 | 16 | 932 | 779 | 55 | 98 | 2 | 6 | 16 |
| Iowa | 386 | 219 | 158 | 21 | 24 | 11 | 1 | 4 | 162 | 144 | 6 | 12 | 1 | 1 | 3 |
| Kansas | 277 | 160 | 121 | 21 | 10 | 4 | 1 | 3 | 115 | 92 | 12 | 11 | 0 | 0 | 2 |
| Missouri | 1,741 | 1,266 | 804 | 288 | 99 | 46 | 9 | 20 | 452 | 390 | 21 | 41 | 14 | 1 | 8 |
| Nebraska | 176 | 112 | 81 | 22 | 3 | 4 | 0 | 2 | 64 | 55 | 4 | 5 | 0 | 0 | 0 |
| Region VII | 2,580 | 1,757 | 1,164 | 352 | 136 | 65 | 11 | 29 | 793 | 681 | 43 | 69 | 15 | 2 | 13 |
| Colorado | 564 | 370 | 273 | 53 | 30 | 6 | 0 | 8 | 189 | 159 | 16 | 14 | 3 | 2 | 0 |
| Montana | 194 | 106 | 76 | 15 | 6 | 5 | 1 | 3 | 87 | 61 | 16 | 10 | 1 | 0 | 0 |
| North Dakota | 70 | 42 | 26 | 7 | 5 | 3 | 0 | 1 | 26 | 21 | 2 | 3 | 0 | 2 | 0 |
| South Dakota | 87 | 42 | 30 | 6 | 4 | 0 | 0 | 2 | 44 | 30 | 10 | 4 | 0 | 0 | 1 |
| Utah | 168 | 86 | 53 | 9 | 18 | 4 | 0 | 2 | 78 | 69 | 8 | 1 | 0 | 0 | 4 |
| Wyoming | 48 | 24 | 16 | 3 | 4 | 0 | 0 | 1 | 23 | 20 | 1 | 2 | 0 | 1 | 0 |
| Region VIII | 1,131 | 670 | 474 | 93 | 67 | 18 | 1 | 17 | 447 | 360 | 53 | 34 | 4 | 5 | 5 |
| Arizona | 357 | 249 | 155 | 50 | 28 | 10 | 0 | 6 | 108 | 101 | 5 | 2 | 0 | 0 | 0 |
| California | 5,462 | 3,519 | 2,327 | 738 | 282 | 66 | 29 | 77 | 1,894 | 1,530 | 197 | 167 | 26 | 8 | 15 |
| Hawaii | 196 | 108 | 73 | 19 | 8 | 4 | 0 | 4 | 88 | 76 | 4 | 8 | 0 | 0 | 0 |
| Guam | 2 | 1 | 1 | 0 | 0 | 0 | 0 | 0 | 1 | 1 | 0 | 0 | 0 | 0 | 0 |
| Nevada | 240 | 182 | 116 | 43 | 9 | 7 | 4 | 3 | 58 | 46 | 11 | 1 | 0 | 0 | 0 |
| Region IX | 6,257 | 4,059 | 2,672 | 850 | 327 | 87 | 33 | 90 | 2,149 | 1,754 | 217 | 178 | 26 | 8 | 15 |
| Alaska | 110 | 63 | 42 | 16 | 4 | 1 | 0 | 0 | 46 | 39 | 1 | 6 | 0 | 0 | 1 |
| Idaho | 116 | 75 | 62 | 10 | 3 | 0 | 0 | 0 | 40 | 33 | 5 | 2 | 0 | 0 | 1 |
| Oregon | 426 | 197 | 112 | 27 | 43 | 13 | 0 | 2 | 217 | 150 | 38 | 29 | 7 | 1 | 4 |
| Washington | 889 | 602 | 389 | 136 | 52 | 10 | 0 | 15 | 272 | 188 | 48 | 36 | 4 | 1 | 10 |
| Region X | 1,541 | 937 | 605 | 189 | 102 | 24 | 0 | 17 | 575 | 410 | 92 | 73 | 11 | 2 | 16 |
| Total, all Federal regions | 41,039 | 26,852 | 17,736 | 5,985 | 1,947 | 649 | 86 | 449 | 13,711 | 11,666 | 965 | 1,080 | 172 | 83 | 221 |
- 1 See "Glossary" for definitions of terms.
- 2 The States are grouped according to the 10 Standard Federal Administrative regions.
845 of 846 figures sit in a row or column sum that works out. 3 cells break a sum: 'Region VI', column 3: prints 1,977, columns 4 to 9 add to 1,976; 'Region VI', column 7: prints 35, rows 'Arkansas' to 'Texas' add to 36; 'Total, all Federal regions', column 7: prints 649, the subtotals in rows 'Region I' to 'Region X' add to 648.
Reader’s notes
p. 247. The crop cuts the table off after the Michigan row: the Region V subtotal and all later regions continue on the following page, so this is a partial table. Footnote markers are printed (a raised 1 on the caption, a raised 2 on the stub heading "Standard Federal regions"), but no footnote text appears within the crop, so `footnotes` is empty. Column structure: 16 columns. "All cases", "Union deauthorization cases", "Amendment of certification cases" and "Unit clarification cases" are tall single headings spanning both heading levels; the latter three carry the abbreviations UD, AC and UC on the lower level, so those abbreviations are given as the second-level heading and the tall wording is repeated above them. Doubtful cells, all minor scan artifacts rather than real characters: - Delaware, UD column: printed as ".0" with a stray dot before the digit; read as 0. - Massachusetts, CD column: a stray dot sits just right of "31"; the value is 31. - Indiana, UD column: a stray dot precedes "5"; the value is 5. - West Virginia, AC column, and South Carolina, UD column: faint stray specks between rules, not digits. Every row and every regional subtotal was checked arithmetically (component C types sum to "All C", R types to "All R", and All C + All R + UD + AC + UC = "All cases"; state rows sum to each Region line). All of them reconcile exactly, so no printed total appears to be in error.
p. 248. This crop is a continuation page: no column headings are printed on it, so header_rows is empty. The grid has 16 columns (stub + 15 numeric columns), counted from the column rules; the first visible rows continue Region V, whose earlier States are on the preceding page. Arithmetic cross-checks: the table is internally consistent in three ways on every row I could test — col1 = col2 + col9 + col13 + col14 + col15; col2 = cols 3+4+5+6+7+8; col9 = cols 10+11+12 — and every region line equals the sum of its States, with one exception. Suspected misprint: the "Region VI" line, column 6 (the column holding Louisiana 13, Texas 17). The five States sum to 36 (4+13+0+2+17) but the region line prints 35; with 35 the region line's own cols 3-8 sum to 1,976 rather than the printed 1,977 in col2. Every other cell in the Region VI block balances, so the printed 35 appears to be one short. Transcribed as printed. Ambiguous 5/6 glyphs resolved by arithmetic, not by eye: California col1 is 5,462 (the other four Region IX States plus 5,462 give the printed 6,257), and the grand-total col4 is 5,985 (17,736+5,985+1,947+649+86+449 = 26,852 as printed). Scan artifacts, not characters: a stray comma-like speck sits left of 34 in the Region VIII row, column 12, and a stray tick sits left of 52 in the Washington row, column 5. Neither was transcribed. The footnote markers 1 and 2 referenced by the two footnotes belong to the caption/column headings on the earlier page and do not appear on this crop.
Source image
Source data: U.S. NLRB Annual Reports (public domain). Reconstruction by NLRB Stats Archive. Read by claude-opus-5 (effort max, prompt extract_v1) from the 300-dpi scan; stitched by page. Updated October 2026.