NLRB Stats Archive › Annual Reports › FY1972 › Geographic Distribution of Cases Received, Fiscal Year 1972
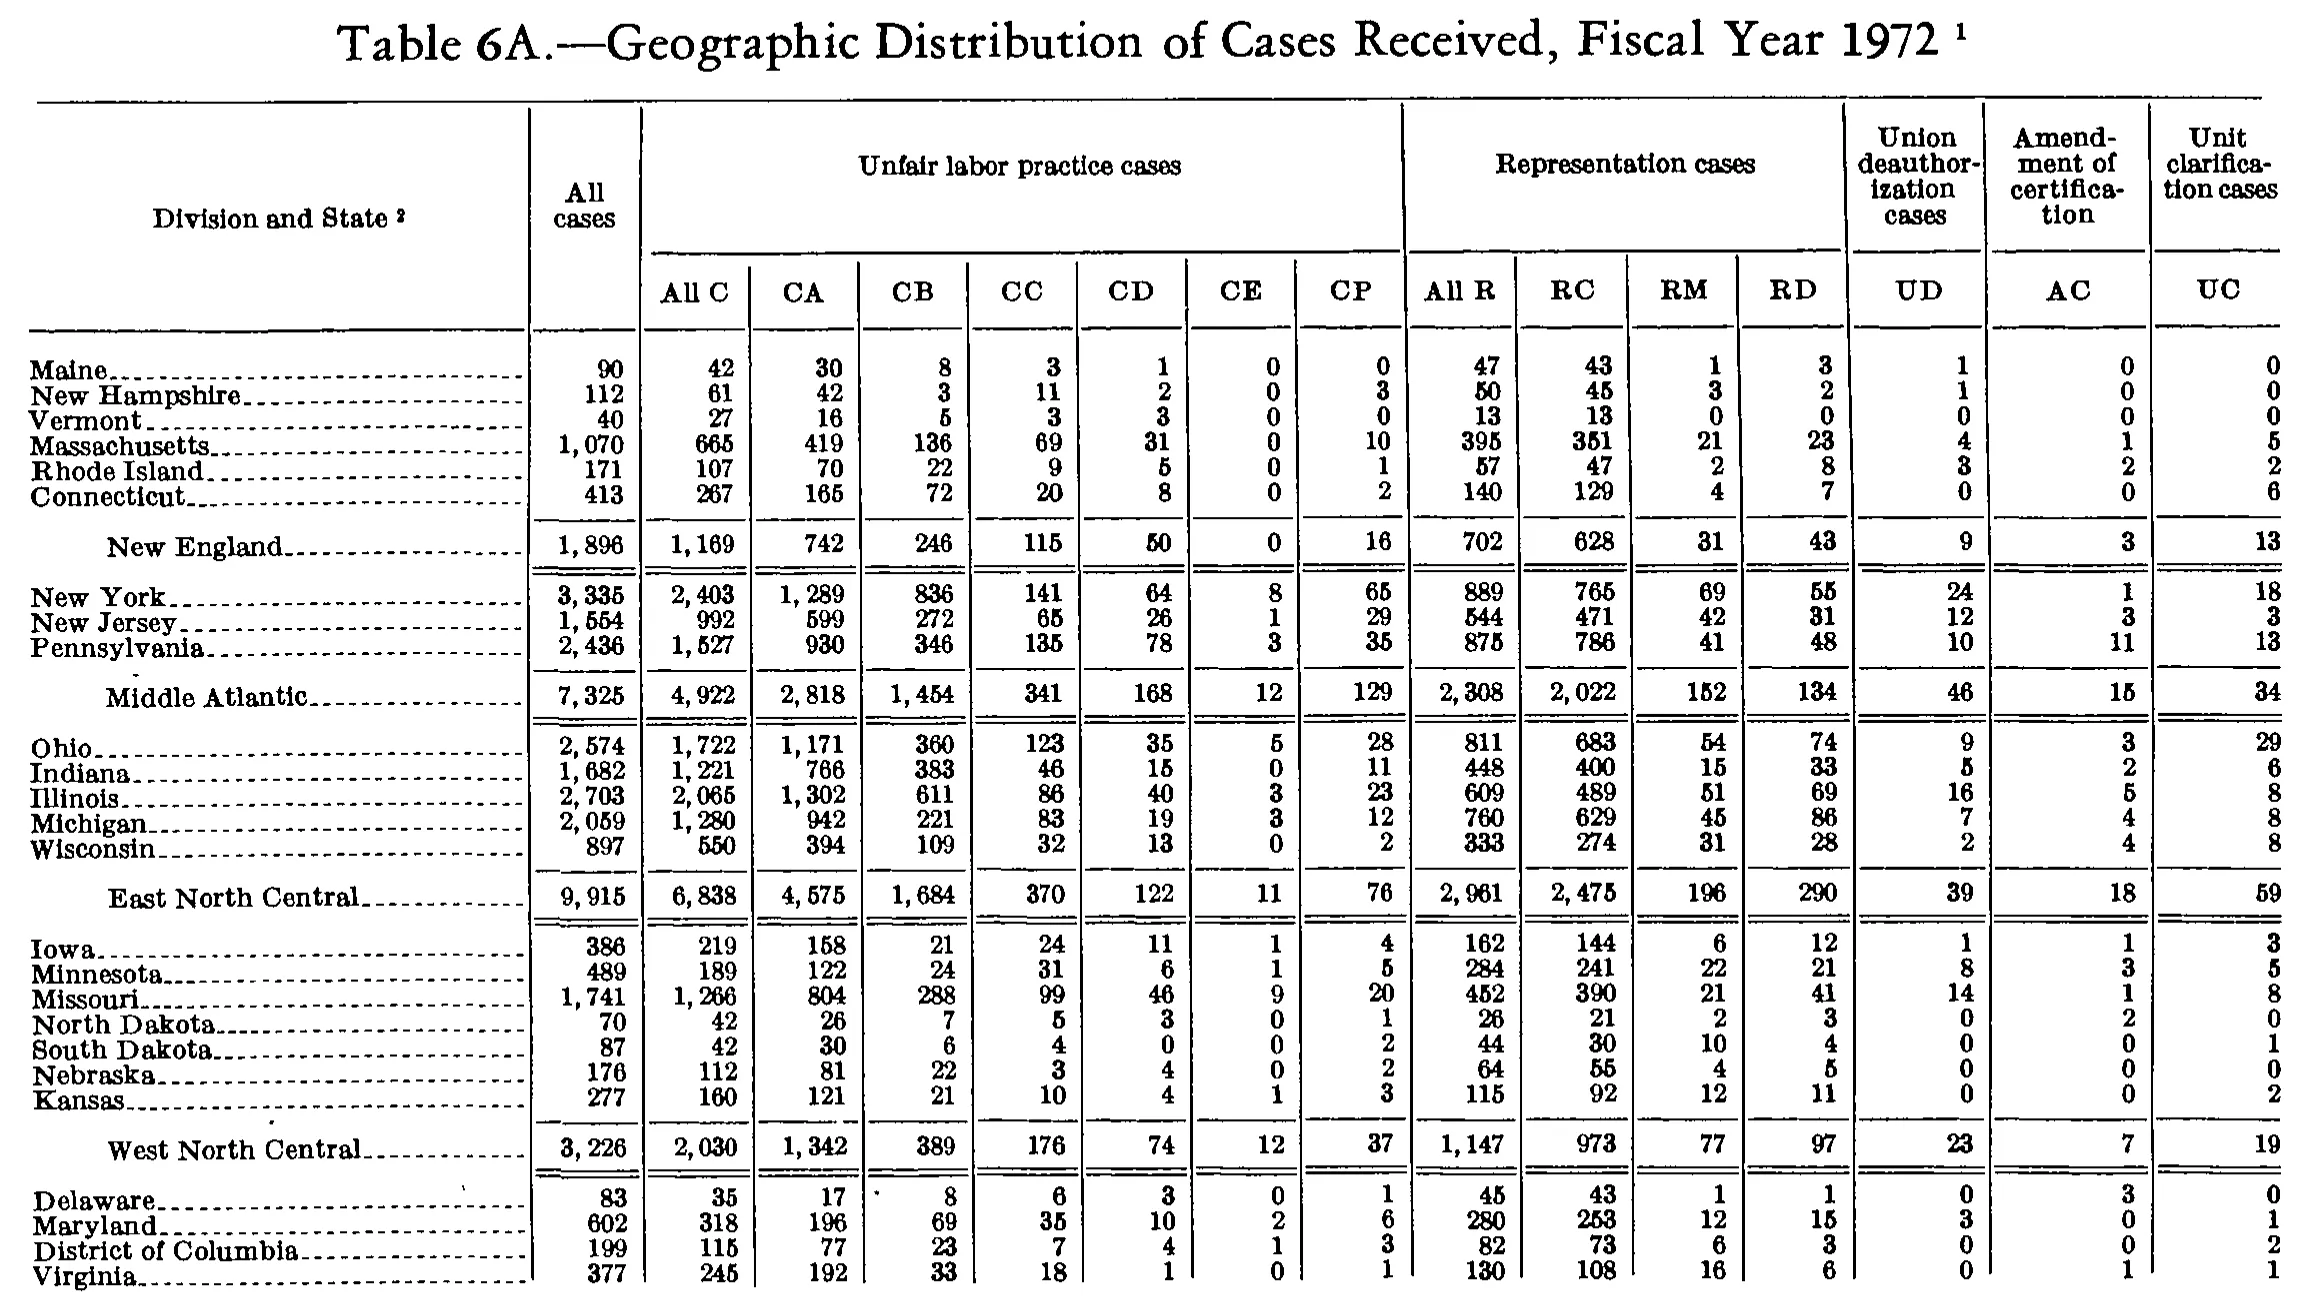
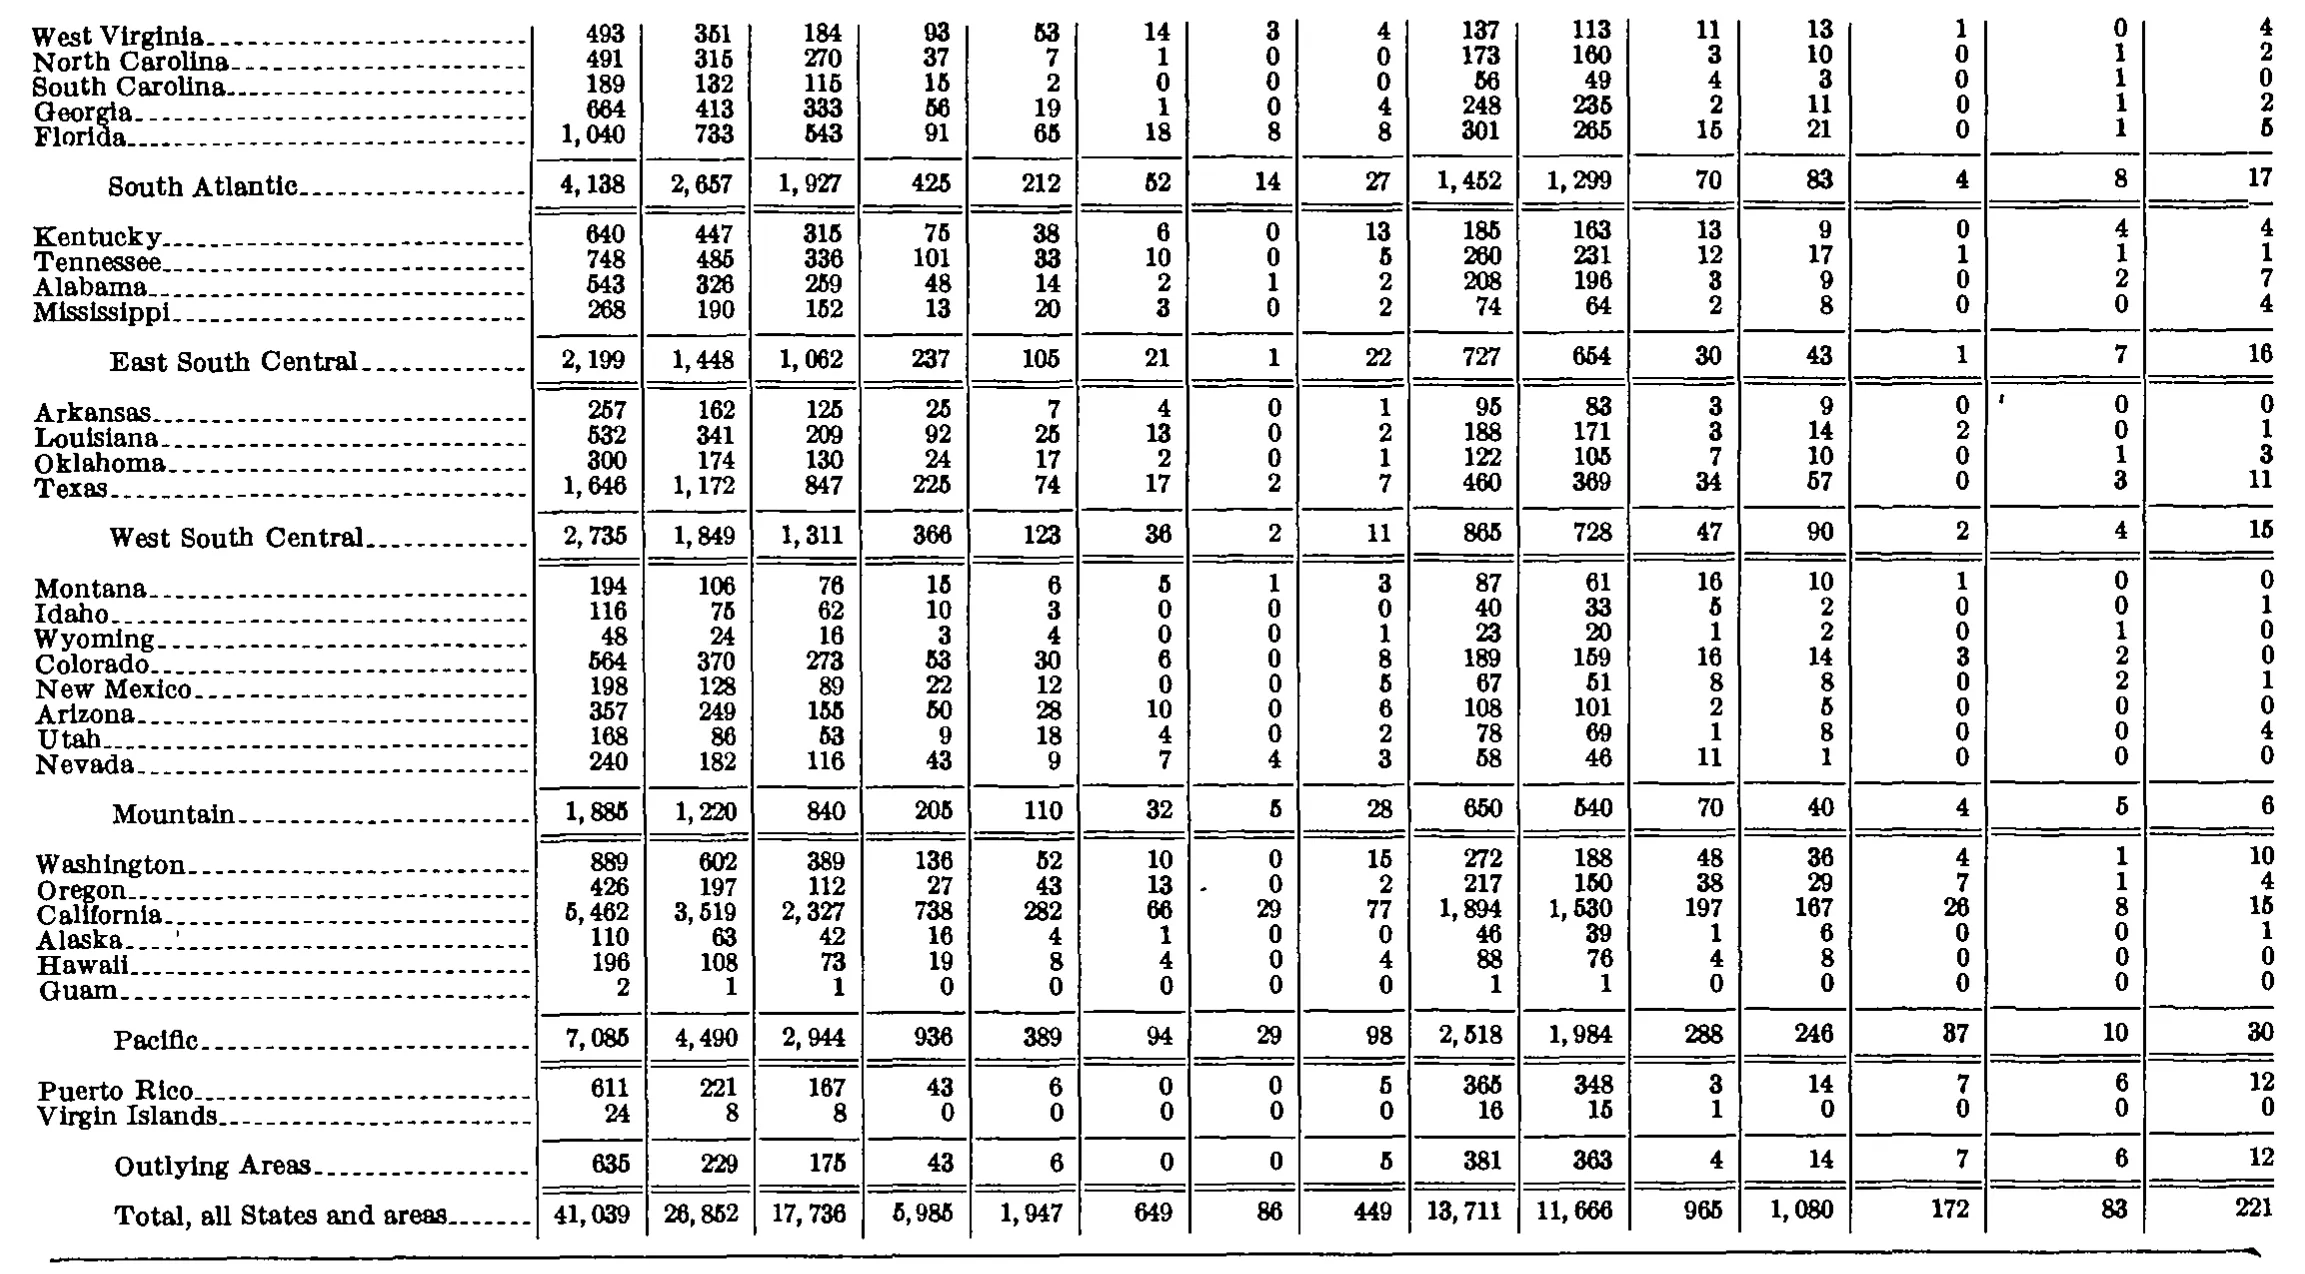
Geographic Distribution of Cases Received, Fiscal Year 1972
Stitched from pp. 245–246.
| Division and State | All cases | Unfair labor practice cases | Representation cases | Union deauthorization cases | Amendment of certification | Unit clarification cases | |||||||||
|---|---|---|---|---|---|---|---|---|---|---|---|---|---|---|---|
| Division and State | All cases | All C | CA | CB | CC | CD | CE | CP | All R | RC | RM | RD | UD | AC | UC |
| Maine | 90 | 42 | 30 | 8 | 3 | 1 | 0 | 0 | 47 | 43 | 1 | 3 | 1 | 0 | 0 |
| New Hampshire | 112 | 61 | 42 | 3 | 11 | 2 | 0 | 3 | 50 | 45 | 3 | 2 | 1 | 0 | 0 |
| Vermont | 40 | 27 | 16 | 5 | 3 | 3 | 0 | 0 | 13 | 13 | 0 | 0 | 0 | 0 | 0 |
| Massachusetts | 1,070 | 665 | 419 | 136 | 69 | 31 | 0 | 10 | 395 | 351 | 21 | 23 | 4 | 1 | 5 |
| Rhode Island | 171 | 107 | 70 | 22 | 9 | 5 | 0 | 1 | 57 | 47 | 2 | 8 | 3 | 2 | 2 |
| Connecticut | 413 | 267 | 165 | 72 | 20 | 8 | 0 | 2 | 140 | 129 | 4 | 7 | 0 | 0 | 6 |
| New England | 1,896 | 1,169 | 742 | 246 | 115 | 50 | 0 | 16 | 702 | 628 | 31 | 43 | 9 | 3 | 13 |
| New York | 3,335 | 2,403 | 1,289 | 836 | 141 | 64 | 8 | 65 | 889 | 765 | 69 | 55 | 24 | 1 | 18 |
| New Jersey | 1,554 | 992 | 599 | 272 | 65 | 26 | 1 | 29 | 544 | 471 | 42 | 31 | 12 | 3 | 3 |
| Pennsylvania | 2,436 | 1,527 | 930 | 346 | 135 | 78 | 3 | 35 | 875 | 786 | 41 | 48 | 10 | 11 | 13 |
| Middle Atlantic | 7,325 | 4,922 | 2,818 | 1,454 | 341 | 168 | 12 | 129 | 2,308 | 2,022 | 152 | 134 | 46 | 15 | 34 |
| Ohio | 2,574 | 1,722 | 1,171 | 360 | 123 | 35 | 5 | 28 | 811 | 683 | 54 | 74 | 9 | 3 | 29 |
| Indiana | 1,682 | 1,221 | 766 | 383 | 46 | 15 | 0 | 11 | 448 | 400 | 15 | 33 | 5 | 2 | 6 |
| Illinois | 2,703 | 2,065 | 1,302 | 611 | 86 | 40 | 3 | 23 | 609 | 489 | 51 | 69 | 16 | 5 | 8 |
| Michigan | 2,059 | 1,280 | 942 | 221 | 83 | 19 | 3 | 12 | 760 | 629 | 45 | 86 | 7 | 4 | 8 |
| Wisconsin | 897 | 550 | 394 | 109 | 32 | 13 | 0 | 2 | 333 | 274 | 31 | 28 | 2 | 4 | 8 |
| East North Central | 9,915 | 6,838 | 4,575 | 1,684 | 370 | 122 | 11 | 76 | 2,961 | 2,475 | 196 | 290 | 39 | 18 | 59 |
| Iowa | 386 | 219 | 158 | 21 | 24 | 11 | 1 | 4 | 162 | 144 | 6 | 12 | 1 | 1 | 3 |
| Minnesota | 489 | 189 | 122 | 24 | 31 | 6 | 1 | 5 | 284 | 241 | 22 | 21 | 8 | 3 | 5 |
| Missouri | 1,741 | 1,266 | 804 | 288 | 99 | 46 | 9 | 20 | 452 | 390 | 21 | 41 | 14 | 1 | 8 |
| North Dakota | 70 | 42 | 26 | 7 | 5 | 3 | 0 | 1 | 26 | 21 | 2 | 3 | 0 | 2 | 0 |
| South Dakota | 87 | 42 | 30 | 6 | 4 | 0 | 0 | 2 | 44 | 30 | 10 | 4 | 0 | 0 | 1 |
| Nebraska | 176 | 112 | 81 | 22 | 3 | 4 | 0 | 2 | 64 | 55 | 4 | 5 | 0 | 0 | 0 |
| Kansas | 277 | 160 | 121 | 21 | 10 | 4 | 1 | 3 | 115 | 92 | 12 | 11 | 0 | 0 | 2 |
| West North Central | 3,226 | 2,030 | 1,342 | 389 | 176 | 74 | 12 | 37 | 1,147 | 973 | 77 | 97 | 23 | 7 | 19 |
| Delaware | 83 | 35 | 17 | 8 | 6 | 3 | 0 | 1 | 45 | 43 | 1 | 1 | 0 | 3 | 0 |
| Maryland | 602 | 318 | 196 | 69 | 35 | 10 | 2 | 6 | 280 | 253 | 12 | 15 | 3 | 0 | 1 |
| District of Columbia | 199 | 115 | 77 | 23 | 7 | 4 | 1 | 3 | 82 | 73 | 6 | 3 | 0 | 0 | 2 |
| Virginia | 377 | 245 | 192 | 33 | 18 | 1 | 0 | 1 | 130 | 108 | 16 | 6 | 0 | 1 | 1 |
| West Virginia | 493 | 351 | 184 | 93 | 53 | 14 | 3 | 4 | 137 | 113 | 11 | 13 | 1 | 0 | 4 |
| North Carolina | 491 | 315 | 270 | 37 | 7 | 1 | 0 | 0 | 173 | 160 | 3 | 10 | 0 | 1 | 2 |
| South Carolina | 189 | 132 | 115 | 15 | 2 | 0 | 0 | 0 | 56 | 49 | 4 | 3 | 0 | 1 | 0 |
| Georgia | 664 | 413 | 333 | 56 | 19 | 1 | 0 | 4 | 248 | 235 | 2 | 11 | 0 | 1 | 2 |
| Florida | 1,040 | 733 | 543 | 91 | 65 | 18 | 8 | 8 | 301 | 265 | 15 | 21 | 0 | 1 | 5 |
| South Atlantic | 4,138 | 2,657 | 1,927 | 425 | 212 | 52 | 14 | 27 | 1,452 | 1,299 | 70 | 83 | 4 | 8 | 17 |
| Kentucky | 640 | 447 | 315 | 75 | 38 | 6 | 0 | 13 | 185 | 163 | 13 | 9 | 0 | 4 | 4 |
| Tennessee | 748 | 485 | 336 | 101 | 33 | 10 | 0 | 5 | 260 | 231 | 12 | 17 | 1 | 1 | 1 |
| Alabama | 543 | 326 | 259 | 48 | 14 | 2 | 1 | 2 | 208 | 196 | 3 | 9 | 0 | 2 | 7 |
| Mississippi | 268 | 190 | 152 | 13 | 20 | 3 | 0 | 2 | 74 | 64 | 2 | 8 | 0 | 0 | 4 |
| East South Central | 2,199 | 1,448 | 1,062 | 237 | 105 | 21 | 1 | 22 | 727 | 654 | 30 | 43 | 1 | 7 | 16 |
| Arkansas | 257 | 162 | 125 | 25 | 7 | 4 | 0 | 1 | 95 | 83 | 3 | 9 | 0 | 0 | 0 |
| Louisiana | 532 | 341 | 209 | 92 | 25 | 13 | 0 | 2 | 188 | 171 | 3 | 14 | 2 | 0 | 1 |
| Oklahoma | 300 | 174 | 130 | 24 | 17 | 2 | 0 | 1 | 122 | 105 | 7 | 10 | 0 | 1 | 3 |
| Texas | 1,646 | 1,172 | 847 | 225 | 74 | 17 | 2 | 7 | 460 | 369 | 34 | 57 | 0 | 3 | 11 |
| West South Central | 2,735 | 1,849 | 1,311 | 366 | 123 | 36 | 2 | 11 | 865 | 728 | 47 | 90 | 2 | 4 | 15 |
| Montana | 194 | 106 | 76 | 15 | 6 | 5 | 1 | 3 | 87 | 61 | 16 | 10 | 1 | 0 | 0 |
| Idaho | 116 | 75 | 62 | 10 | 3 | 0 | 0 | 0 | 40 | 33 | 5 | 2 | 0 | 0 | 1 |
| Wyoming | 48 | 24 | 16 | 3 | 4 | 0 | 0 | 1 | 23 | 20 | 1 | 2 | 0 | 1 | 0 |
| Colorado | 564 | 370 | 273 | 53 | 30 | 6 | 0 | 8 | 189 | 159 | 16 | 14 | 3 | 2 | 0 |
| New Mexico | 198 | 128 | 89 | 22 | 12 | 0 | 0 | 5 | 67 | 51 | 8 | 8 | 0 | 2 | 1 |
| Arizona | 357 | 249 | 155 | 50 | 28 | 10 | 0 | 6 | 108 | 101 | 2 | 5 | 0 | 0 | 0 |
| Utah | 168 | 86 | 53 | 9 | 18 | 4 | 0 | 2 | 78 | 69 | 1 | 8 | 0 | 0 | 4 |
| Nevada | 240 | 182 | 116 | 43 | 9 | 7 | 4 | 3 | 58 | 46 | 11 | 1 | 0 | 0 | 0 |
| Mountain | 1,885 | 1,220 | 840 | 205 | 110 | 32 | 5 | 28 | 650 | 540 | 70 | 40 | 4 | 5 | 6 |
| Washington | 889 | 602 | 389 | 136 | 52 | 10 | 0 | 15 | 272 | 188 | 48 | 36 | 4 | 1 | 10 |
| Oregon | 426 | 197 | 112 | 27 | 43 | 13 | 0 | 2 | 217 | 150 | 38 | 29 | 7 | 1 | 4 |
| California | 5,462 | 3,519 | 2,327 | 738 | 282 | 66 | 29 | 77 | 1,894 | 1,530 | 197 | 167 | 26 | 8 | 15 |
| Alaska | 110 | 63 | 42 | 16 | 4 | 1 | 0 | 0 | 46 | 39 | 1 | 6 | 0 | 0 | 1 |
| Hawaii | 196 | 108 | 73 | 19 | 8 | 4 | 0 | 4 | 88 | 76 | 4 | 8 | 0 | 0 | 0 |
| Guam | 2 | 1 | 1 | 0 | 0 | 0 | 0 | 0 | 1 | 1 | 0 | 0 | 0 | 0 | 0 |
| Pacific | 7,085 | 4,490 | 2,944 | 936 | 389 | 94 | 29 | 98 | 2,518 | 1,984 | 288 | 246 | 87 | 10 | 30 |
| Puerto Rico | 611 | 221 | 167 | 43 | 6 | 0 | 0 | 5 | 365 | 348 | 3 | 14 | 7 | 6 | 12 |
| Virgin Islands | 24 | 8 | 8 | 0 | 0 | 0 | 0 | 0 | 16 | 15 | 1 | 0 | 0 | 0 | 0 |
| Outlying Areas | 635 | 229 | 175 | 43 | 6 | 0 | 0 | 5 | 381 | 363 | 4 | 14 | 7 | 6 | 12 |
| Total, all States and areas | 41,039 | 26,852 | 17,736 | 5,985 | 1,947 | 649 | 86 | 449 | 13,711 | 11,666 | 965 | 1,080 | 172 | 83 | 221 |
844 of 845 figures sit in a row or column sum that works out. 5 cells break a sum: 'Pacific', column 2: prints 7,085, the subtotals in columns 3 to 16 add to 7,135; 'Pacific', column 14: prints 87, rows 'Washington' to 'Guam' add to 37; 'Mountain', column 12: prints 70, rows 'Montana' to 'Nevada' add to 60; 'Mountain', column 13: prints 40, rows 'Montana' to 'Nevada' add to 50; 'Total, all States and areas', column 14: prints 172, the subtotals in rows 'New England' to 'Outlying Areas' add to 222.
Reader’s notes
p. 245. The crop ends mid-table: the last printed row is Virginia, part of an unlabeled (South Atlantic) group whose remaining states and subtotal continue beyond the bottom edge. No footnote text is visible in the crop, although footnote markers are referenced (a raised 1 on the caption, which is excluded per instructions, and a raised 2 on the stub heading "Division and State"); the footnote texts must appear on a later part of the page not included here. The table has 16 columns: stub, "All cases", seven unfair-labor-practice columns (All C, CA, CB, CC, CD, CE, CP), four representation columns (All R, RC, RM, RD), UD, AC, UC. Every data row's components add to its printed subtotals and to "All cases", and every division subtotal row equals the sum of its member states, so the digit readings are internally cross-checked and consistent throughout. Minor scan artifacts, none affecting values: a stray ink speck sits just left of the "8" in the Delaware CB cell, and a small speck appears in the blank stub area between the Kansas and West North Central rows. In the heading, "deauthorization", "Amendment of certification" and "clarification" are printed with end-of-line hyphens, repaired here.
p. 246. Continuation page: no column headings are printed on this crop, so header_rows is empty. The grid has 16 columns (stub + 15 numeric), confirmed both by the column rules and by the body's arithmetic, which holds throughout: column 2 = sum of columns 3-8, column 9 = sum of columns 10-12, and column 1 = column 2 + column 9 + columns 13 + 14 + 15. Every data row, every regional subtotal row and every regional column sum satisfies that structure except the two items below. (1) Pacific subtotal row, column 13: transcribed as printed, "87", but doubtful. The six Pacific jurisdictions give 4 + 7 + 26 + 0 + 0 + 0 = 37 in that column, and the Pacific row's own balance (7,085 - 4,490 - 2,518 - 10 - 30) also gives 37. The intended figure is almost certainly 37, with the 3 filled in by the scan to look like an 8; I left the glyph as I read it. (2) Mountain subtotal row, columns 11 and 12: printed 70 and 40, but the eight Mountain State rows as transcribed sum to 60 and 50 in those columns (their combined total, 110, does agree, and the subtotal is internally consistent since 540 + 70 + 40 = 650). So one cell of a pair is misread or misprinted. The only alternative readings that would reconcile the block are Montana columns 11-12 = 26 and 0 (transcribed 16 and 10) or Colorado columns 11-12 = 26 and 4 (transcribed 16 and 14); all other cells in those two columns are pinned down by the row checks. I transcribed all four cells as I read them. Minor: a speck of ink sits between columns 13 and 14 in the Arkansas row, and another between columns 6 and 7 in the Oregon row; neither is a digit or a footnote marker. No footnote markers appear anywhere in the body, and nothing is printed below the closing rule at the foot of the crop, so footnotes is empty. The rightmost column runs to the edge of the crop (no right-hand rule is visible), but its figures appear complete.
Source image
Source data: U.S. NLRB Annual Reports (public domain). Reconstruction by NLRB Stats Archive. Read by claude-opus-5 (effort max, prompt extract_v1) from the 300-dpi scan; stitched by page. Updated October 2026.