NLRB Stats Archive › Annual Reports › FY1972 › Cases closed
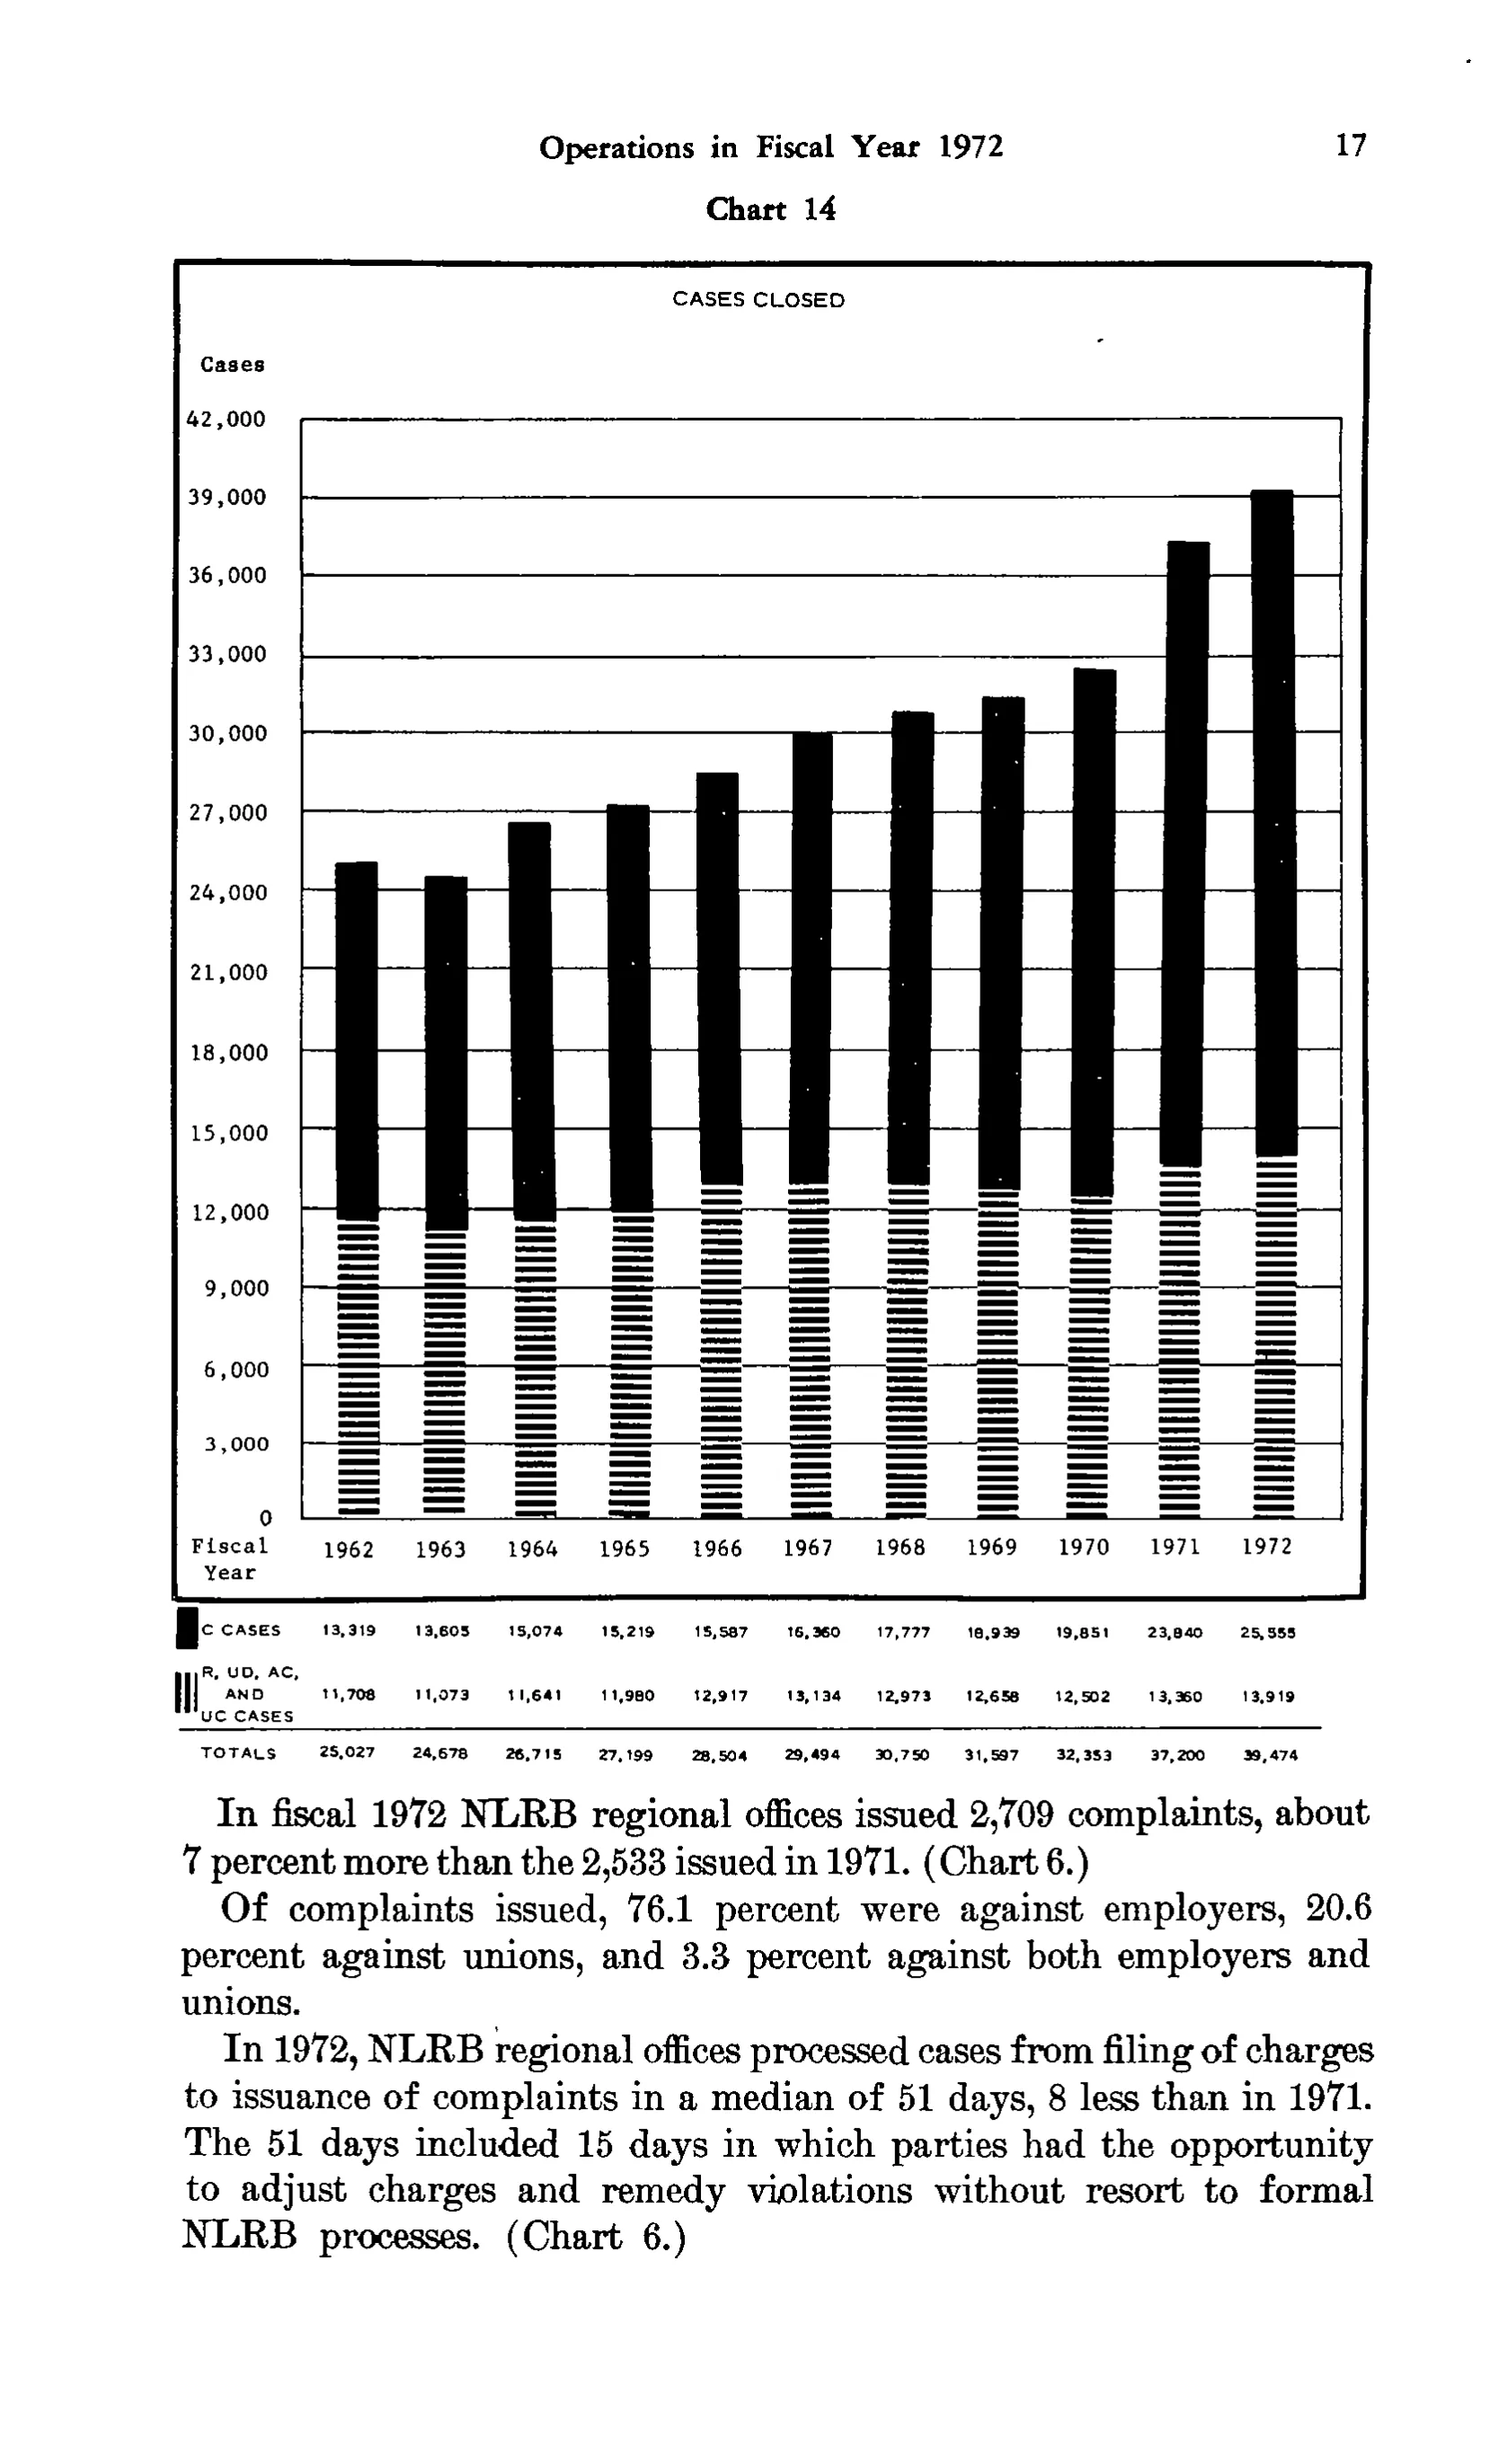
Cases closed
| Fiscal Year | 1962 | 1963 | 1964 | 1965 | 1966 | 1967 | 1968 | 1969 | 1970 | 1971 | 1972 |
|---|---|---|---|---|---|---|---|---|---|---|---|
| C CASES | 13,319 | 13,605 | 15,074 | 15,219 | 15,587 | 16,360 | 17,777 | 18,939 | 19,851 | 23,840 | 25,555 |
| R, UD, AC, AND UC CASES | 11,708 | 11,073 | 11,641 | 11,980 | 12,917 | 13,134 | 12,973 | 12,658 | 12,502 | 13,360 | 13,919 |
| TOTALS | 25,027 | 24,678 | 26,715 | 27,199 | 28,504 | 29,494 | 30,750 | 31,597 | 32,353 | 37,200 | 39,474 |
33 of 33 figures sit in a row or column sum that works out.
Reader’s notes
p. 30. The crop is a page containing Chart 14 ("Cases Closed"); the transcribed grid is the data strip printed beneath the bar chart. The column headings are the chart's fiscal-year axis labels (1962-1972), printed with the stub heading "Fiscal Year" on two lines to their left; they are used here as the single header row. The chart title "CASES CLOSED", the y-axis scale labels (0 to 42,000) and the axis label "Cases" are part of the chart proper and are not transcribed. The second row label is printed on three lines beside its legend swatch ("R, UD, AC," / "AND" / "UC CASES") and is joined into one label. Small legend swatches precede the first two row labels; they carry no text. All eleven columns are internally consistent (C cases plus R/UD/AC/UC cases equals the printed total in every year), so no misprint is suspected. The figures are set in small, slightly broken type: the 1967 C-cases value reads 16,360 and the 1971/1972 totals read 37,200 and 39,474, each confirmed by the column sum.
Source image
Source data: U.S. NLRB Annual Reports (public domain). Reconstruction by NLRB Stats Archive. Read by claude-opus-5 (effort max, prompt extract_v1) from the 300-dpi scan; stitched by page. Updated October 2026.