NLRB Stats Archive › Annual Reports › FY1972 › Trial examiner hearings and decisions
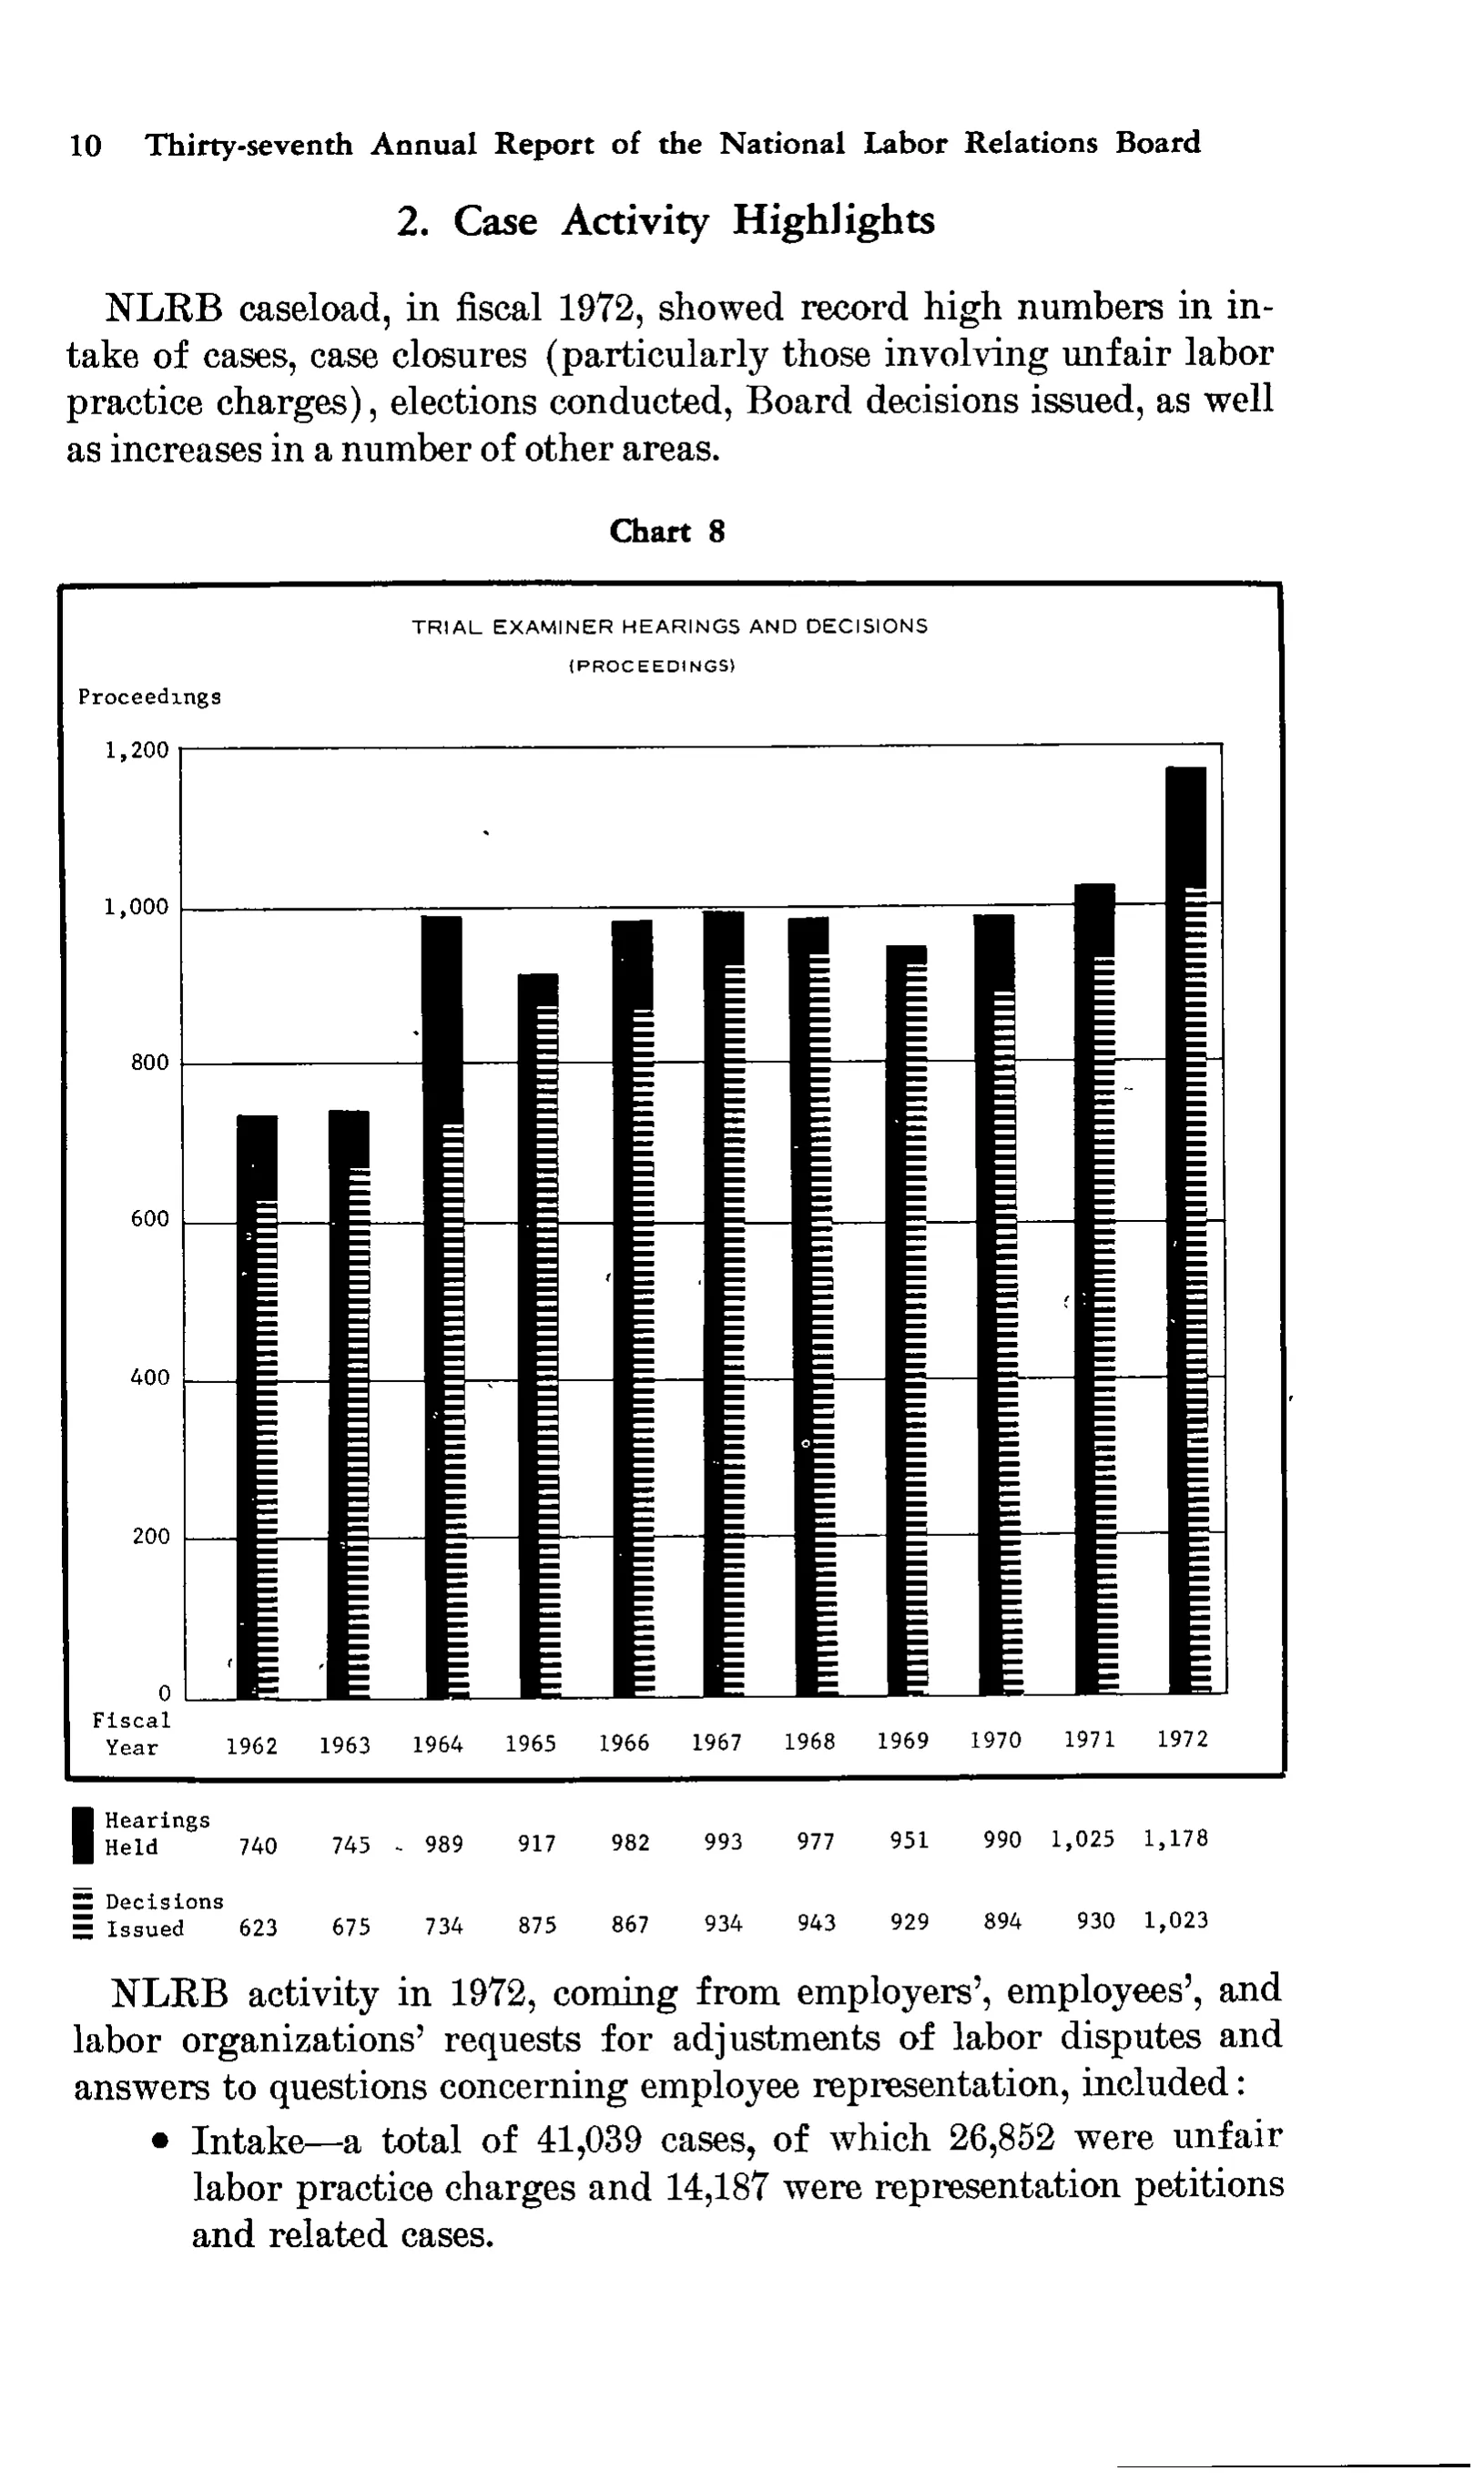
Trial examiner hearings and decisions
| Fiscal Year | 1962 | 1963 | 1964 | 1965 | 1966 | 1967 | 1968 | 1969 | 1970 | 1971 | 1972 |
|---|---|---|---|---|---|---|---|---|---|---|---|
| Hearings Held | 740 | 745 | 989 | 917 | 982 | 993 | 977 | 951 | 990 | 1,025 | 1,178 |
| Decisions Issued | 623 | 675 | 734 | 875 | 867 | 934 | 943 | 929 | 894 | 930 | 1,023 |
0 of 22 figures sit in a row or column sum that works out.
Reader’s notes
p. 23. The crop is not a conventional ruled table: it is Chart 8, a bar chart titled "TRIAL EXAMINER HEARINGS AND DECISIONS (PROCEEDINGS)", with a two-line data legend printed below the chart frame. The grid transcribes that legend: the column headings are the chart's x-axis fiscal-year labels (preceded by the axis stub label "Fiscal Year", printed on two lines inside the frame), and the two body rows are the legend series "Hearings Held" and "Decisions Issued", each label accompanied by a small key swatch (solid black bar, hatched bar) that is not reproduced. The chart title, the y-axis label "Proceedings" and its scale values (0, 200, 400, 600, 800, 1,000, 1,200) are chart furniture and are not included as rows. There are no column rules; values were assigned to years by horizontal alignment with the axis labels, which is unambiguous here (11 values per series for 11 years). In the "Hearings Held" row a small stray speck/dash appears between the 1963 value (745) and the 1964 value (989); it is scanning debris, not a digit or a footnote marker. The surrounding running head, section heading "2. Case Activity Highlights" and body paragraphs are page text, not part of the table.
Source image
Source data: U.S. NLRB Annual Reports (public domain). Reconstruction by NLRB Stats Archive. Read by claude-opus-5 (effort max, prompt extract_v1) from the 300-dpi scan; stitched by page. Updated October 2026.