NLRB Stats Archive › Annual Reports › FY1971 › Proceedings Decided by Circuit Courts of Appeals on Petitions for Enforcement and/or Review of Board Orders, Fiscal Year 1971 Compared With 5-Year Cumulative Totals, Fiscal Years 1966 Through 1970
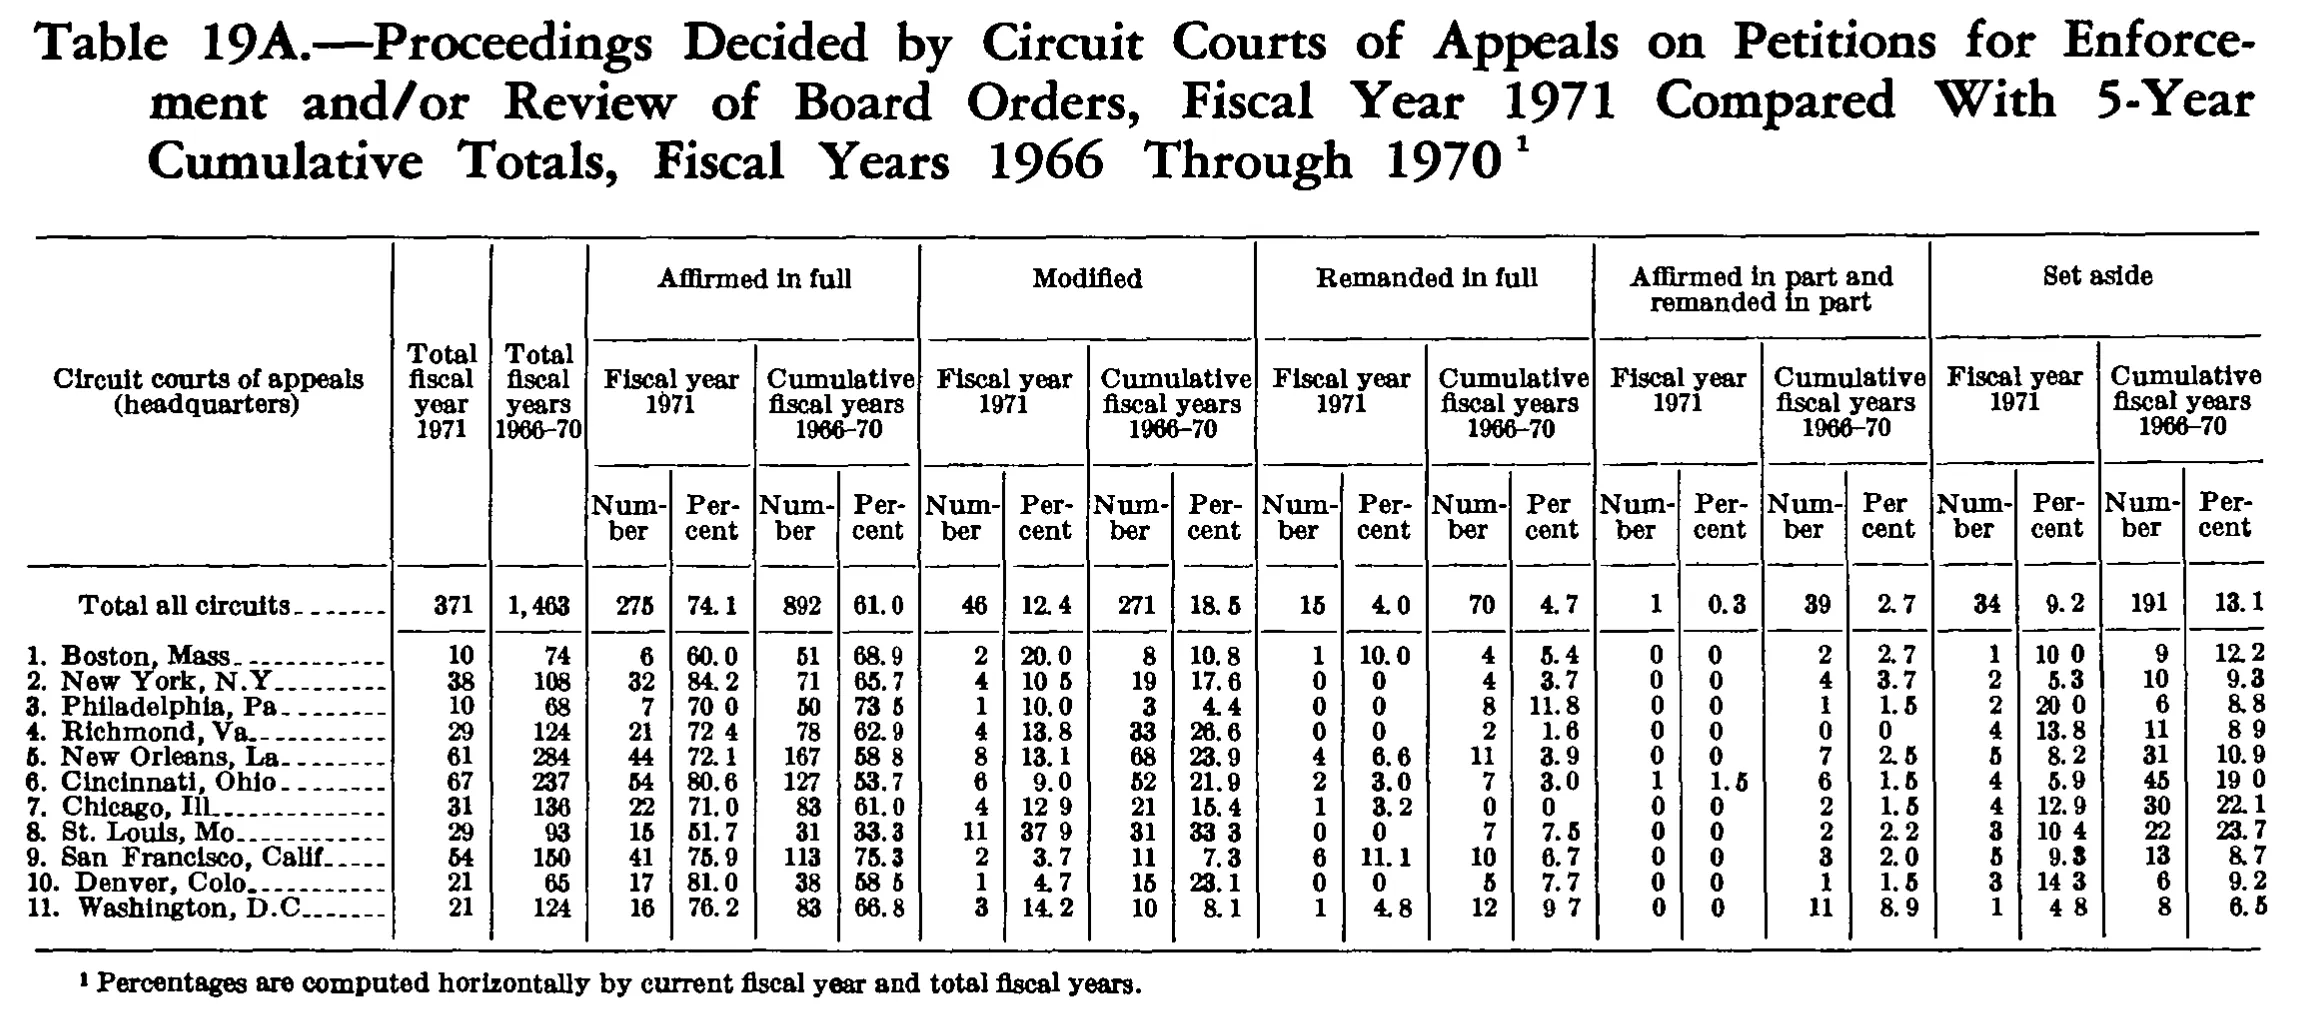
Proceedings Decided by Circuit Courts of Appeals on Petitions for Enforcement and/or Review of Board Orders, Fiscal Year 1971 Compared With 5-Year Cumulative Totals, Fiscal Years 1966 Through 1970
| Circuit courts of appeals (headquarters) | Total fiscal year 1971 | Total fiscal years 1966-70 | Affirmed in full | Modified | Remanded in full | Affirmed in part and remanded in part | Set aside | |||||||||||||||
|---|---|---|---|---|---|---|---|---|---|---|---|---|---|---|---|---|---|---|---|---|---|---|
| Circuit courts of appeals (headquarters) | Total fiscal year 1971 | Total fiscal years 1966-70 | Fiscal year 1971 | Cumulative fiscal years 1966-70 | Fiscal year 1971 | Cumulative fiscal years 1966-70 | Fiscal year 1971 | Cumulative fiscal years 1966-70 | Fiscal year 1971 | Cumulative fiscal years 1966-70 | Fiscal year 1971 | Cumulative fiscal years 1966-70 | ||||||||||
| Circuit courts of appeals (headquarters) | Total fiscal year 1971 | Total fiscal years 1966-70 | Number | Percent | Number | Percent | Number | Percent | Number | Percent | Number | Percent | Number | Percent | Number | Percent | Number | Percent | Number | Percent | Number | Percent |
| Total all circuits | 371 | 1,463 | 275 | 74.1 | 892 | 61.0 | 46 | 12.4 | 271 | 18.5 | 15 | 4.0 | 70 | 4.7 | 1 | 0.3 | 39 | 2.7 | 34 | 9.2 | 191 | 13.1 |
| 1. Boston, Mass. | 10 | 74 | 6 | 60.0 | 51 | 68.9 | 2 | 20.0 | 8 | 10.8 | 1 | 10.0 | 4 | 5.4 | 0 | 0 | 2 | 2.7 | 1 | 10.0 | 9 | 12.2 |
| 2. New York, N.Y. | 38 | 108 | 32 | 84.2 | 71 | 65.7 | 4 | 10.5 | 19 | 17.6 | 0 | 0 | 4 | 3.7 | 0 | 0 | 4 | 3.7 | 2 | 5.3 | 10 | 9.3 |
| 3. Philadelphia, Pa. | 10 | 68 | 7 | 70.0 | 50 | 73.5 | 1 | 10.0 | 3 | 4.4 | 0 | 0 | 8 | 11.8 | 0 | 0 | 1 | 1.5 | 2 | 20.0 | 6 | 8.8 |
| 4. Richmond, Va. | 29 | 124 | 21 | 72.4 | 78 | 62.9 | 4 | 13.8 | 33 | 26.6 | 0 | 0 | 2 | 1.6 | 0 | 0 | 0 | 0 | 4 | 13.8 | 11 | 8.9 |
| 5. New Orleans, La. | 61 | 284 | 44 | 72.1 | 167 | 58.8 | 8 | 13.1 | 68 | 23.9 | 4 | 6.6 | 11 | 3.9 | 0 | 0 | 7 | 2.5 | 5 | 8.2 | 31 | 10.9 |
| 6. Cincinnati, Ohio | 67 | 237 | 54 | 80.6 | 127 | 53.7 | 6 | 9.0 | 52 | 21.9 | 2 | 3.0 | 7 | 3.0 | 1 | 1.5 | 6 | 1.5 | 4 | 5.9 | 45 | 19.0 |
| 7. Chicago, Ill. | 31 | 136 | 22 | 71.0 | 83 | 61.0 | 4 | 12.9 | 21 | 15.4 | 1 | 3.2 | 0 | 0 | 0 | 0 | 2 | 1.5 | 4 | 12.9 | 30 | 22.1 |
| 8. St. Louis, Mo. | 29 | 93 | 15 | 51.7 | 31 | 33.3 | 11 | 37.9 | 31 | 33.3 | 0 | 0 | 7 | 7.5 | 0 | 0 | 2 | 2.2 | 3 | 10.4 | 22 | 23.7 |
| 9. San Francisco, Calif. | 54 | 150 | 41 | 75.9 | 113 | 75.3 | 2 | 3.7 | 11 | 7.3 | 6 | 11.1 | 10 | 6.7 | 0 | 0 | 3 | 2.0 | 5 | 9.3 | 13 | 8.7 |
| 10. Denver, Colo. | 21 | 65 | 17 | 81.0 | 38 | 58.5 | 1 | 4.7 | 15 | 23.1 | 0 | 0 | 5 | 7.7 | 0 | 0 | 1 | 1.5 | 3 | 14.3 | 6 | 9.2 |
| 11. Washington, D.C. | 21 | 124 | 16 | 76.2 | 83 | 66.8 | 3 | 14.2 | 10 | 8.1 | 1 | 4.8 | 12 | 9.7 | 0 | 0 | 11 | 8.9 | 1 | 4.8 | 8 | 6.5 |
- 1 Percentages are computed horizontally by current fiscal year and total fiscal years.
127 of 127 figures sit in a row or column sum that works out.
Reader’s notes
p. 206. Grid is 23 columns: stub, two "Total" columns, then five outcome groups (Affirmed in full; Modified; Remanded in full; Affirmed in part and remanded in part; Set aside), each with Number/Percent for fiscal year 1971 and for cumulative fiscal years 1966-70. Decimal points: in this scan many percent values show only a gap where the period is printed (e.g. "10 0", "72 4", "58 8", "33 3", "9 7"). Every cell in these columns is a one-decimal percentage, so they are transcribed with the decimal point (10.0, 72.4, 58.8, 33.3, 9.7). No digits were altered. All ten number columns cross-foot exactly: each circuit's five fiscal-year-1971 outcome numbers sum to its Total fiscal year 1971, each circuit's five cumulative numbers sum to its Total fiscal years 1966-70, and every number column sums down to the printed "Total all circuits" line (including 1,463). This independently confirms the number cells. Suspected misprints in the source, transcribed as printed: (a) row "6. Cincinnati, Ohio", column "Affirmed in part and remanded in part / Cumulative fiscal years 1966-70 / Percent" is printed 1.5, but 6 of 237 is 2.5 — the printed value duplicates the 1.5 in the adjacent fiscal-year-1971 percent cell; (b) same row, "Affirmed in full / Cumulative fiscal years 1966-70 / Percent" is printed 53.7, while 127 of 237 is 53.6; (c) row "11. Washington, D.C.", "Affirmed in full / Cumulative fiscal years 1966-70 / Percent" is printed 66.8, while 83 of 124 is 66.9. Elsewhere the table generally truncates rather than rounds (e.g. 70/1,463 printed 4.7, 1/21 printed 4.7, 3/21 printed 14.2). Doubtful glyph: row "9. San Francisco, Calif.", "Set aside / Fiscal year 1971 / Percent" — the second digit is thickened in the scan and could be 3 or 8; read as 9.3 (5 of 54 = 9.3), which fits the table's practice. The 1966-70 ranges are printed with an en dash; transcribed as a hyphen. Row labels keep their printed numbering; trailing abbreviation periods run into the leader dots and are retained (e.g. "2. New York, N.Y.").
Source image
Source data: U.S. NLRB Annual Reports (public domain). Reconstruction by NLRB Stats Archive. Read by claude-opus-5 (effort max, prompt extract_v1) from the 300-dpi scan; stitched by page. Updated October 2026.